SDK quality monitoring
If your application uses the ApsaraVideo Player SDK, you can monitor playback quality of service (QoS) through event tracking data reported by the SDK. Key metrics such as playback success rate, instant startup rate, and stuttering rate help you quickly assess live streaming quality.
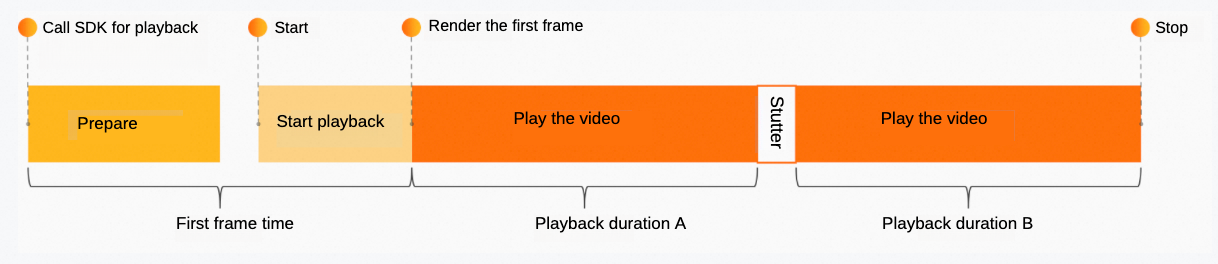
How it works
The live playback data service relies on event tracking data reported by the ApsaraVideo Player SDK. The following diagram illustrates the event tracking logic.
Usage notes
-
You must use the ApsaraVideo MediaBox SDK and ensure that your license is valid and the data reporting feature is enabled.
-
Native player SDKs version 5.4.9.2 and later are supported.
-
Web player SDKs version 2.16.0 and later are supported.
-
To download the player SDK, see SDK overview. For licensing information, see License Management.
Playback data
- Log on to the ApsaraVideo Live console.
-
In the left-side navigation pane, choose .
-
On the Playback Data tab, select an application name, and click Query.
NoteThe application name must match the application title configured for your ApsaraVideo Player SDK license. Otherwise, the query returns no data.
You can filter data by the following dimensions:
-
Filter by client type, OS type, resolution, and network type.
-
You can query data for a custom time range within the last three days. A single query cannot span multiple days.
-
To filter by SDK version, encoding format, video format, hardware decoding status, internet service provider, domain name, or province, click New Filter Condition. You can also save frequently used filter rules for future use.
-
-
The application overview provides the following QoS metrics to help you assess playback service quality.
NoteThe average playback frame rate (fps) metric is available only for video scenarios. Other metrics are available for audio-only and audio-video scenarios.
Metric
Description
Average first frame duration (ms)
The time it takes for the first frame to render after a user requests playback.
Stuttering rate by duration (%)
The total stuttering duration as a percentage of the total playback duration. Formula: Total stuttering duration / Total playback duration.
Average playback frame rate (fps)
The average number of video frames rendered per second during playback.
Downlink bitrate (Kbps)
The network download speed during live playback.
Instant startup rate (%)
The percentage of streams that start playing within 1 second. Formula: Number of streams starting in ≤ 1s / Total number of playback sessions.
Slow startup rate (%)
The percentage of streams that take 3 seconds or longer to start. Formula: Number of streams starting in ≥ 3s / Total number of playback sessions.
Playback success rate (%)
The percentage of successful playback sessions. Formula: Number of successful playbacks / Total number of playbacks.
CPU usage (%)
The percentage of CPU resources consumed during live playback.
Single-point tracing
If a playback error occurs, use Single-point Tracing to trace a specific user or session end-to-end. This helps you diagnose root causes and improve the viewer experience.
- Log on to the ApsaraVideo Live console.
-
In the left-side navigation pane, choose .
-
Click the Single-point Tracing tab, and enter the TraceID or UUID provided at player creation to run a query.
You can set a date range for the query. The results include a first frame duration trend chart and a data table. The table columns include TraceID, Video ID/URL, SessionID, First Frame Duration (ms), Status, Current Playback Duration (s), and Stuttering Duration (ms).
-
In the Actions column, click View Details to view a session's detailed information.