
ACOS Service Matrix
Remove data silos rather than creating one
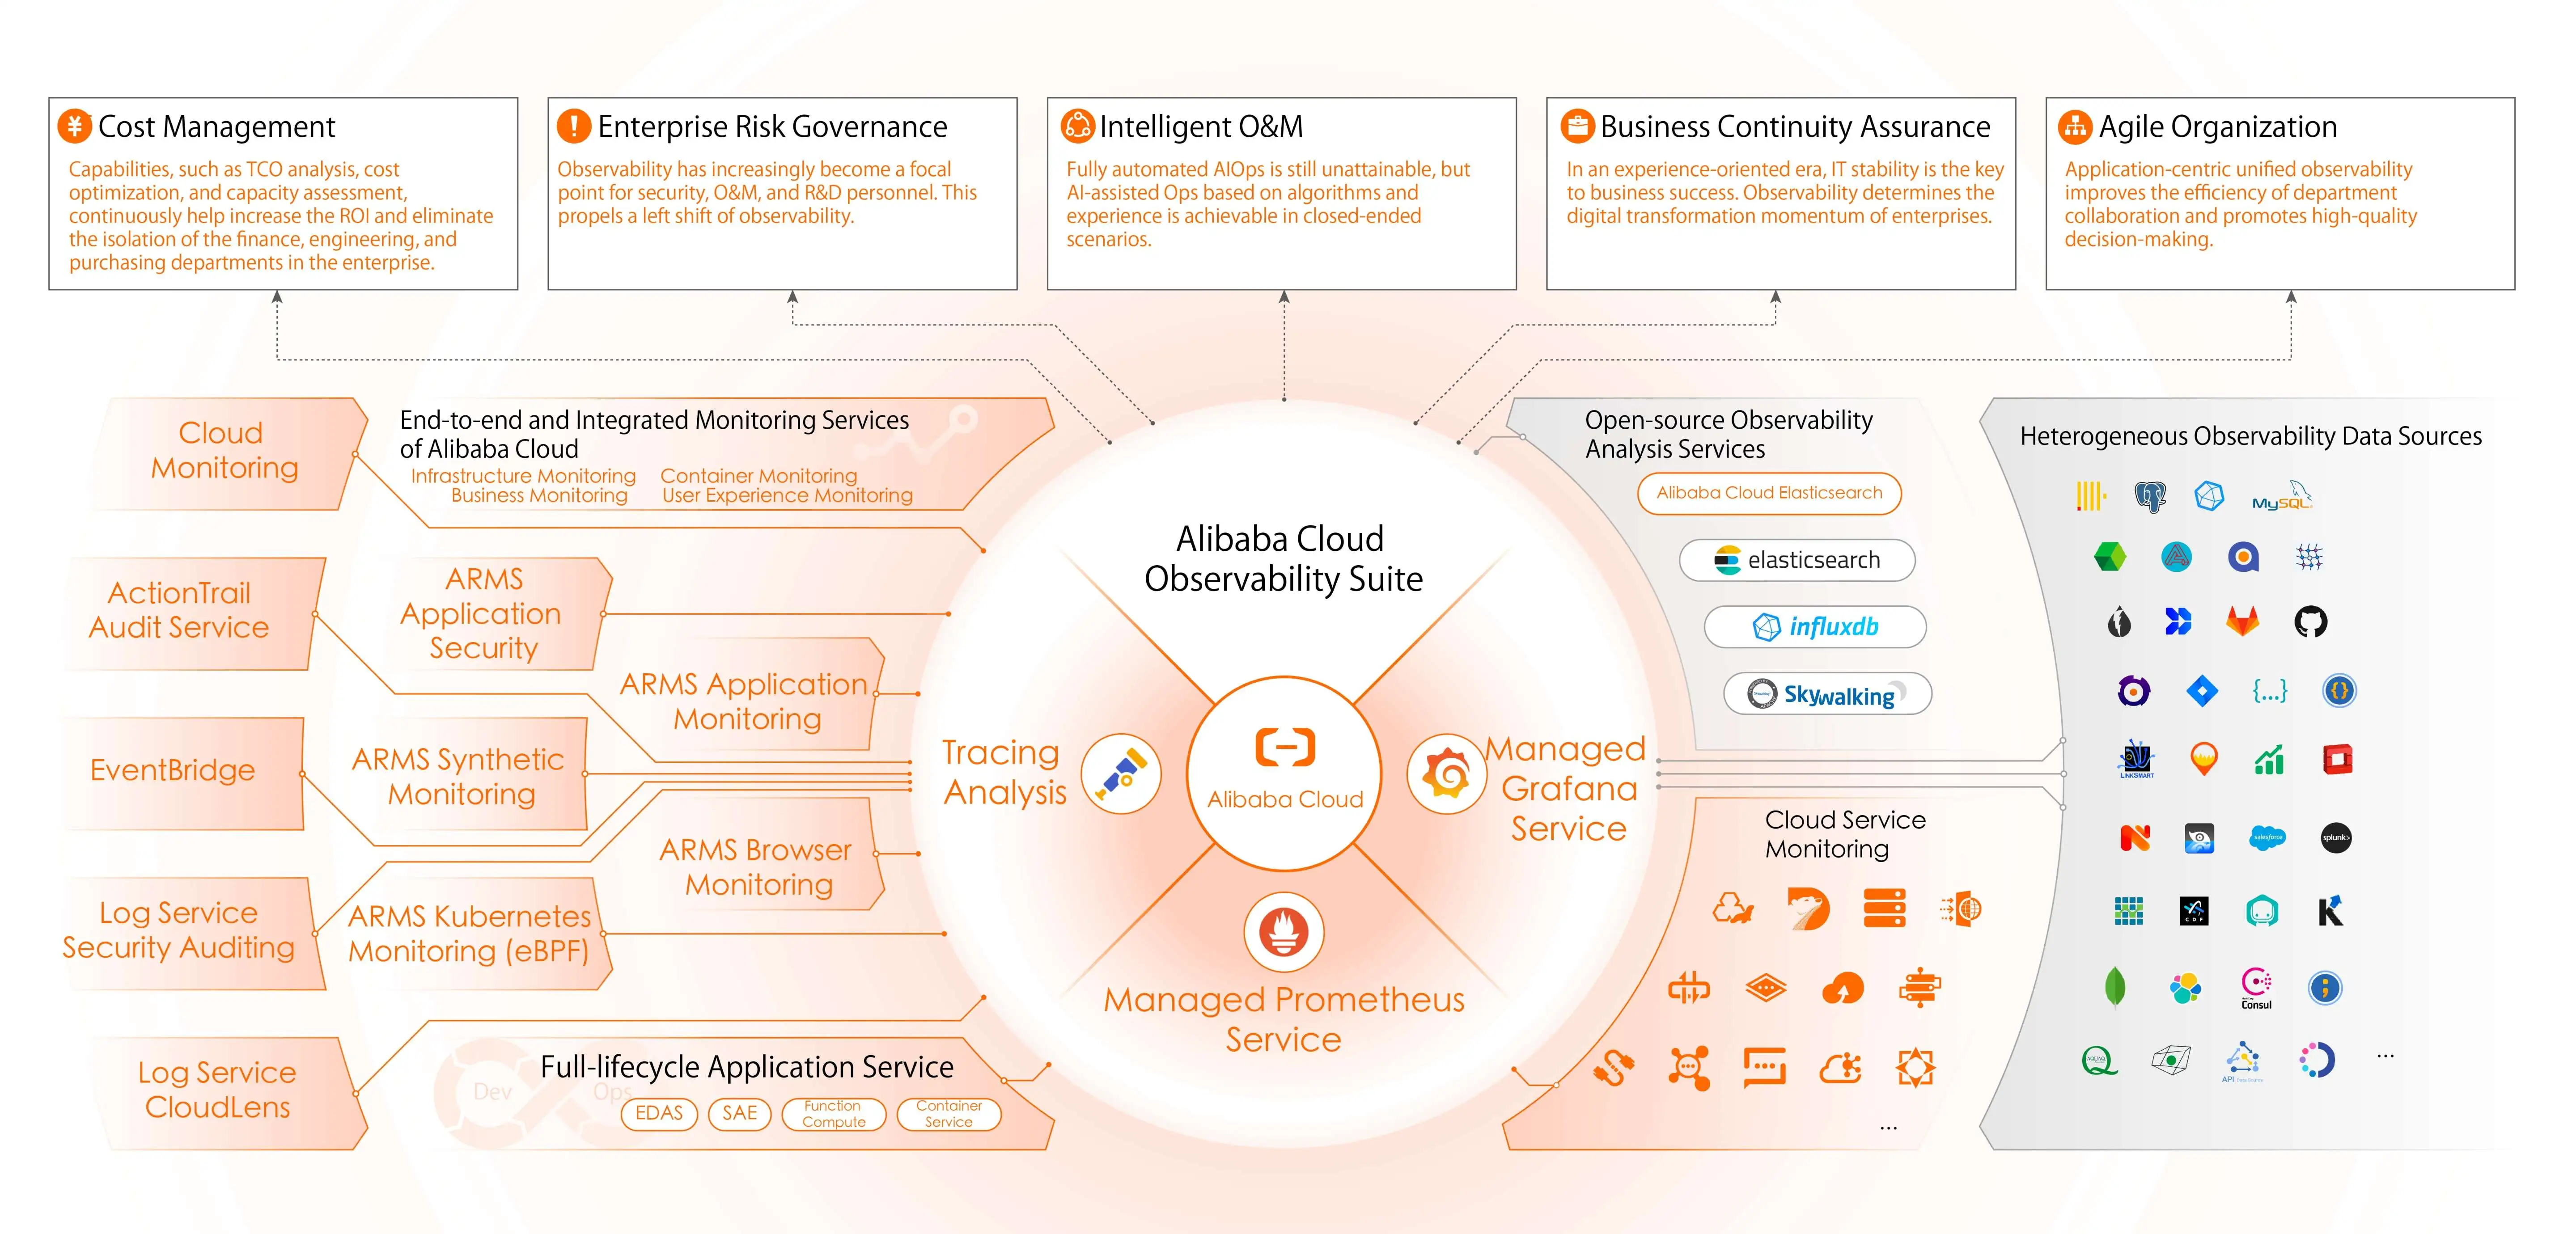
Service Matrix

Application Real-Time Monitoring Service (ARMS)
Offers multiple sub-services such as Browser Monitoring and Application Monitoring, and is applicable to scenarios including web pages and distributed applications. It helps implement full-stack performance monitoring and end-to-end tracing.

Prometheus Service
A fully managed monitoring service built based on open source Prometheus. By default, it integrates common cloud services and is compatible with open source components. Dashboards and the alerting feature are also available for use.

Grafana Service
A visual platform developed based on open source Grafana. By default, Grafana is integrated with various data sources and provides abundant data templates.
Tracing Analysis
Provides a set of tools for distributed application development, such as trace mapping and trace topology. It helps analyze and diagnose performance bottlenecks in a distributed application architecture with efficiency, which saves time in locating exceptions.
Scenarios
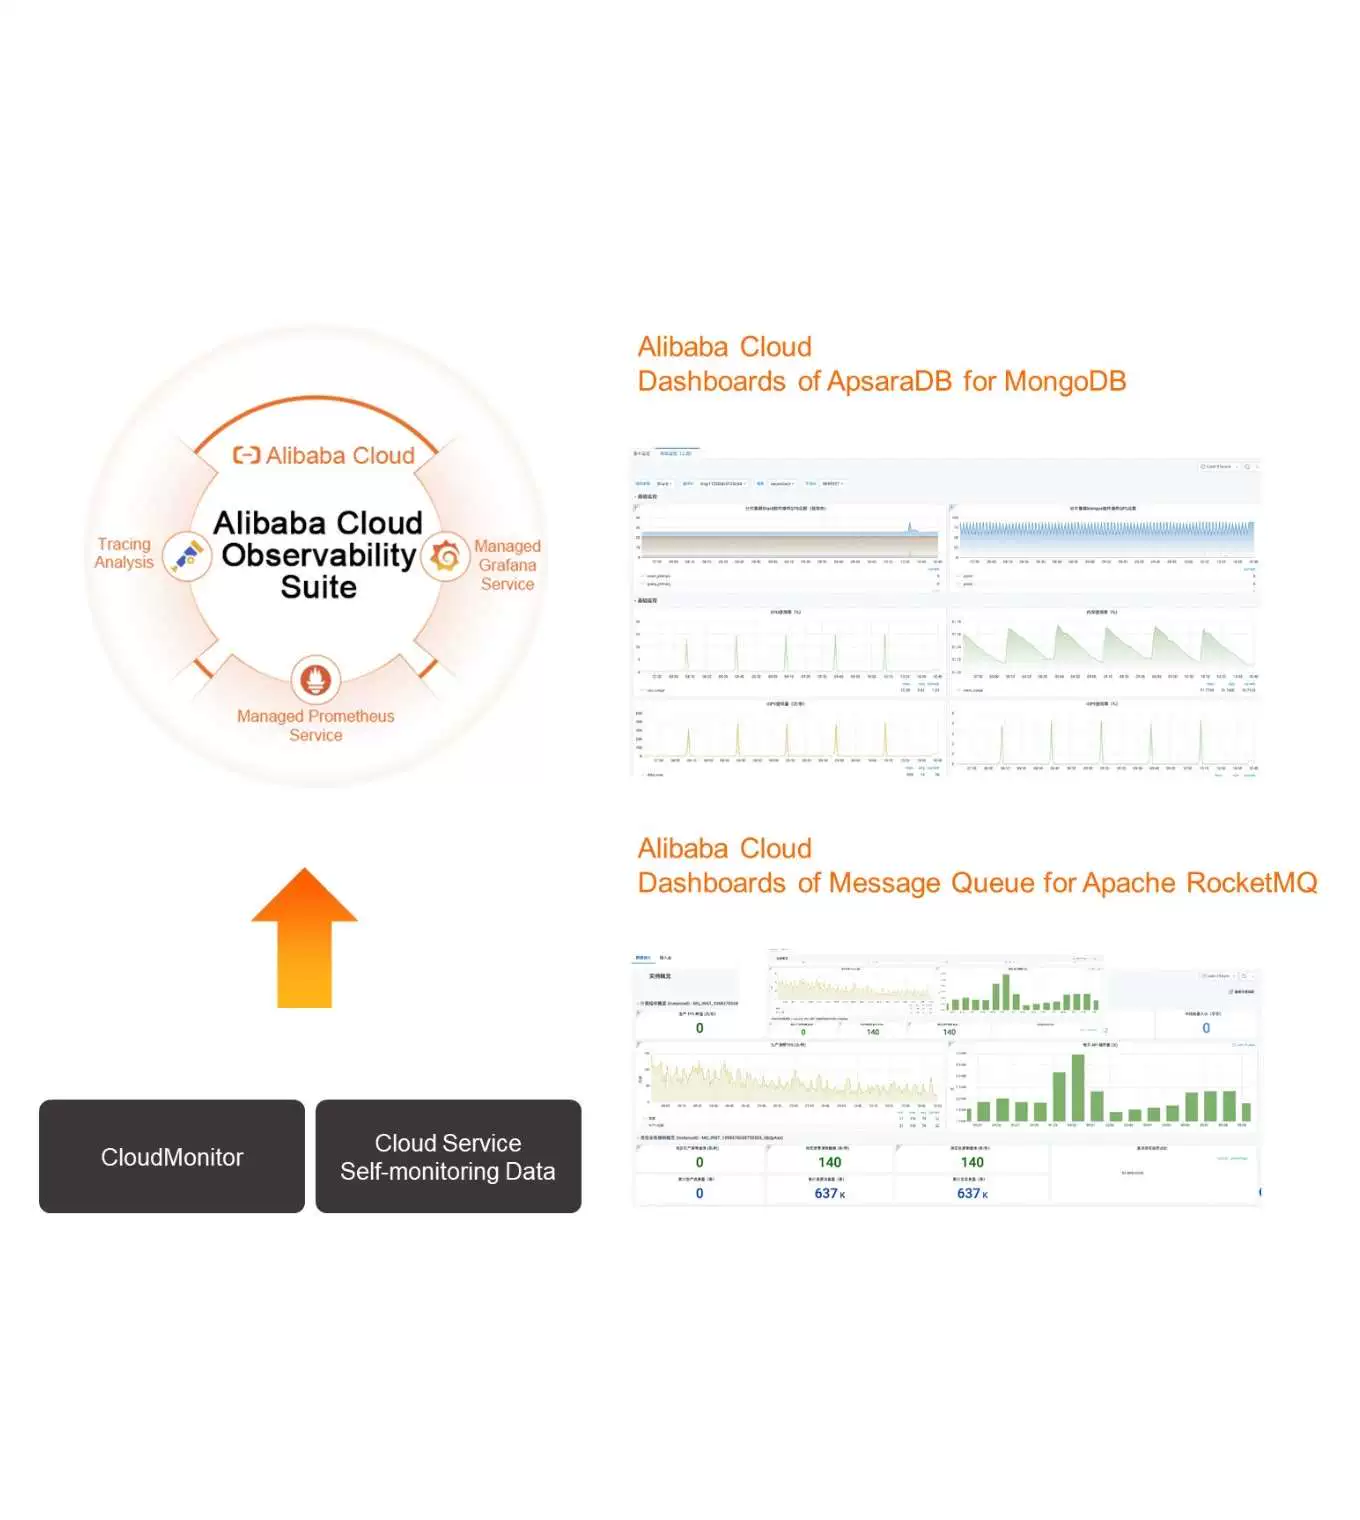
ACOS + CloudMonitor
Provides ready-to-use monitoring dashboards, preset alert rules, and metrics associated with tags and supports more than 40 types of cloud services added to CloudMonitor, and over 20 types of cloud services monitored by Prometheus Service.
Procedure
-
Step 1: Activate Grafana Professional Edition
Create a Grafana workspace.
-
Step 2: Activate Prometheus Service
Create a Prometheus instance to monitor a cloud service.
-
Step 3: Add Required Cloud Services to Prometheus Service


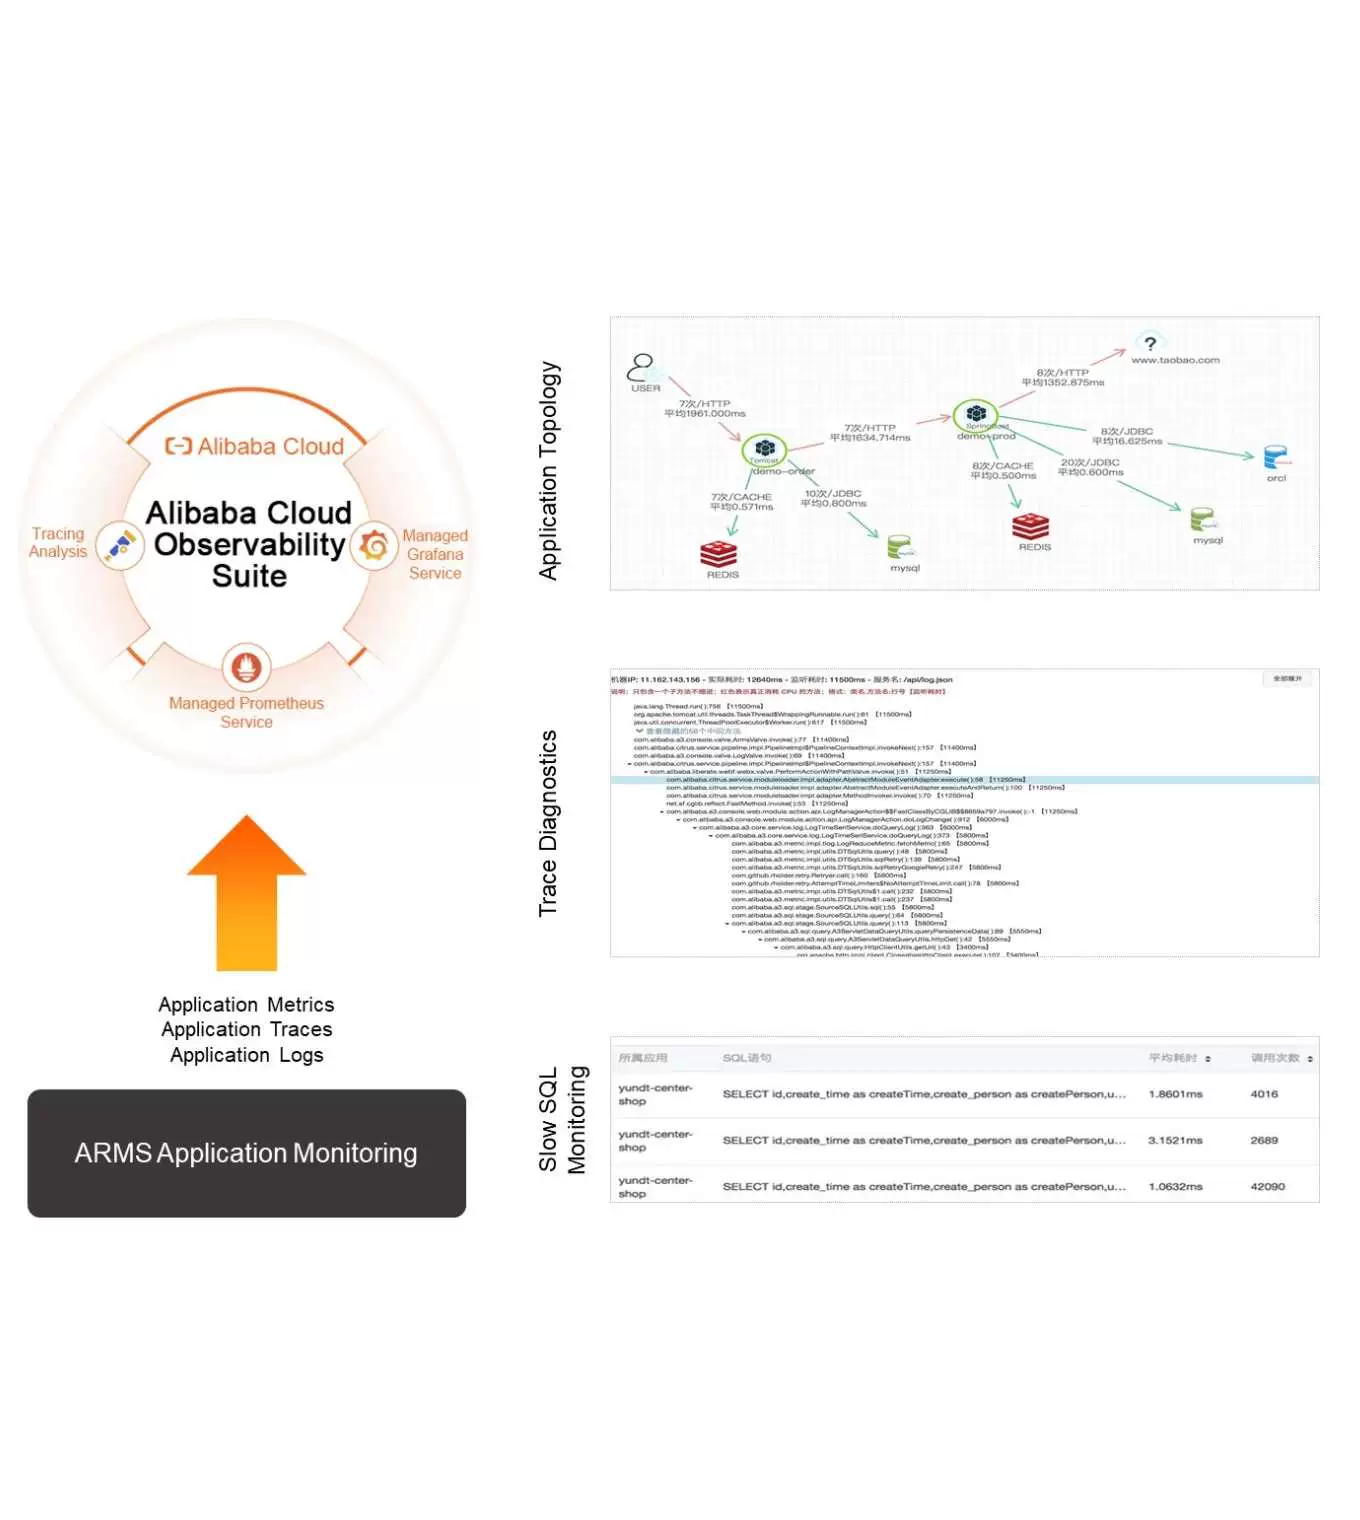
ACOS + ARMS Application Monitoring
ARMS Application Monitoring: An application performance management (APM) service developed by Alibaba Cloud. It can continuously monitor the performance of applications, quickly locate abnormal and slow API operations, and detect system bottlenecks. This significantly improves the efficiency of online troubleshooting.
Procedure
-
Activate Grafana Professional Edition
Create a Grafana workspace.
-
Activate ARMS
Connect applications to ARMS Application Monitoring.
-
Integrate ARMS Application Monitoring into Grafana

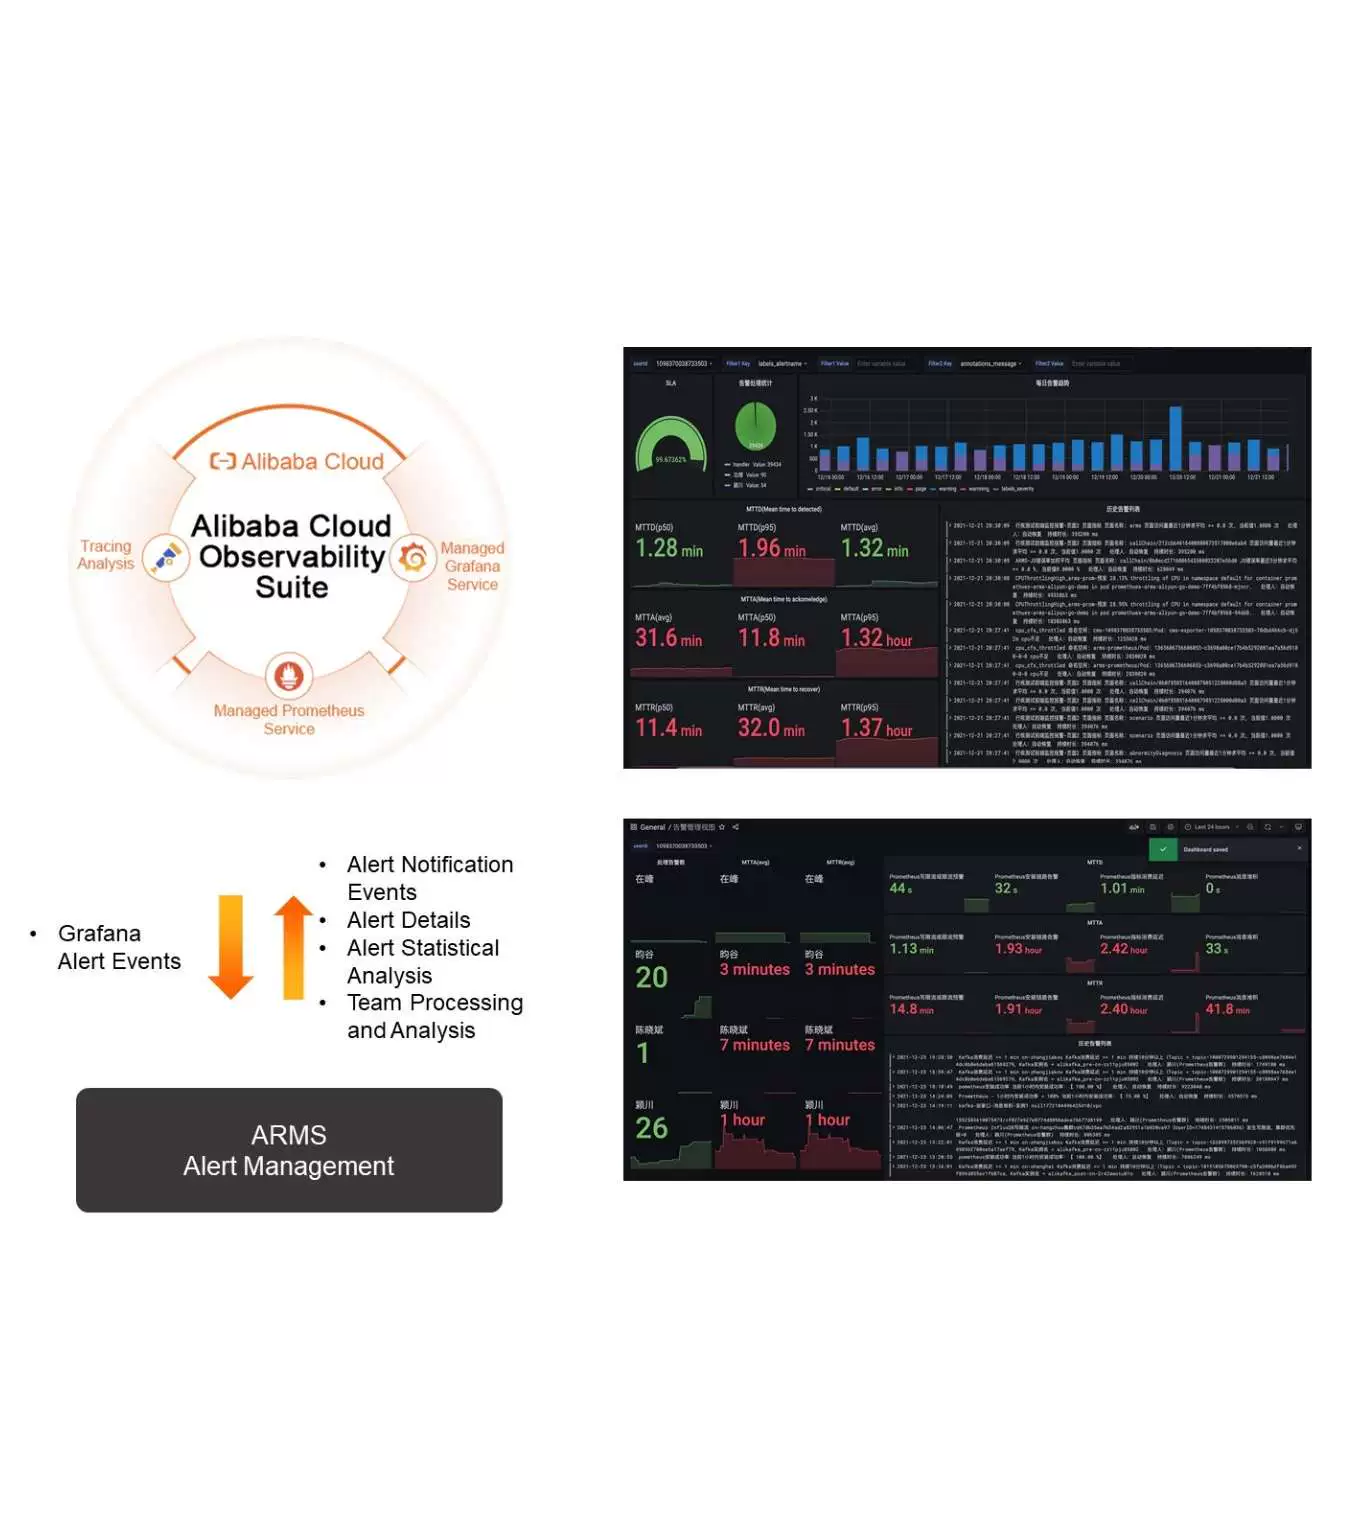
ACOS + ARMS Alert Management
Supports unified management of alert events generated for various cloud services. You can merge and suppress alerts, use intelligent shift schedules and automatic escalation for alert notifications, and specify notification methods as needed, including text messages, phone calls, DingTalk chatbots, emails, and Lark chatbots. ARMS Alert Management can connect to multiple collaboration systems, such as Jira and PagerDuty.
Procedure
-
Activate Grafana Professional Edition
Create a Grafana workspace.
-
Activate Prometheus Service
Create a Prometheus instance.
-
Activate ARMS
Connect monitoring services to ARMS Alert Management.
-
Integrate ARMS Alert Management into Grafana Service
Add alert dashboards in Cloud Service Integration Center.
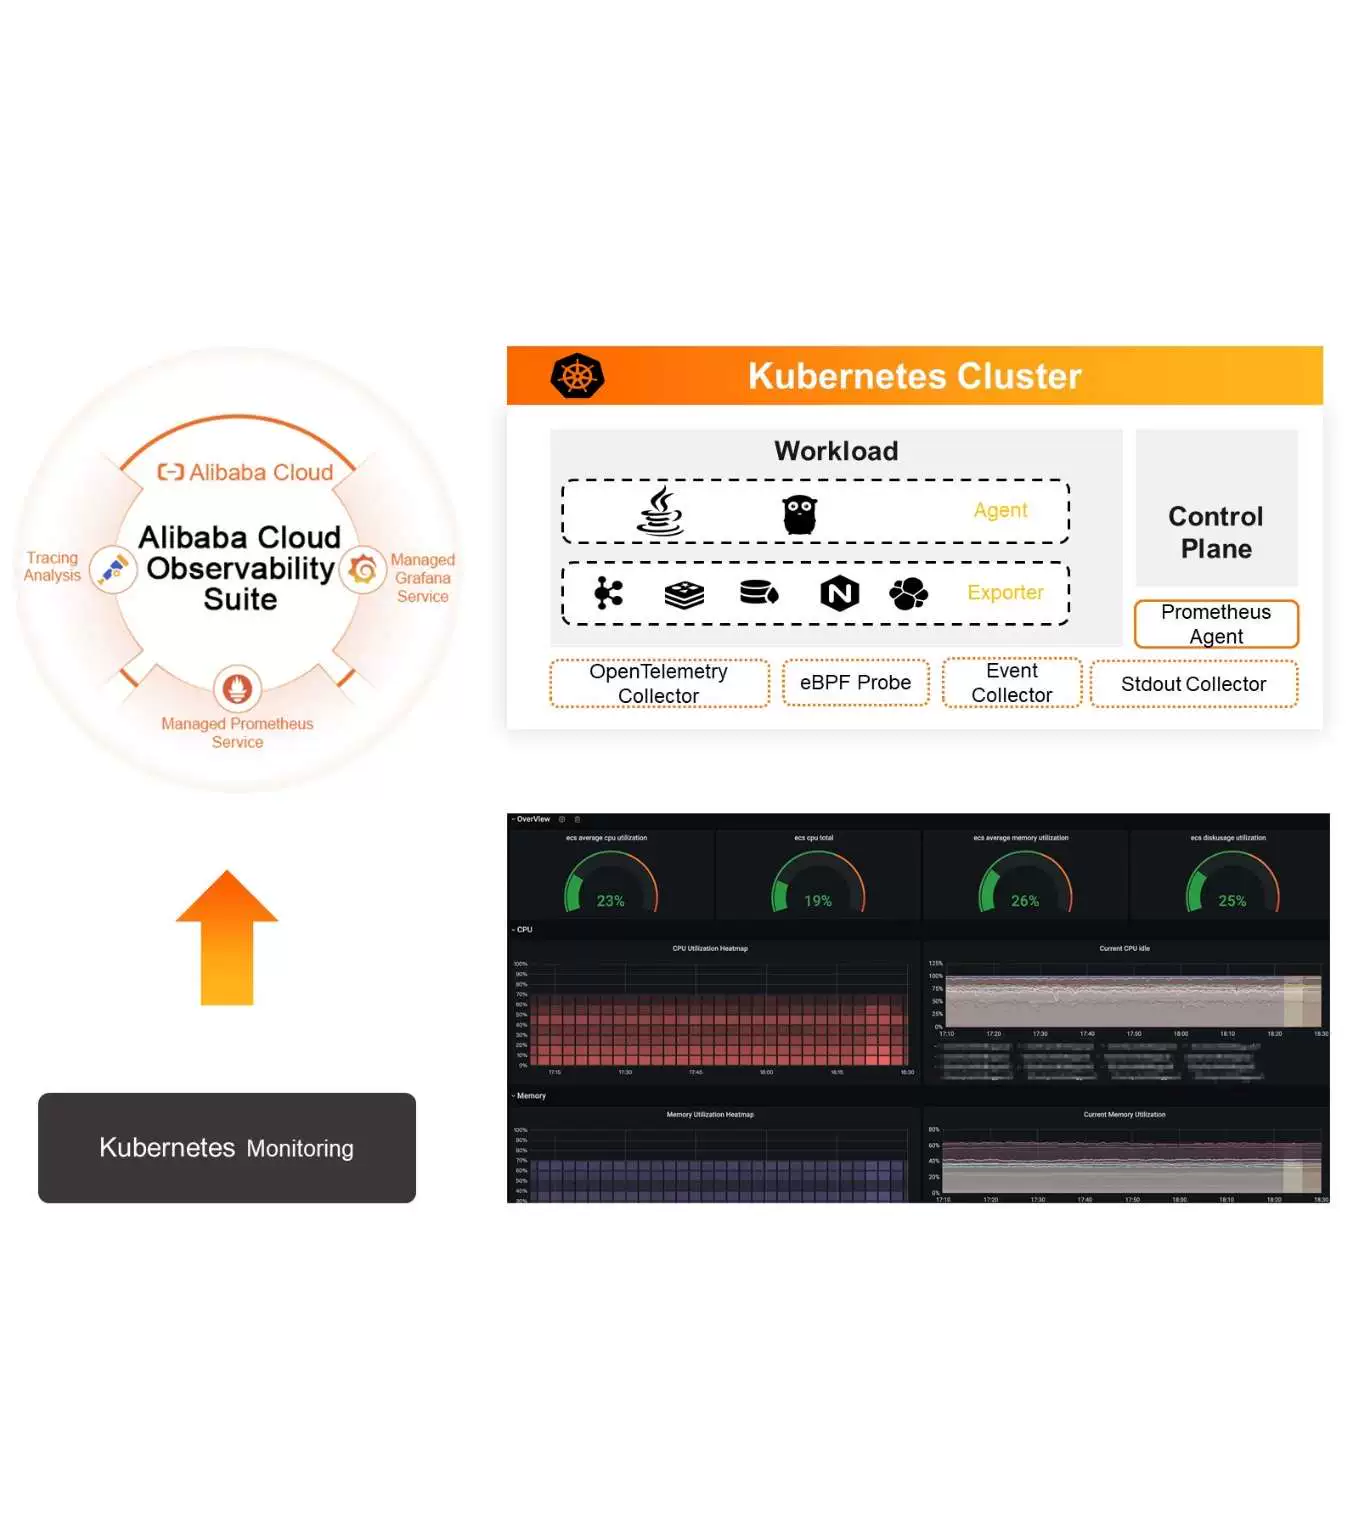
ACOS + Container Service for Kubernetes (ACK)
Non-intrusive and ready-to-use services that feature workload and application performance monitoring, the interconnection of workload resource monitoring and network performance monitoring, major component monitoring on the control plane, monitoring dashboards and alerts for key events, and diagnostics and troubleshooting for stdout logs.
Procedure
-
Activate Grafana Professional Edition
Create a Grafana workspace.
-
Activate Prometheus Service
Create a Prometheus instance.
-
Create a Prometheus Instance for an ACK Cluster
-
Synchronize Prometheus Service to Grafana Service

