Release date
2024-01-22
Data sources
Support for the ShenTong data source has been added.
For additional details, please refer to the referenced document.
Added support for the integration of TiDB, MariaDB, and Lindorm multimodal SQL data sources.
For more information, see self-built data source TiDB, Alibaba Cloud data source MariaDB, self-built data source MariaDB, cloud data source Alibaba Lindorm.
Spark SQL data sources support CLB Server Load Balancer.
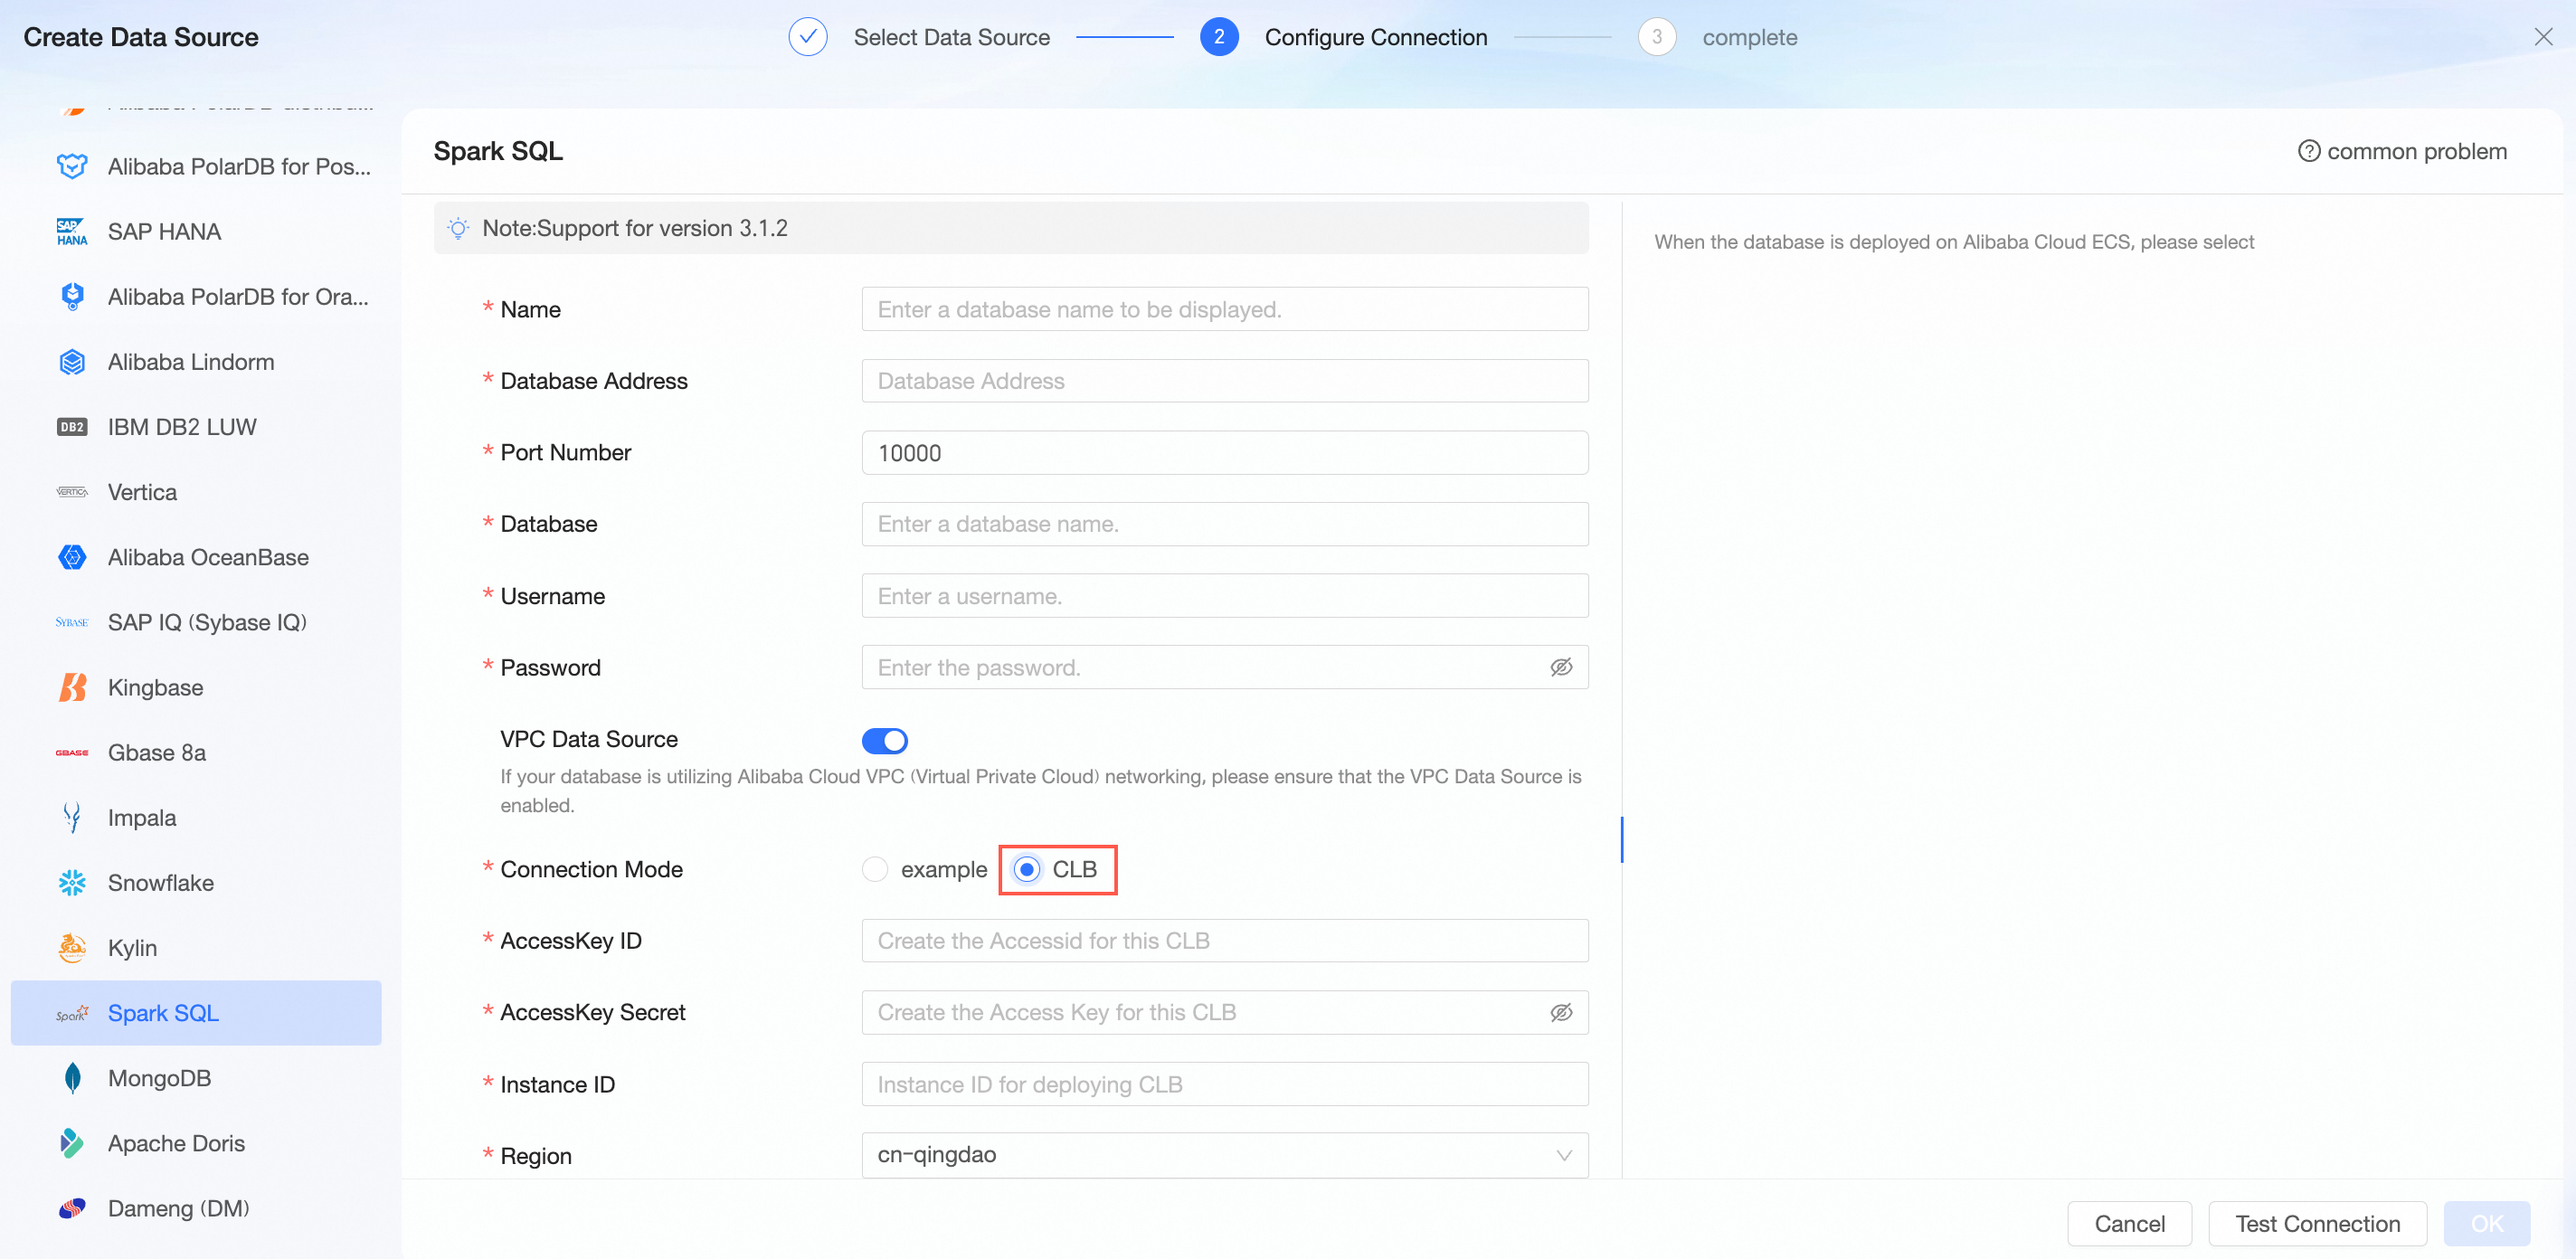
For more information, see self-managed data source Spark SQL.
The Spark data source supports trend/multidimensional analysis tables (average/accumulation).
For more information, see the data source function item list.
Self-built data source StarRocks supports CLB load balancing.
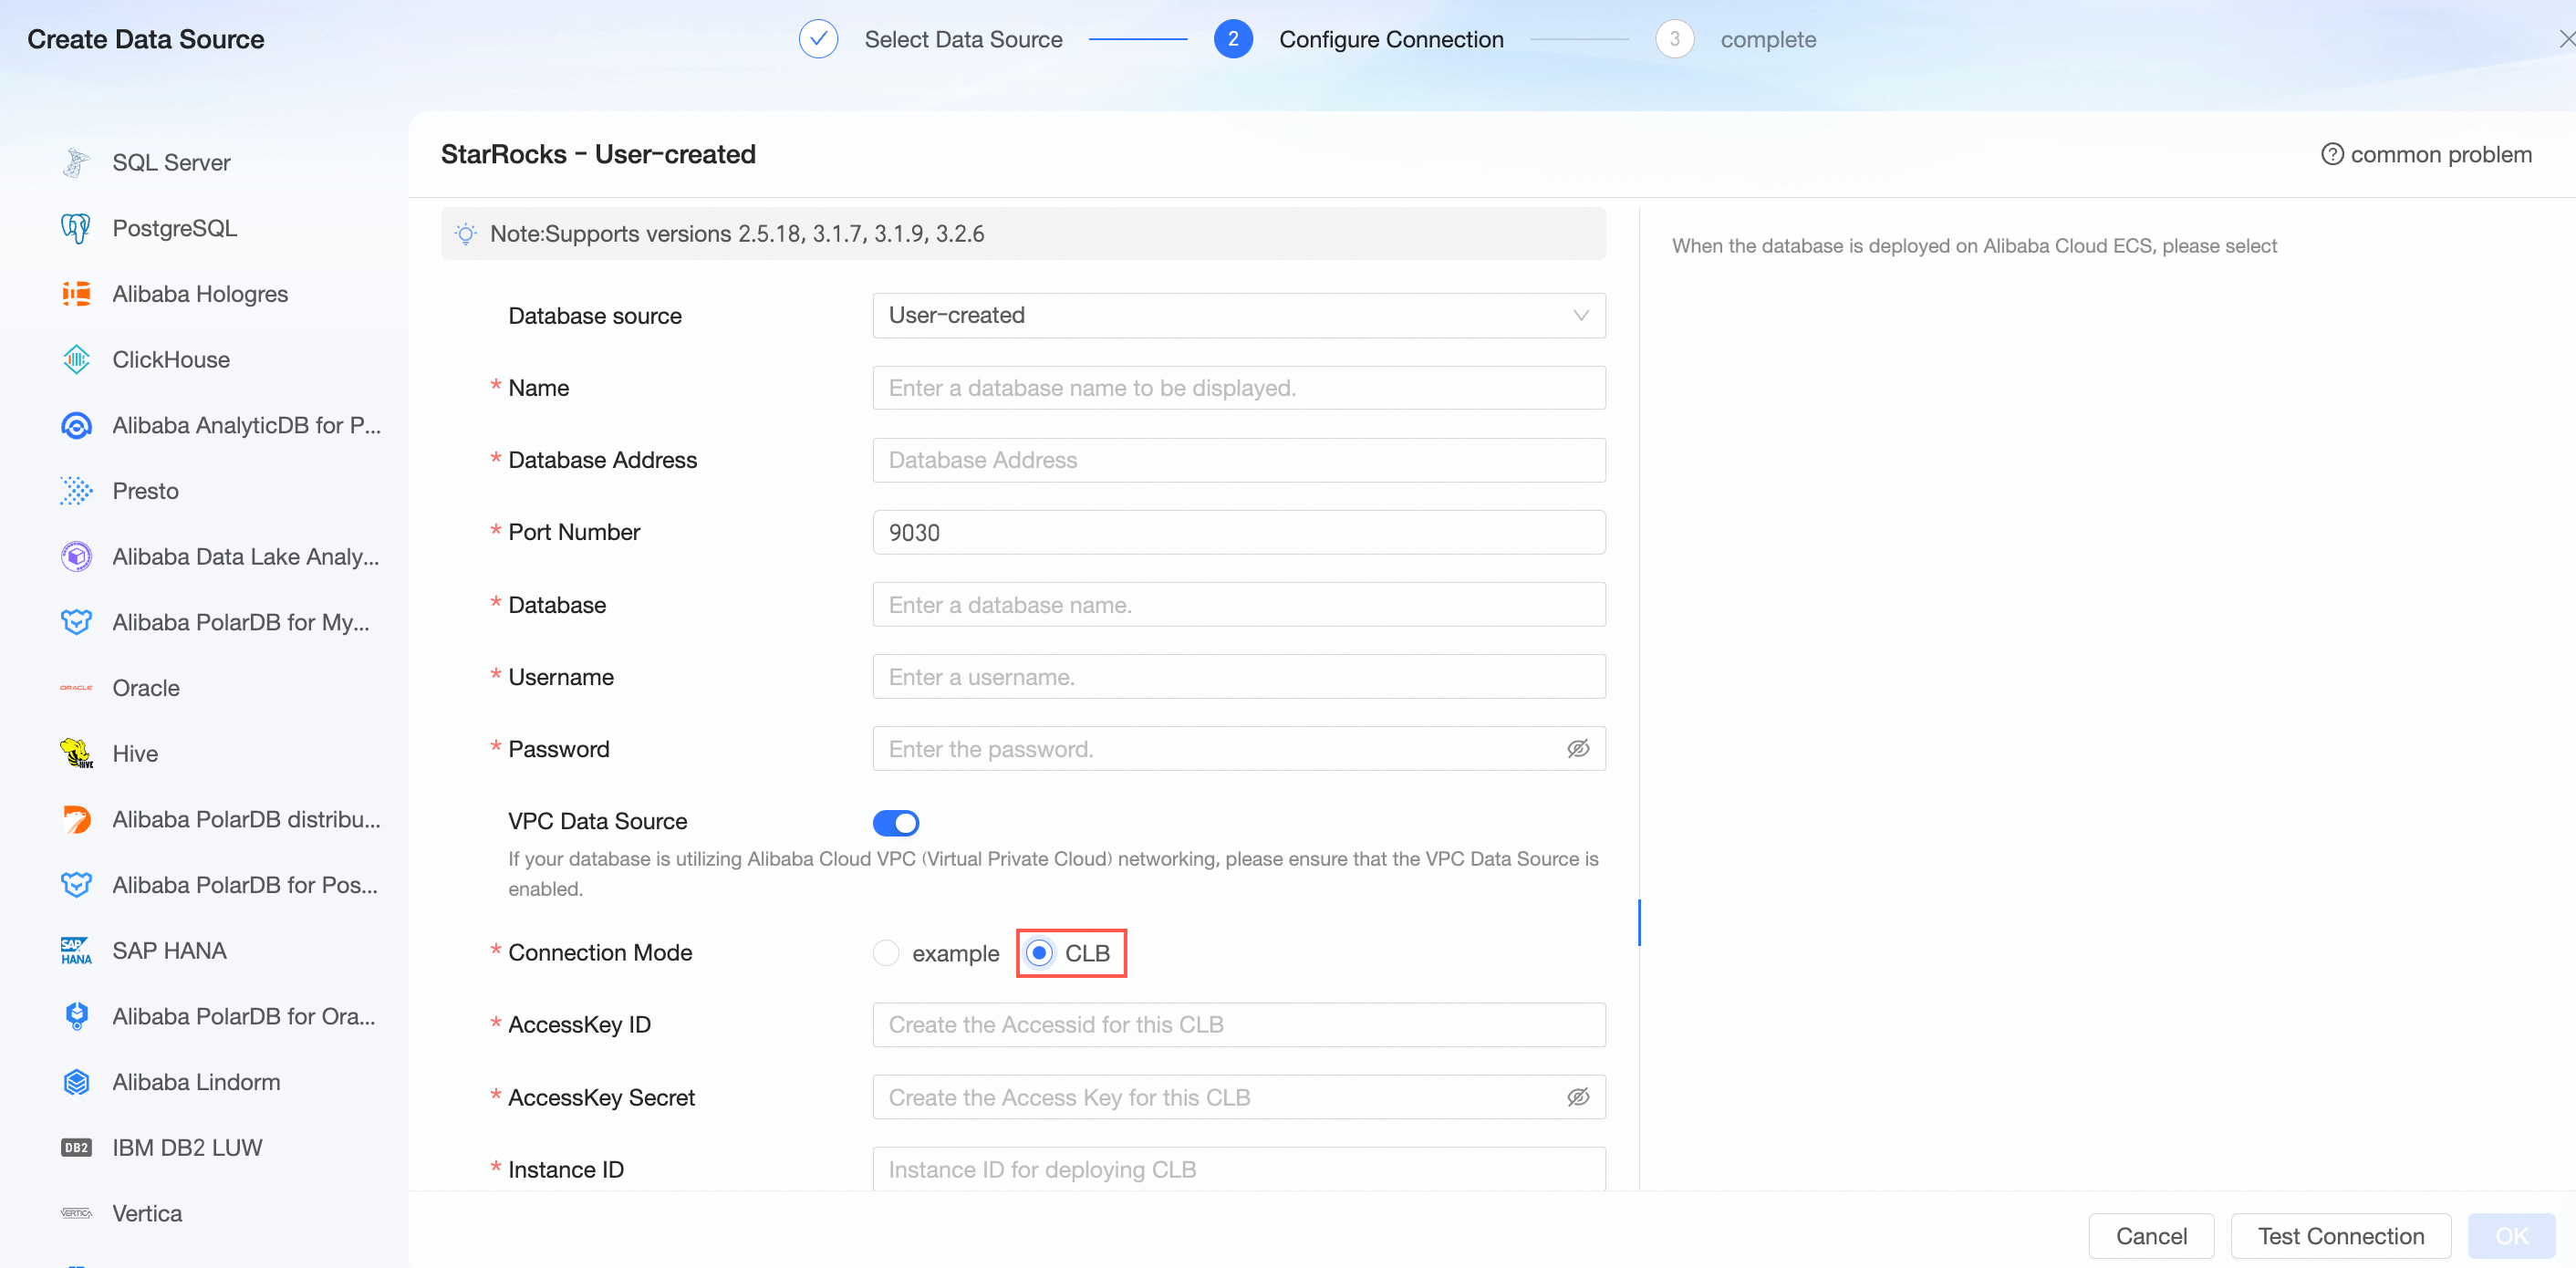
For more information, see self-built data source StarRocks.
The supported StarRocks database versions have been updated. The currently supported versions are: 2.5.18, 3.1.7, 3.1.9, and 3.2.6.
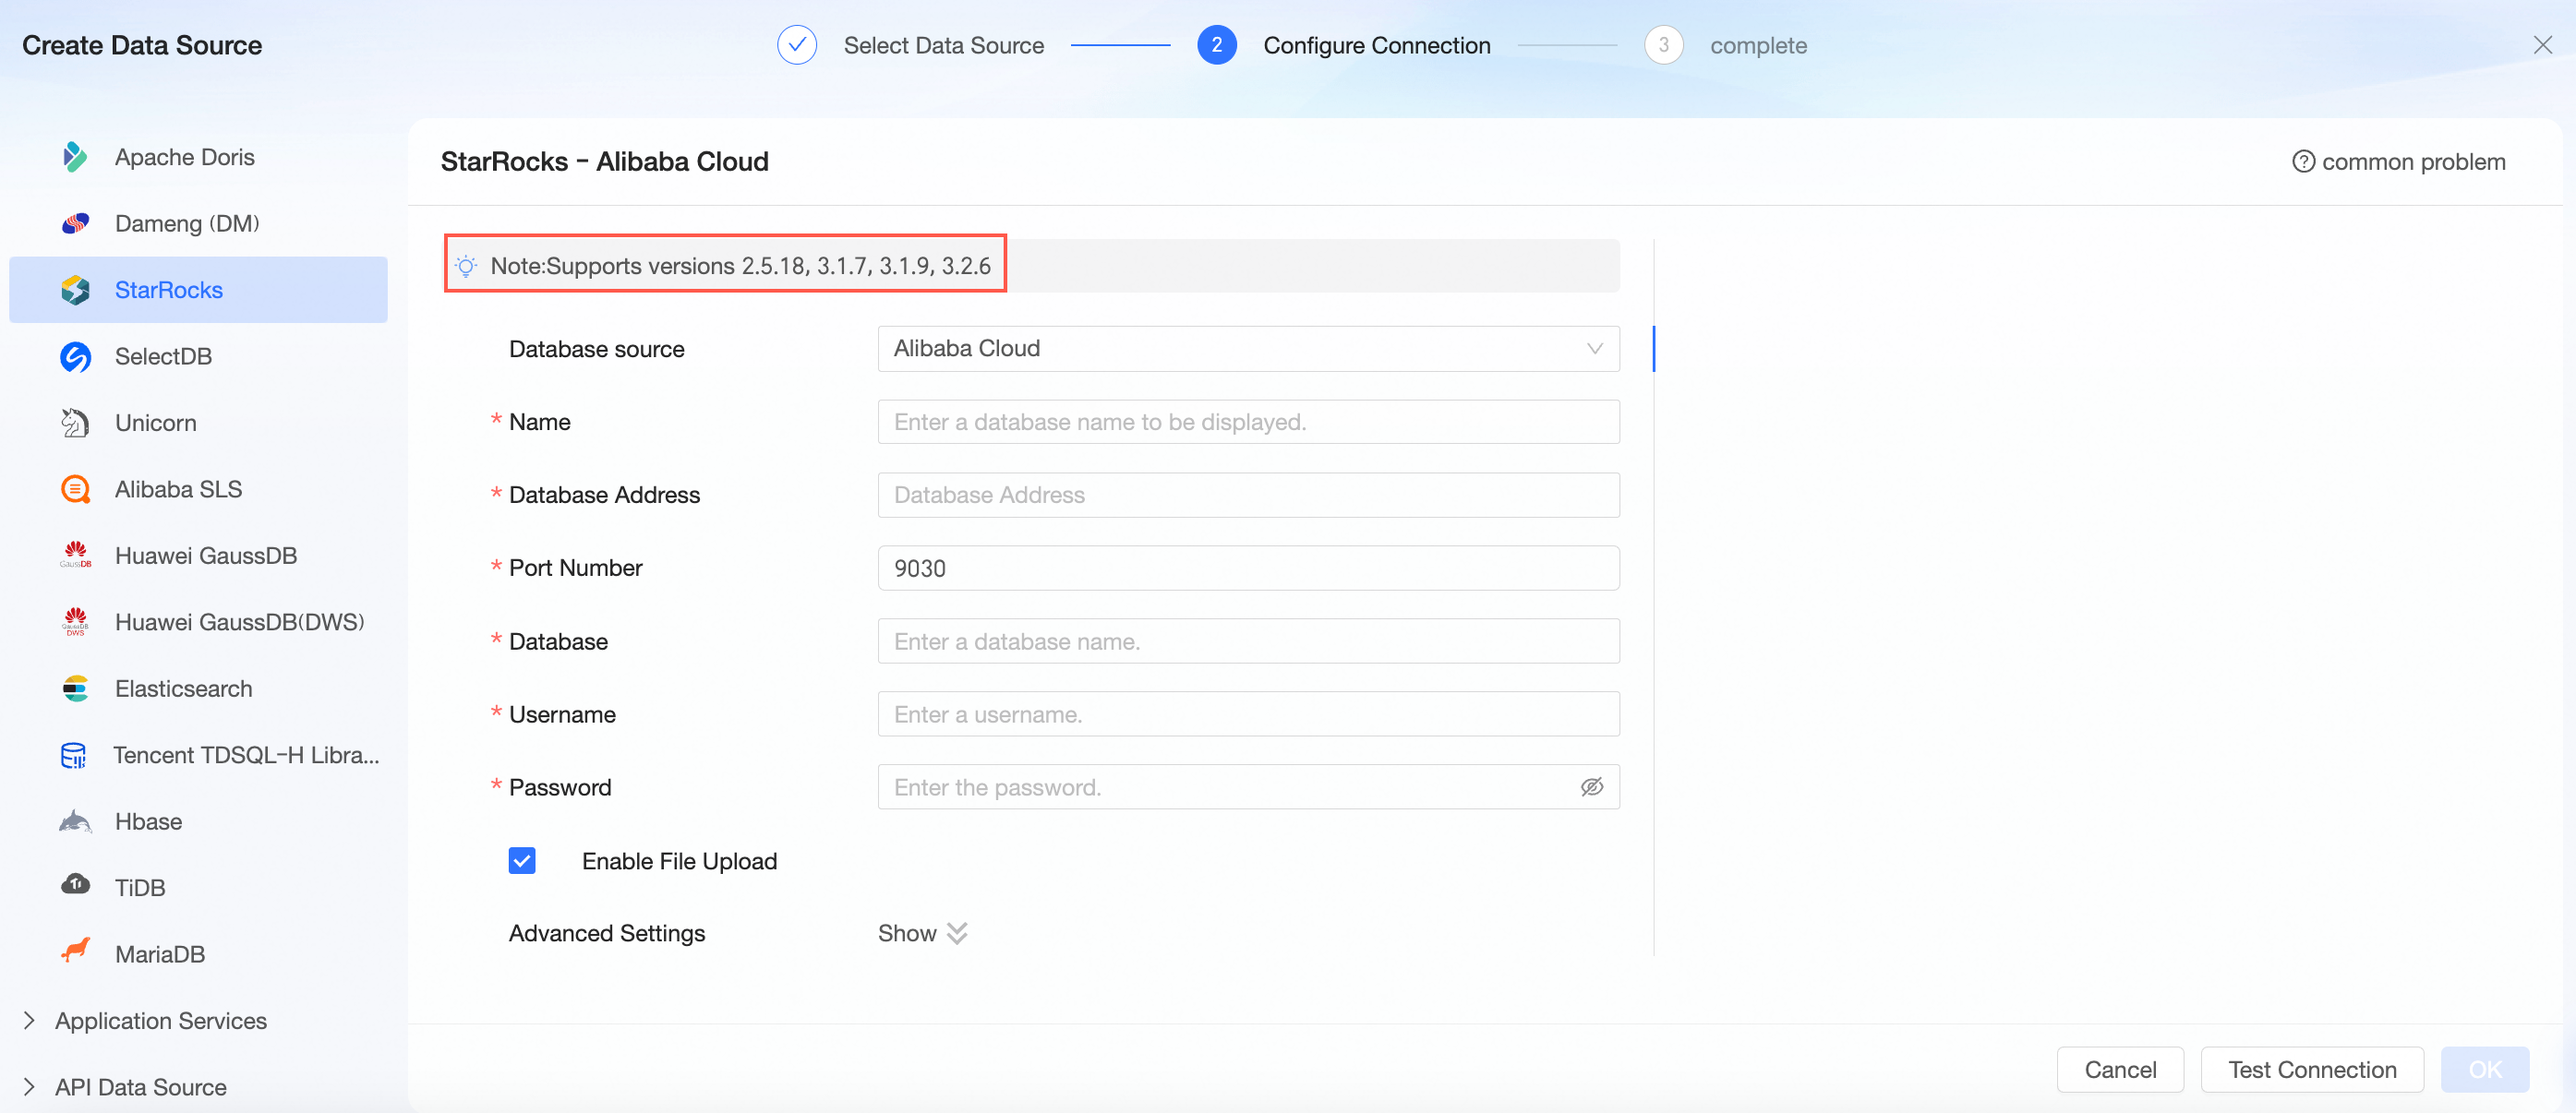
For more information, see self-built data source StarRocks and Alibaba Cloud data source StarRocks.
File upload supports multi-sheet upload and data preview. Error messages are optimized to locate specific erroneous fields.
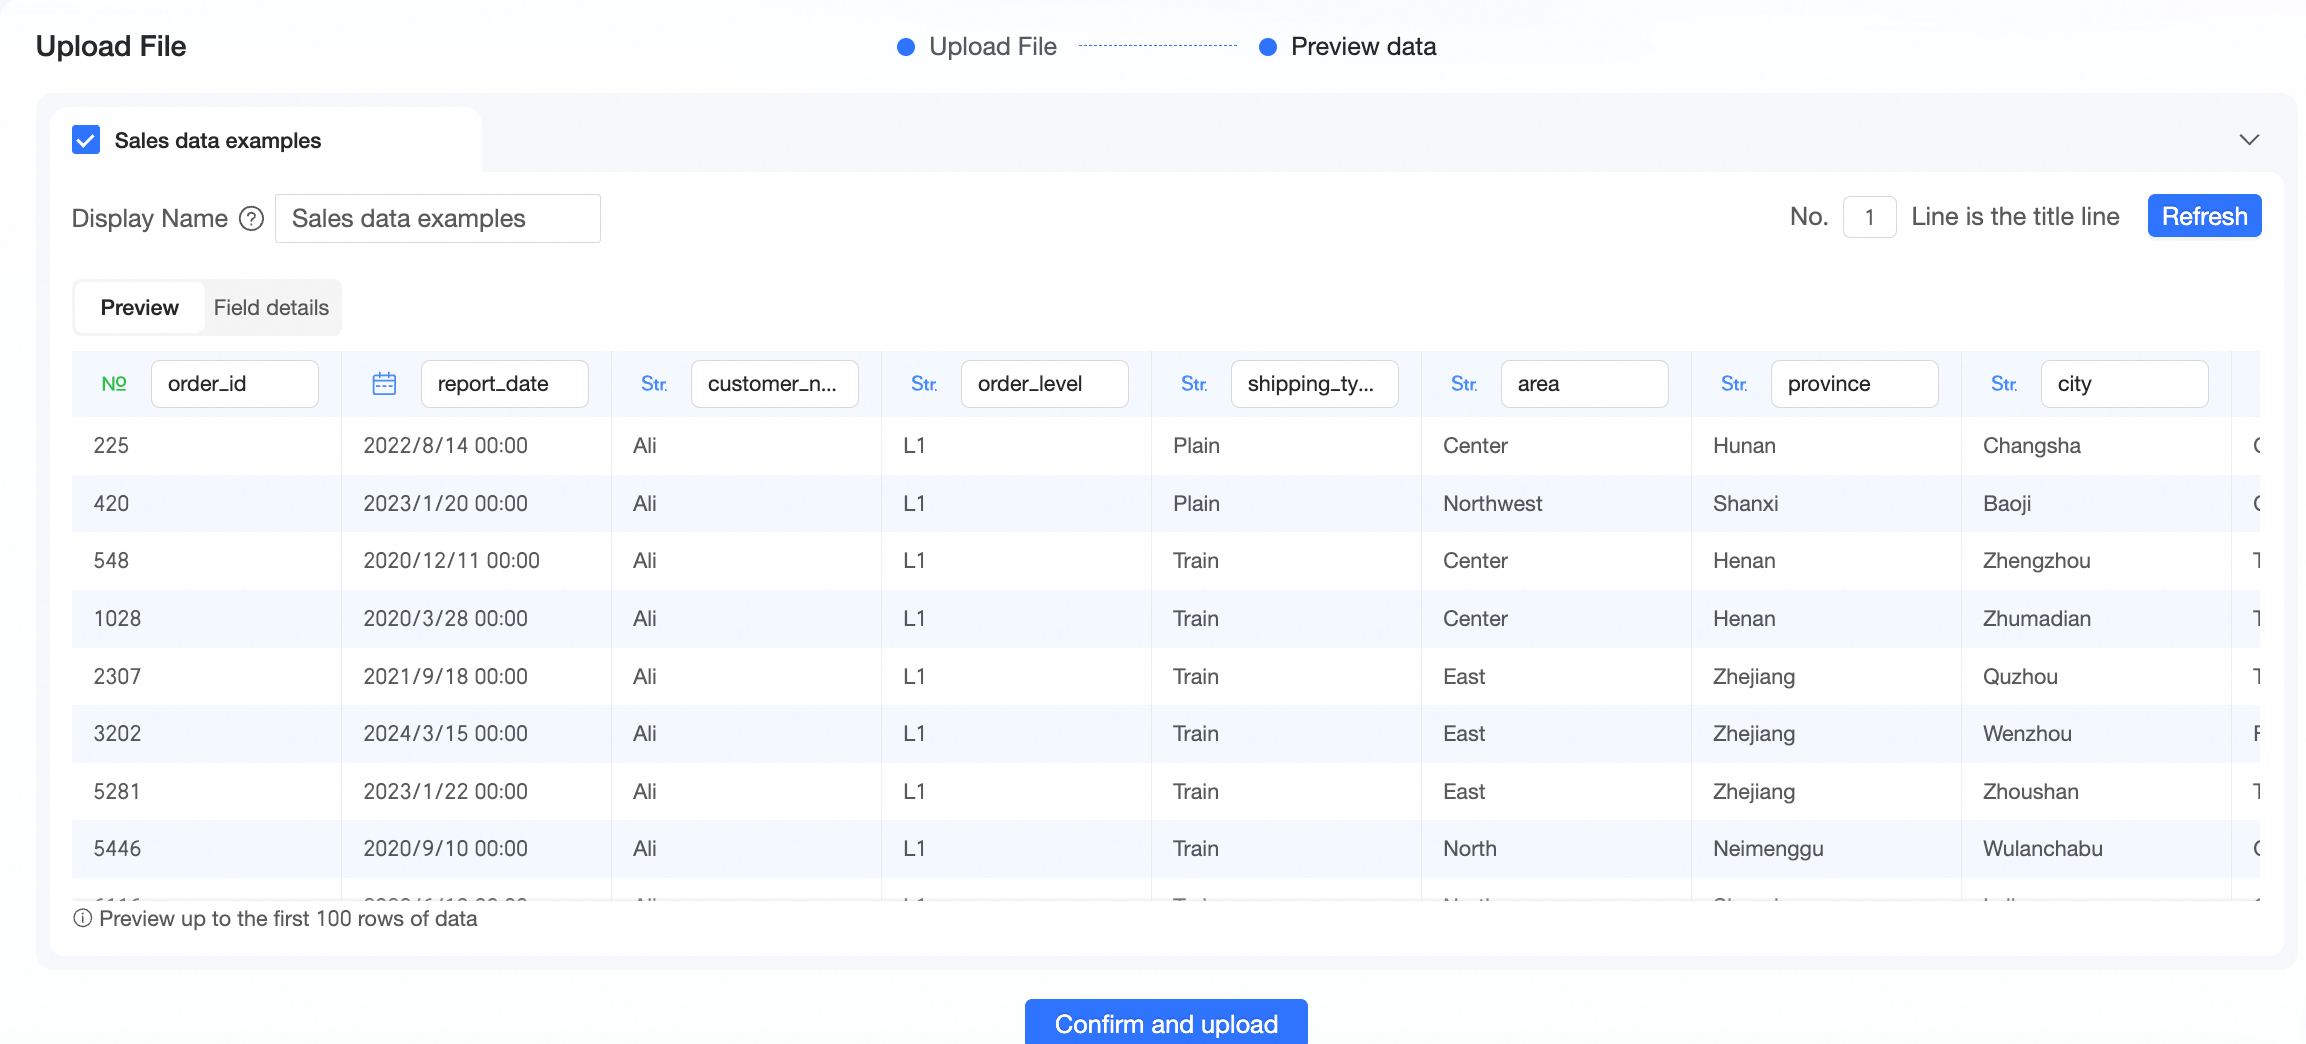
For more information, see add a file to a data source.
Data reporting
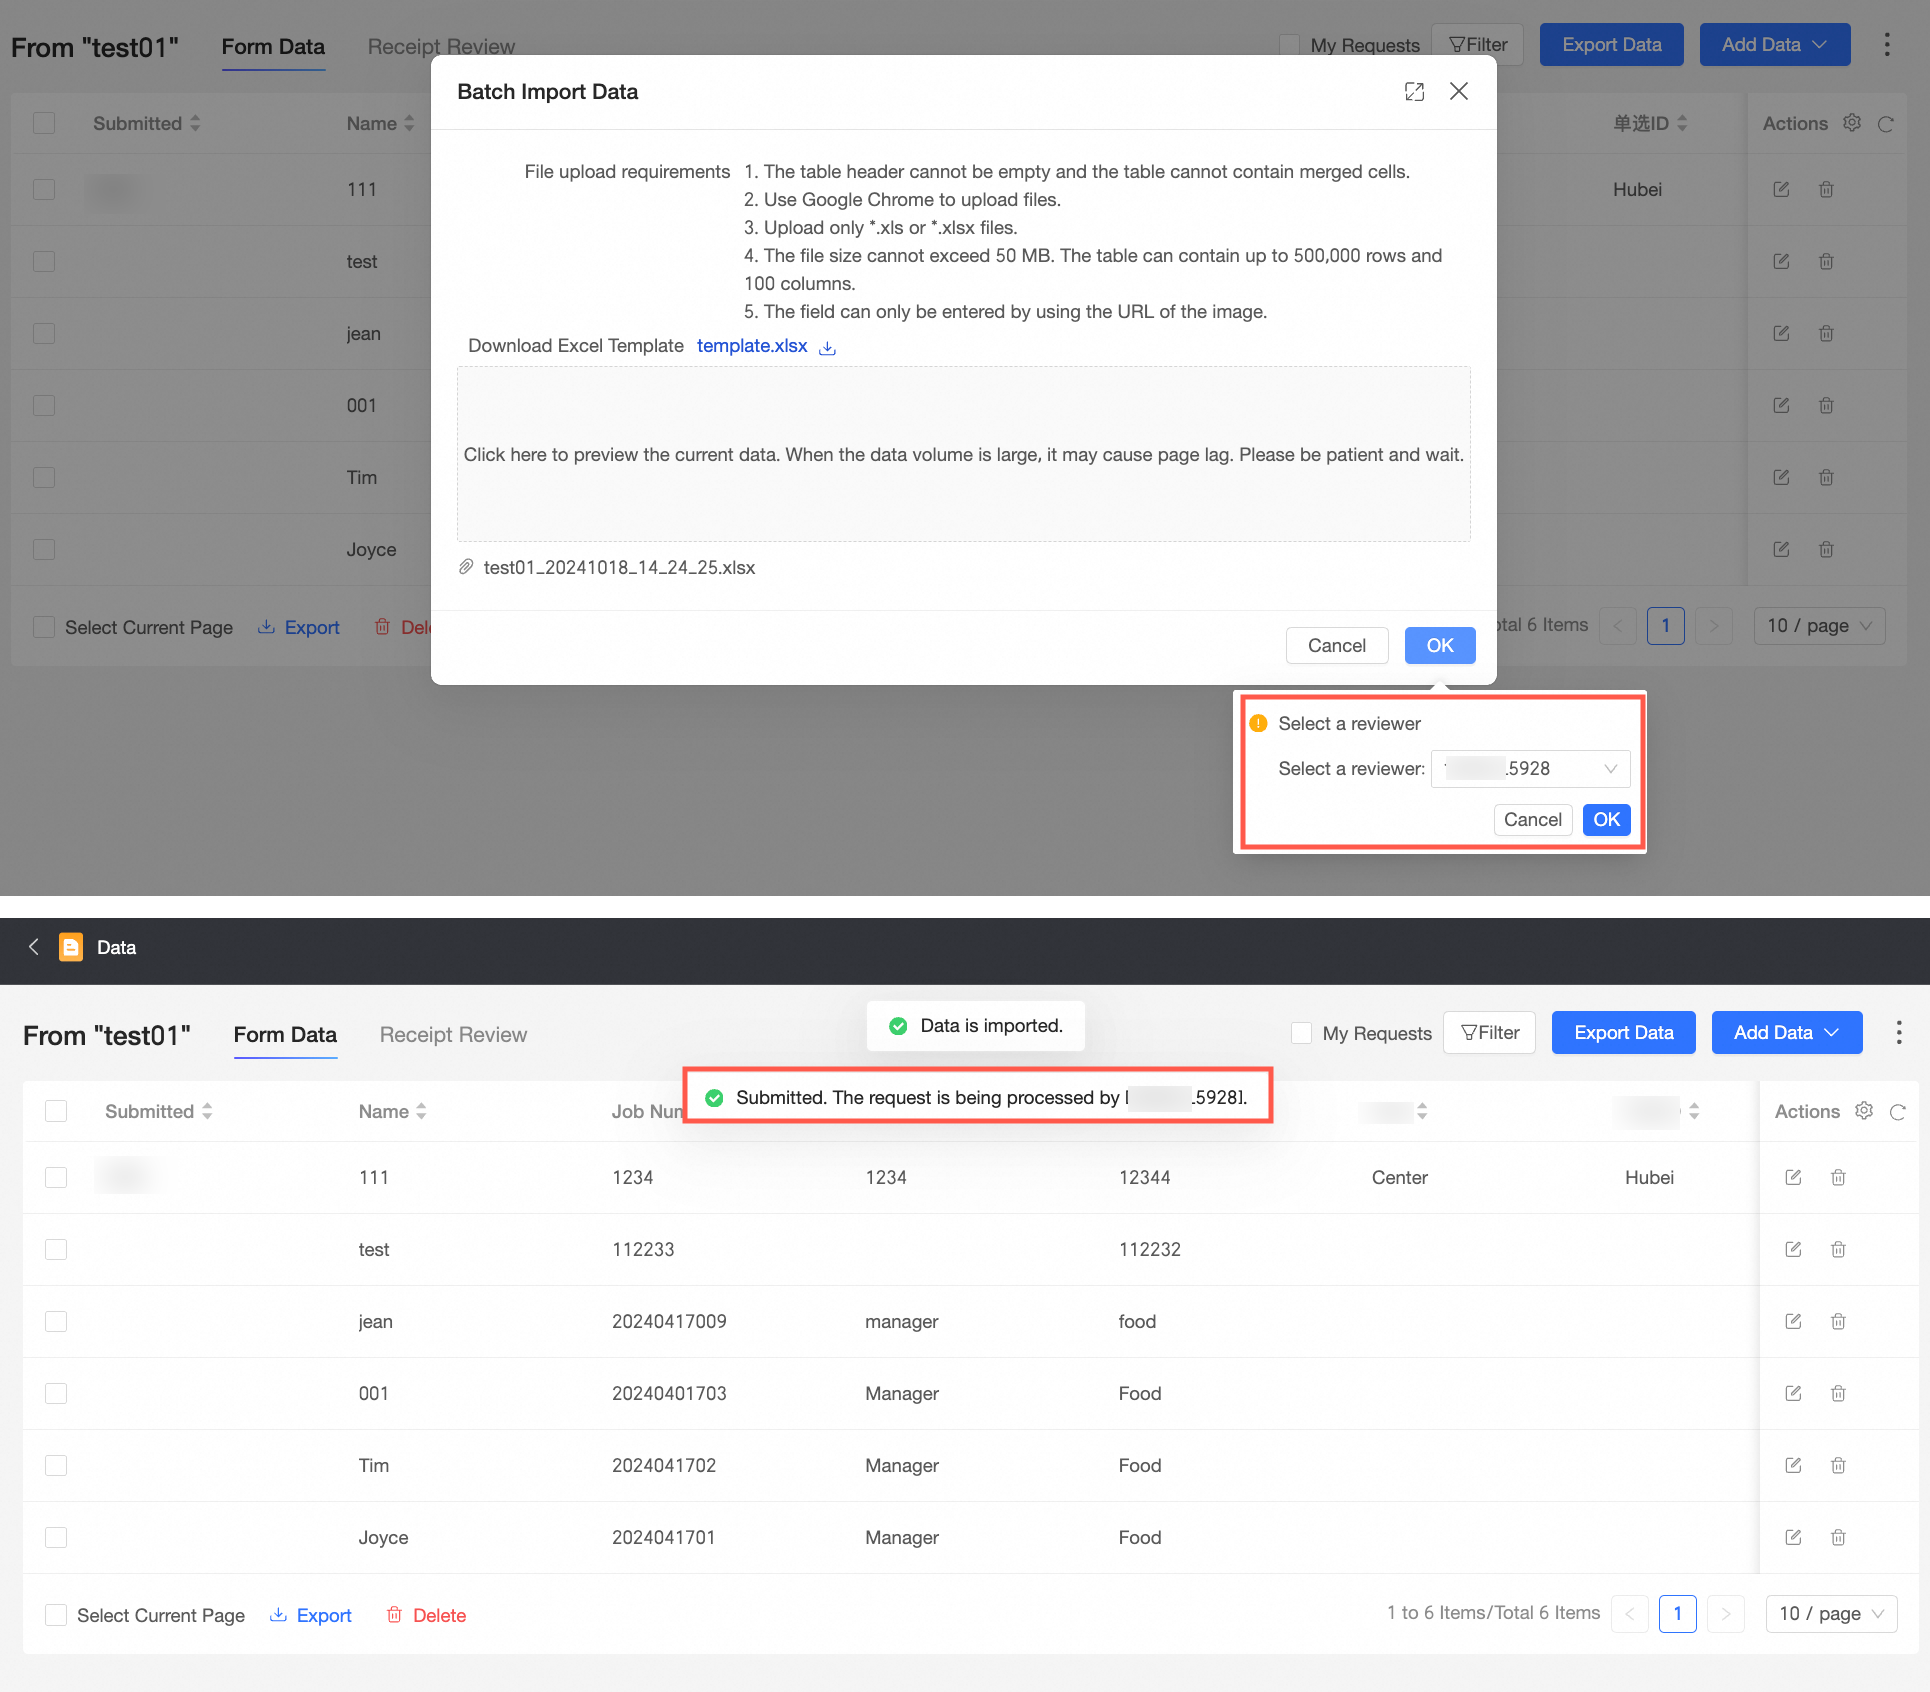
Batch approval for uploading files is supported.
After completing the operations of adding and editing data on the Data Management page, you can view the operation log.

For more information, see manage data and audit log.
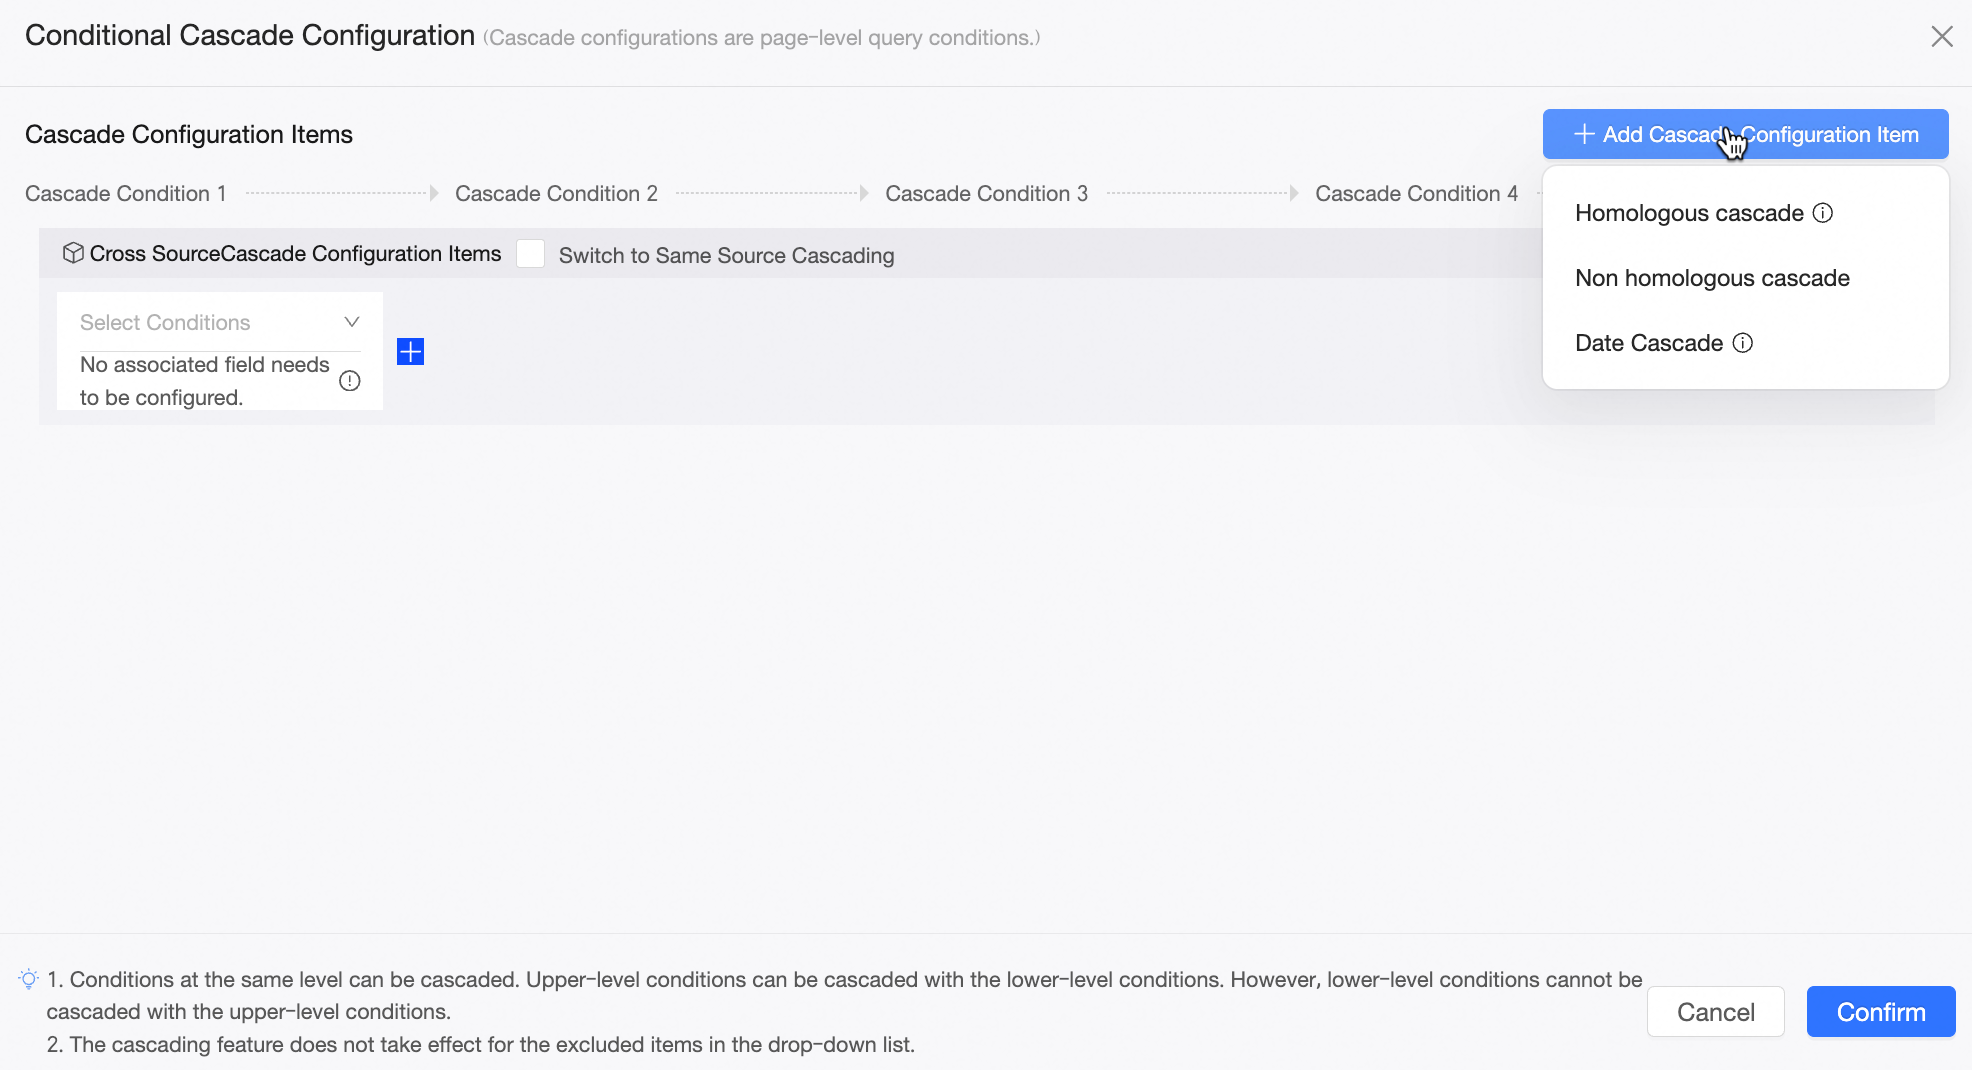
Some controls in data entry support conditional cascade, simplifying the information selection process during entry.
For more information, see configure conditional cascade (workbook entry).
Data entry now supports the StarRocks data source.
For more information, see data entry overview.
After uploading images in data entry, you can switch the image type in the dataset and eventually view the uploaded images in the report.
For more information, see create and manage datasets.
Workbook completion
The workbook reporting feature has added a new guide function to efficiently guide beginners through the entire process of creating and configuring workbook reporting.
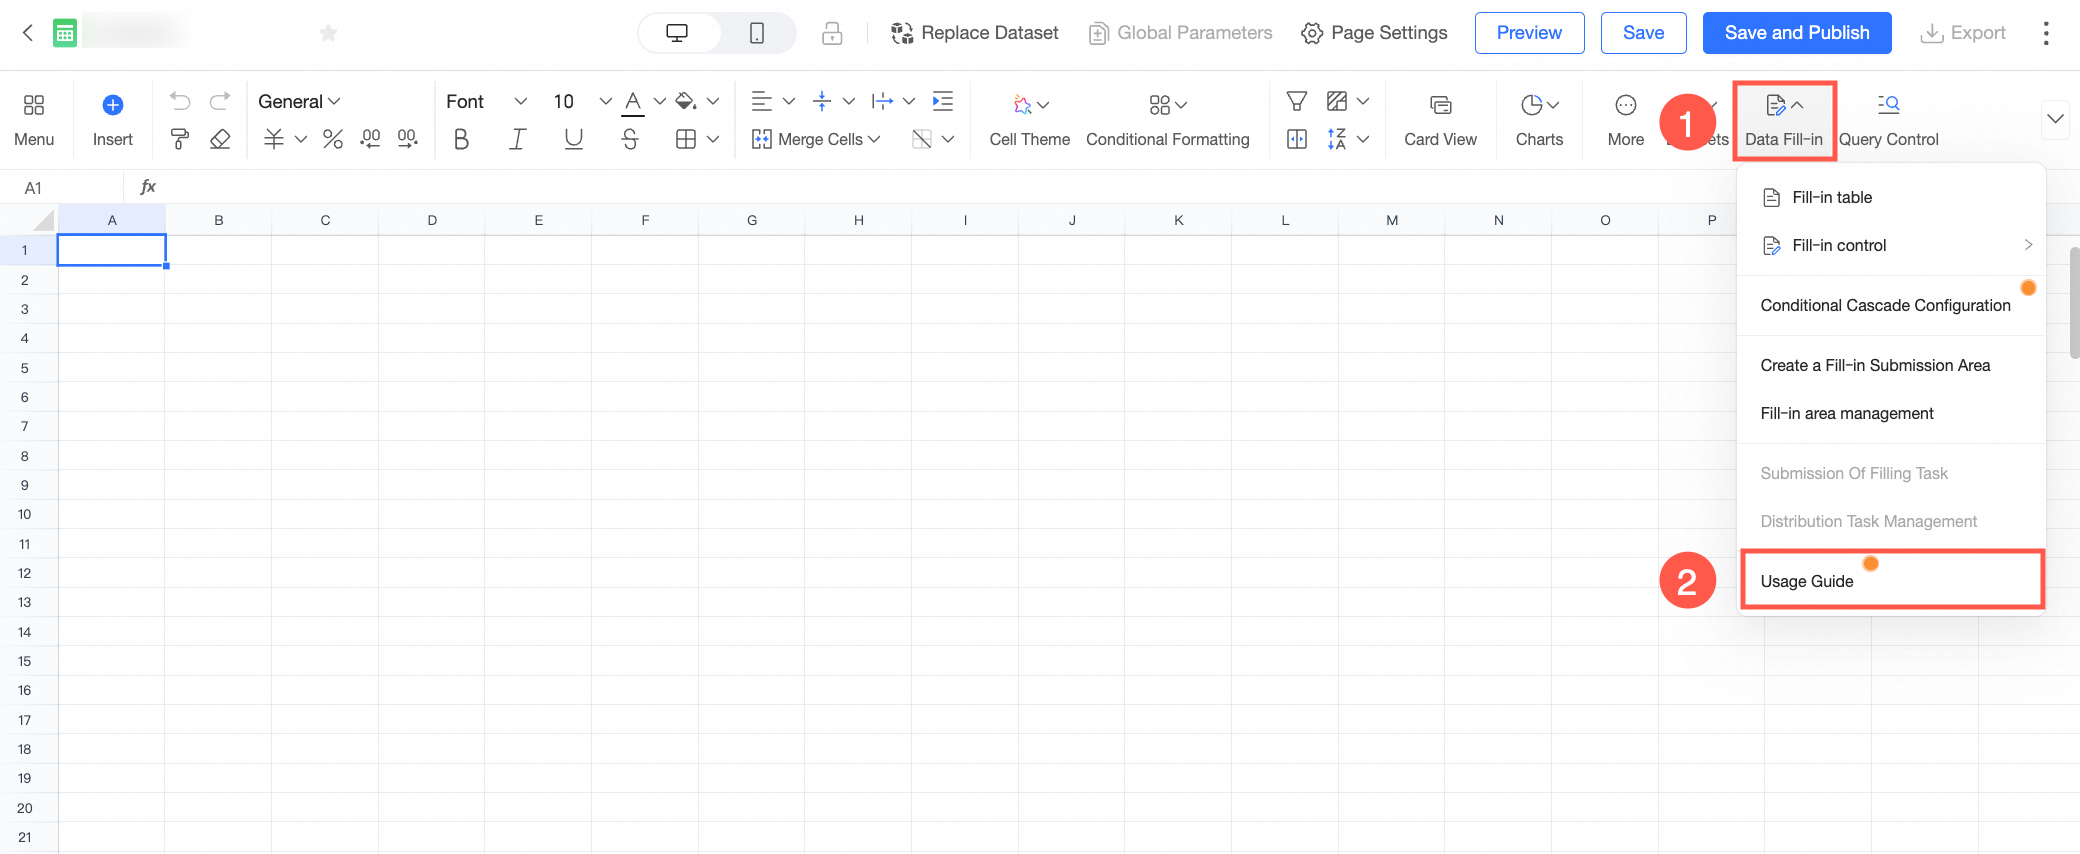
For more information, see the overview.
Some controls in form reporting support conditional cascade, simplifying the information selection process during reporting.
For more information, see configure conditional cascade (form reporting).
The workbook reporting feature now supports StarRocks data source.
For more information, see the overview of complex workbook reporting.
After uploading images in workbook reporting, you can switch the image type in the dataset and finally view the uploaded images in the report.
For more information, see create and manage datasets.
The template market has launched multiple workbook reporting templates to help users with offline data collection-storage-analysis needs quickly understand how to perform data reporting through complex workbooks.
ImportantDue to the impact of the Alibaba Cloud site upgrade, the template market currently only supports sites in Malaysia (Kuala Lumpur) and Indonesia.
Dataset
New built-in system functions have been added. When creating a calculated field, you can directly use the built-in system functions provided by Quick BI for data processing, which shields the function differences of the underlying database.
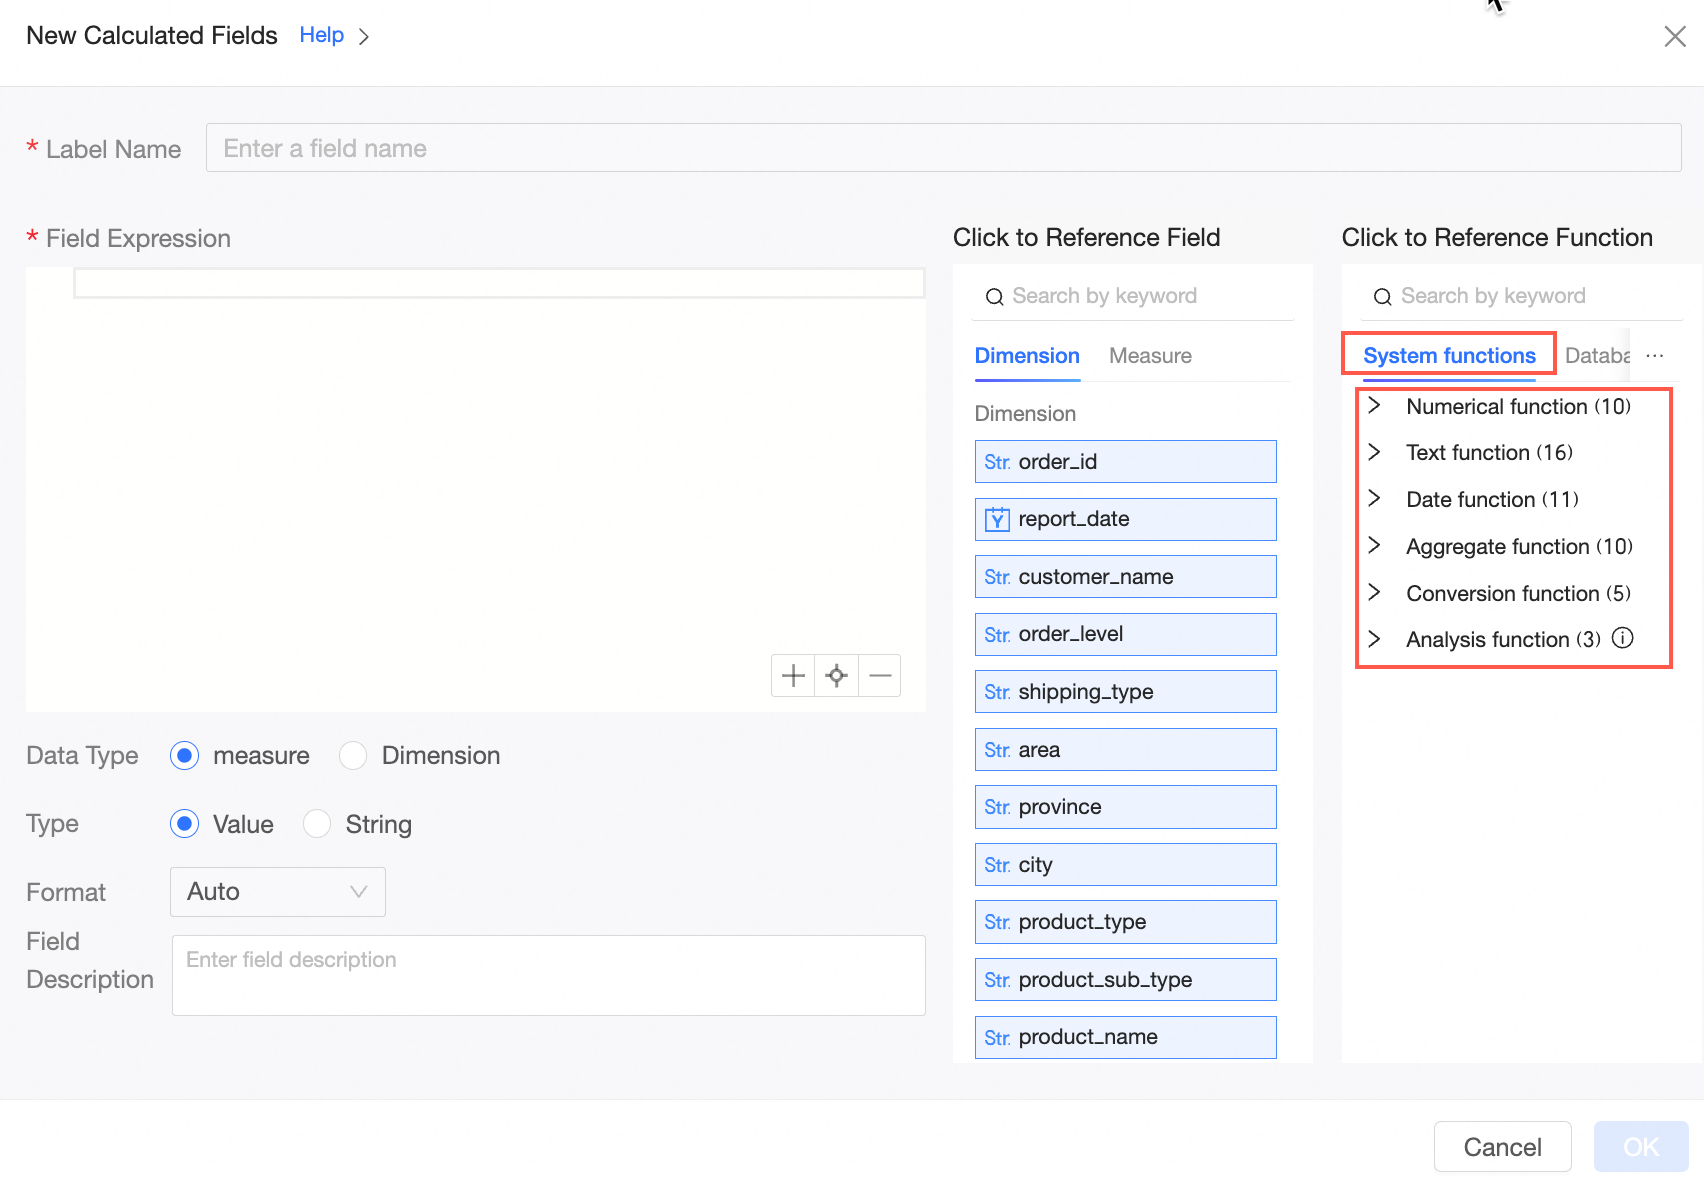
For more information, see system built-in functions.
Support for custom configuration of business fiscal year within datasets is provided. The data display, date filtering, and year-over-year or month-over-month calculations in upper-level reports all take effect according to the fiscal year.
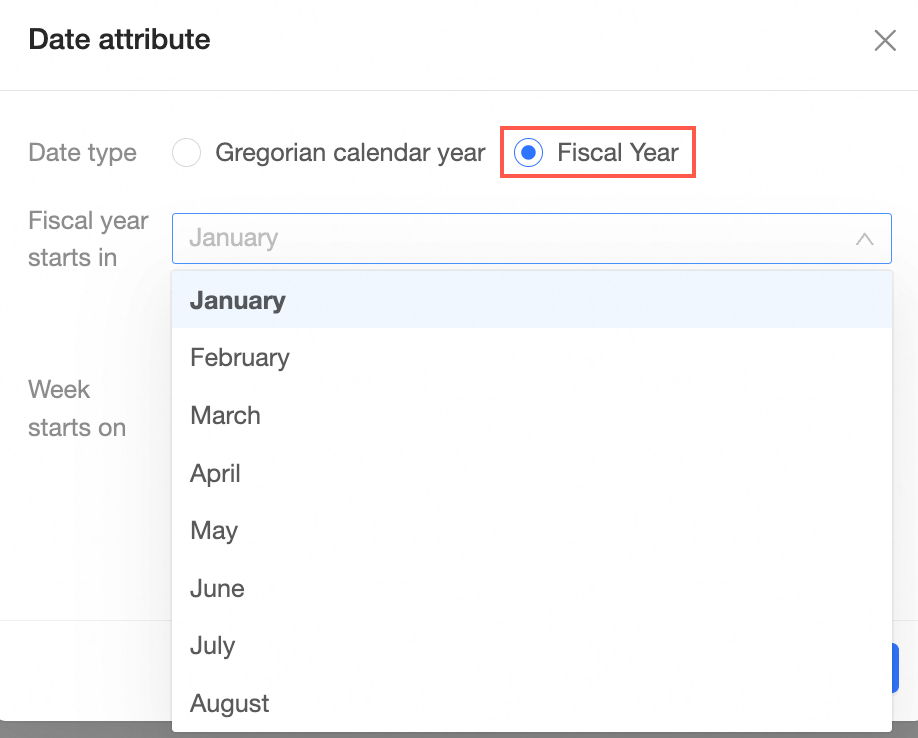
For more information, see create and manage datasets.
A new capability for customizing empty value display styles has been added. You can set appropriate empty value display styles based on business attributes. The styles that can be set include the following: "-", "{empty}", "null", and custom. Once set, they will take effect uniformly in datasets, upper-level report displays, and data exporting.

For more information, see create and manage datasets.
The data sources supported by HINT statements have been increased. New data sources such as MySQL (5.7, 8.0), AnalyticDB for MySQL 2.0, AnalyticDB for MySQL 3.0, and PolarDB for MySQL have opened HINT statement entry.
For more information, see create and manage datasets.
Data source expansion now includes custom week support for the following platforms: Alibaba AnalyticDB for PostgreSQL, StarRocks, Alibaba AnalyticDB for MySQL 3.0, Alibaba Hologres, and Impala.
For more information, see data source function item list.
Dashboard
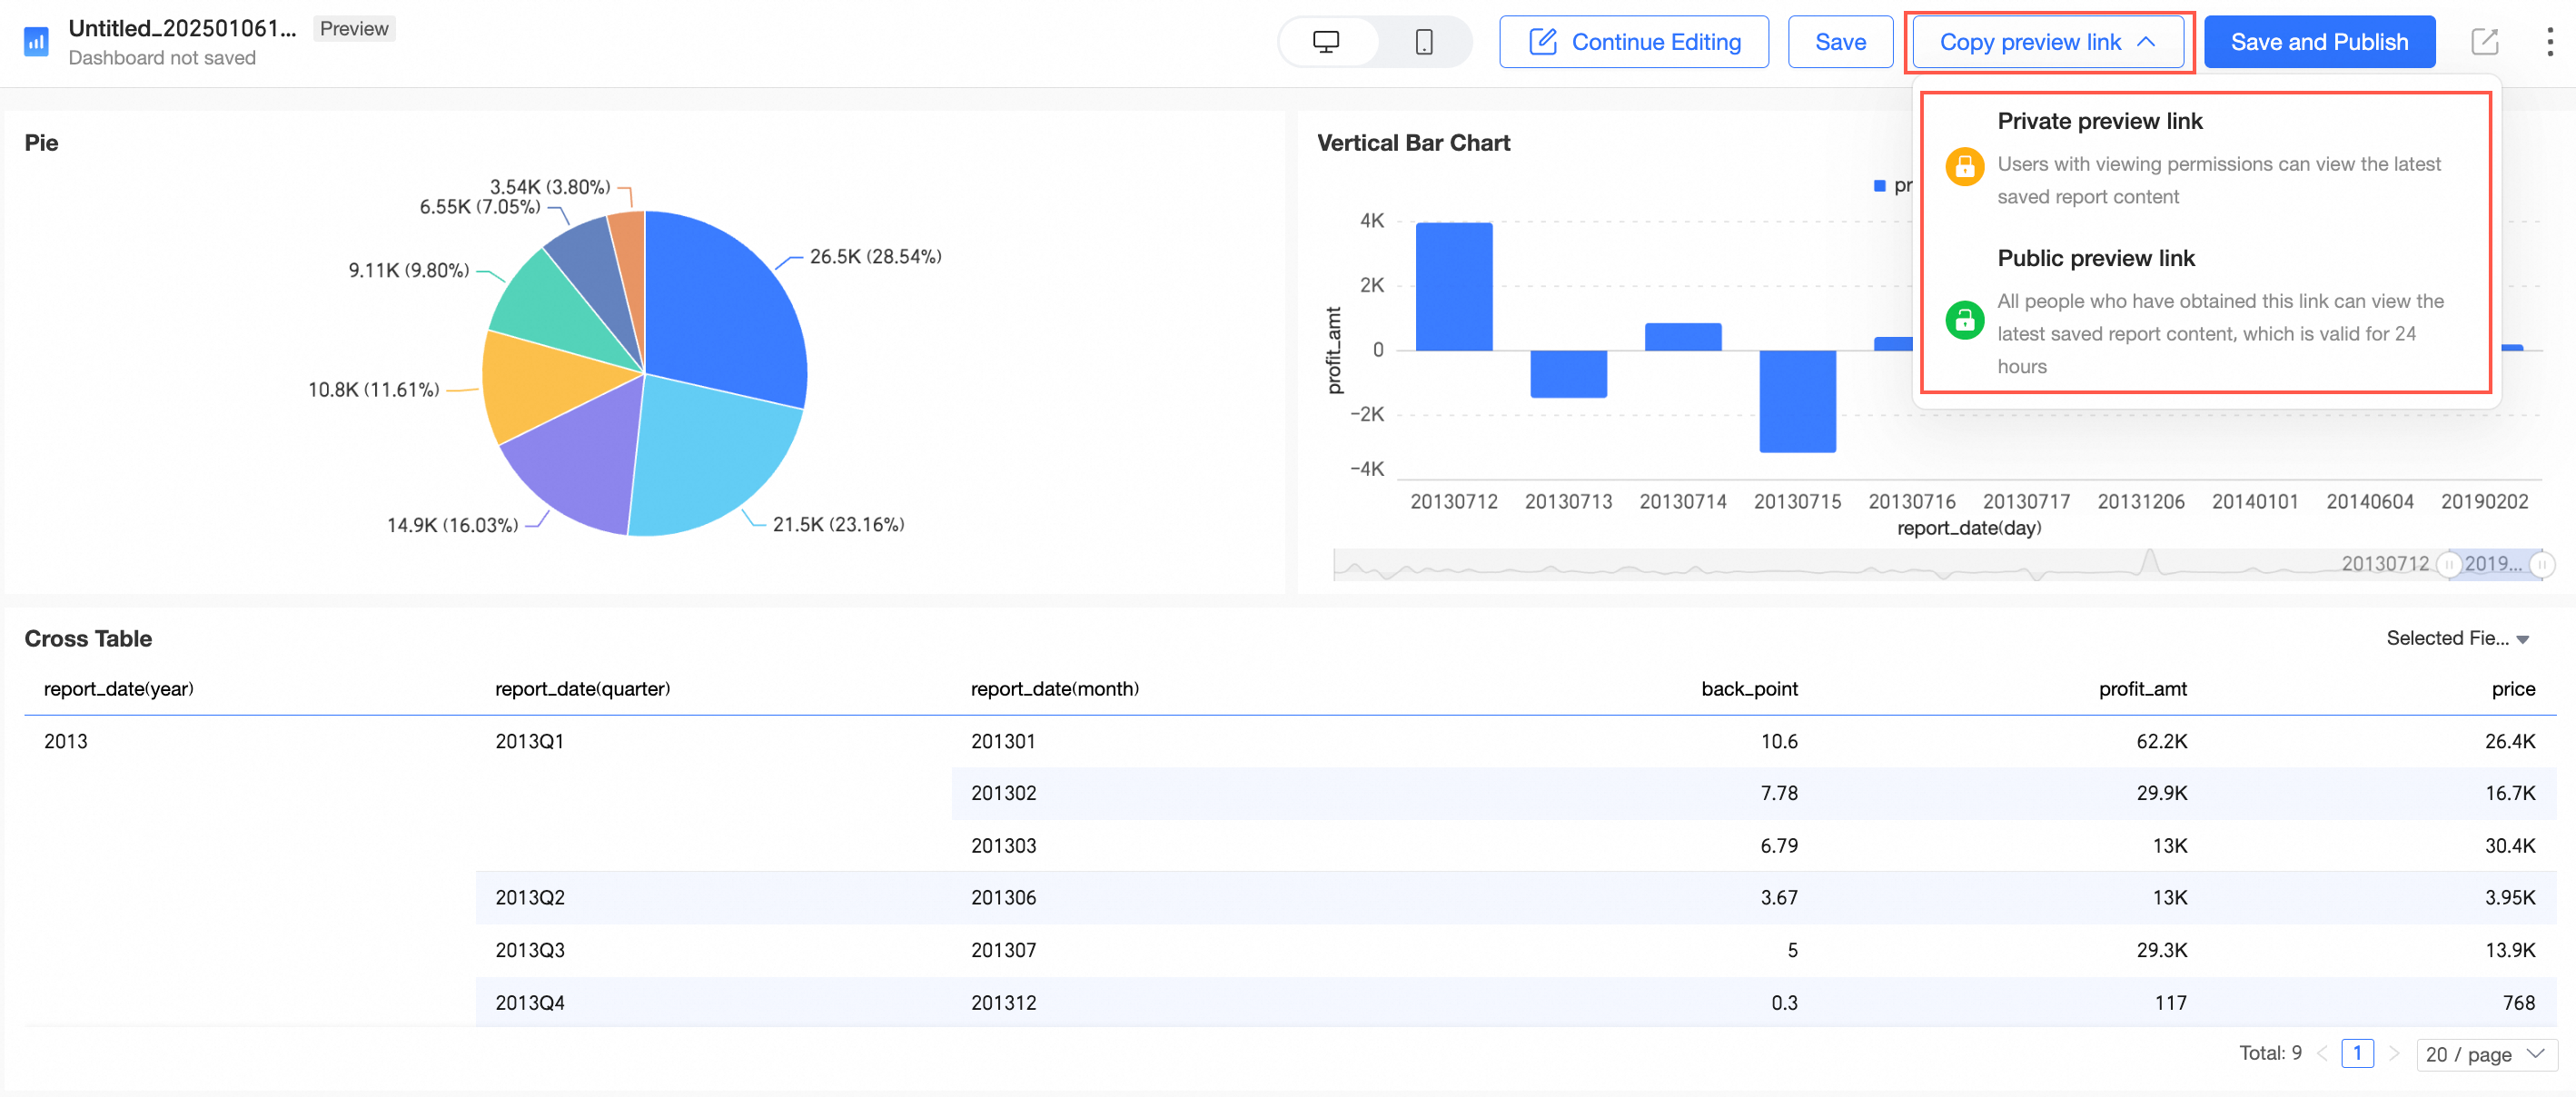
The dashboard supports copying private preview links, which can be used in scenarios where saved but unpublished content needs to be verified by others in advance.
Tab configuration item optimization. Some styles now support gradient color configuration.
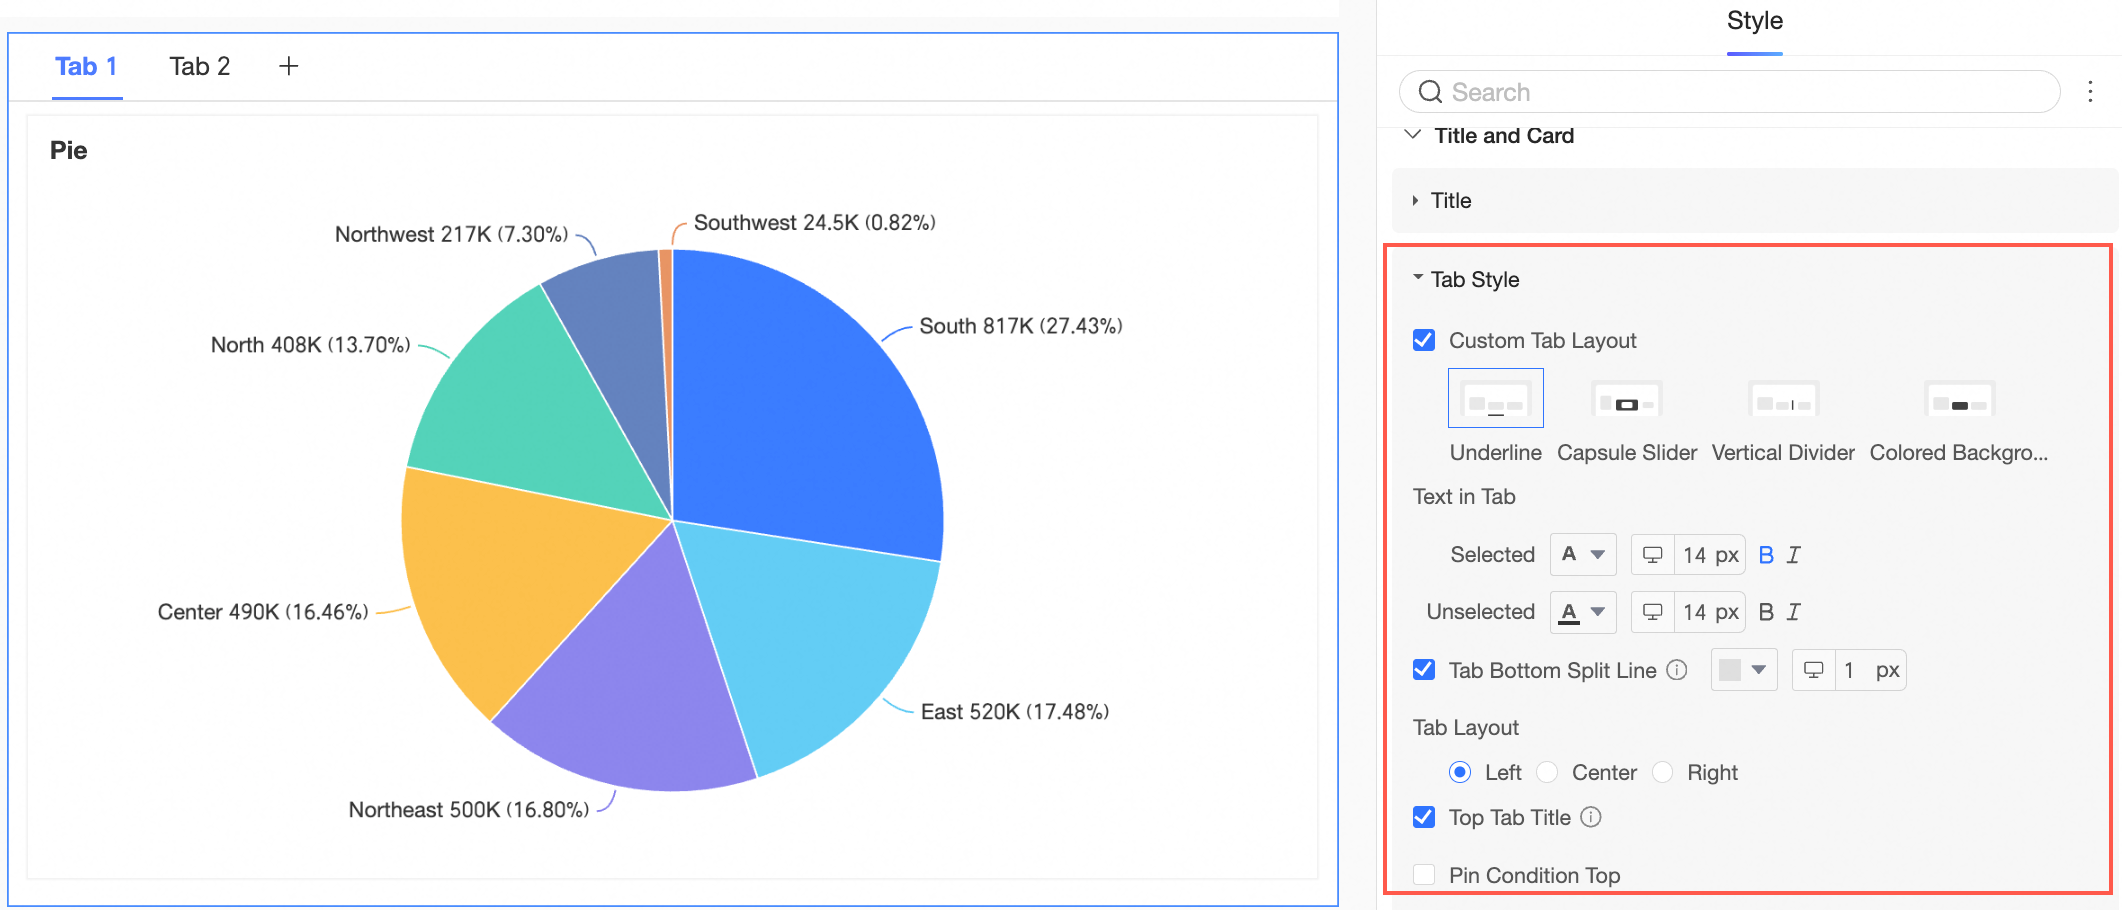
For more information, see Tab.
Supports using the format painter across tabs and batch settings.
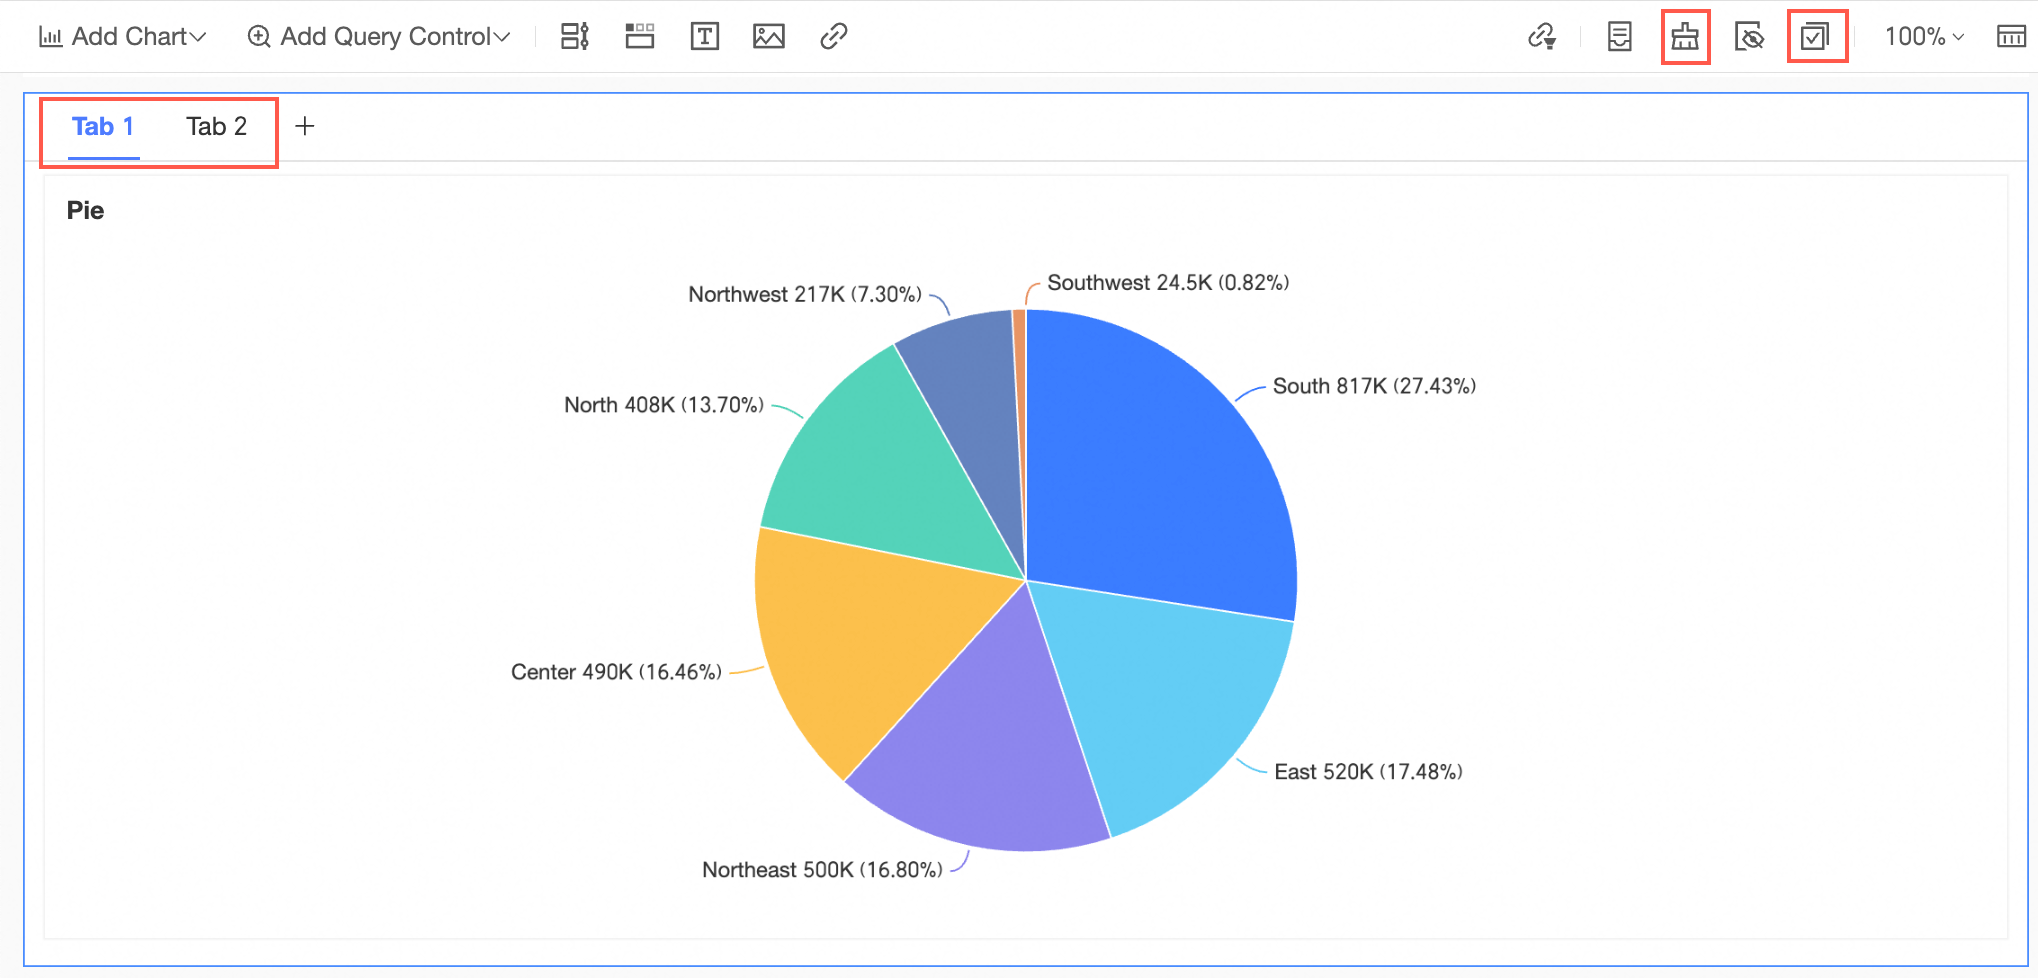
Supports copying tabs across dashboards.
After adding a subquery to the rich text control, you can set the number of results to display.
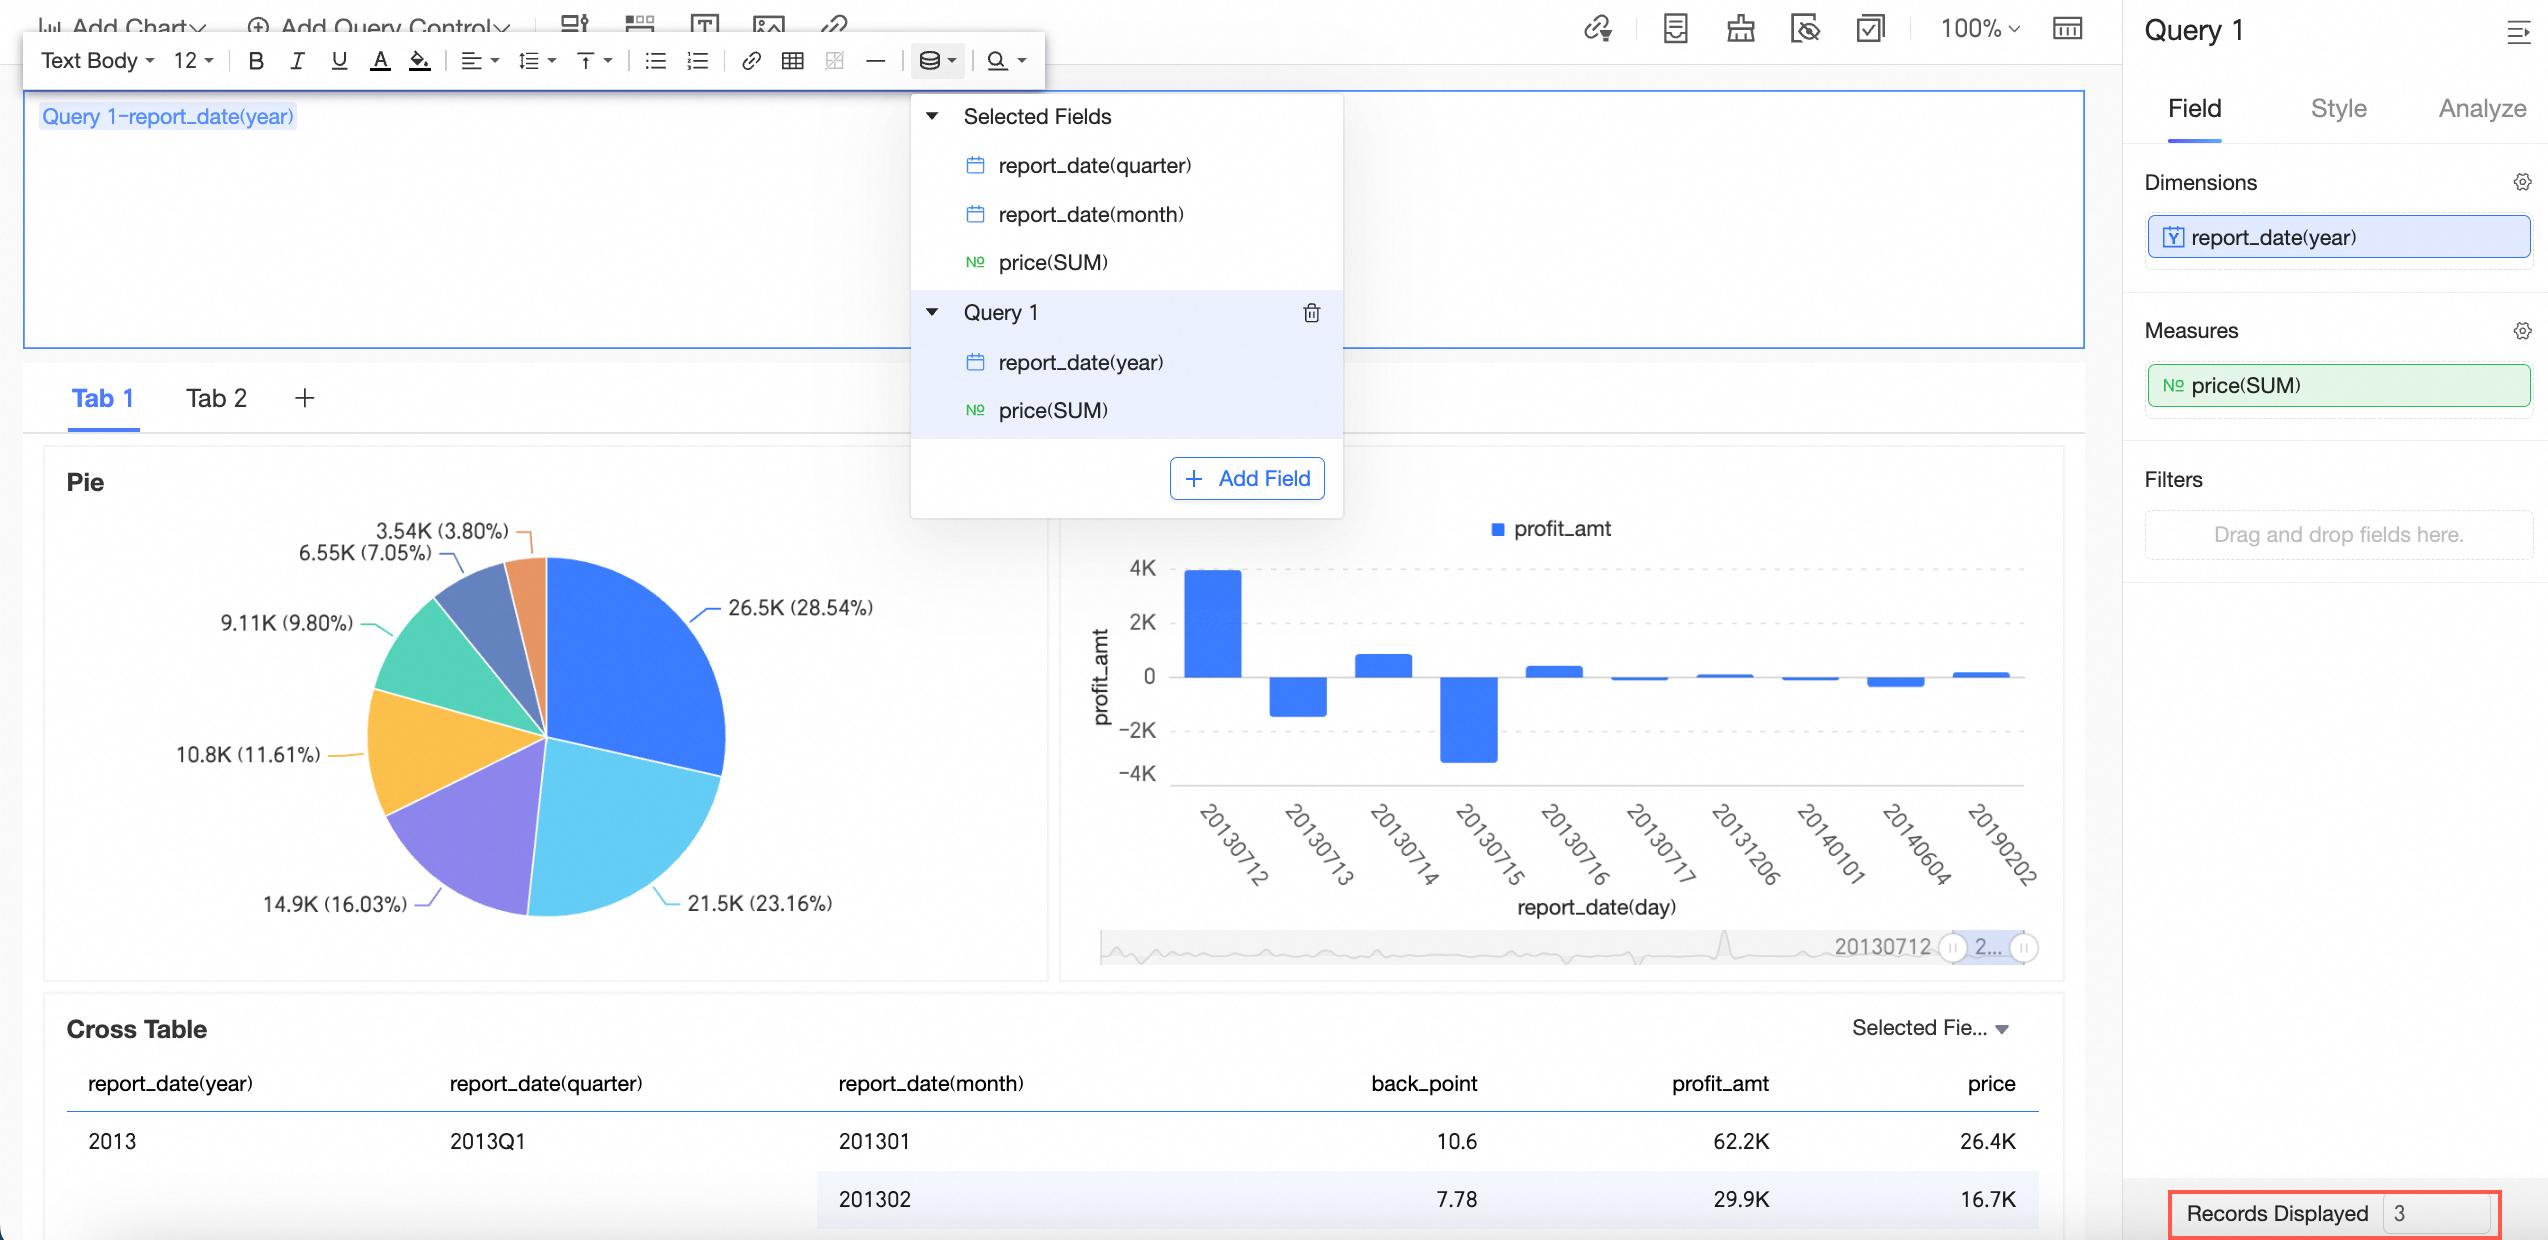
For more information, see Rich Text.
The report export pop-up interface has been optimized.
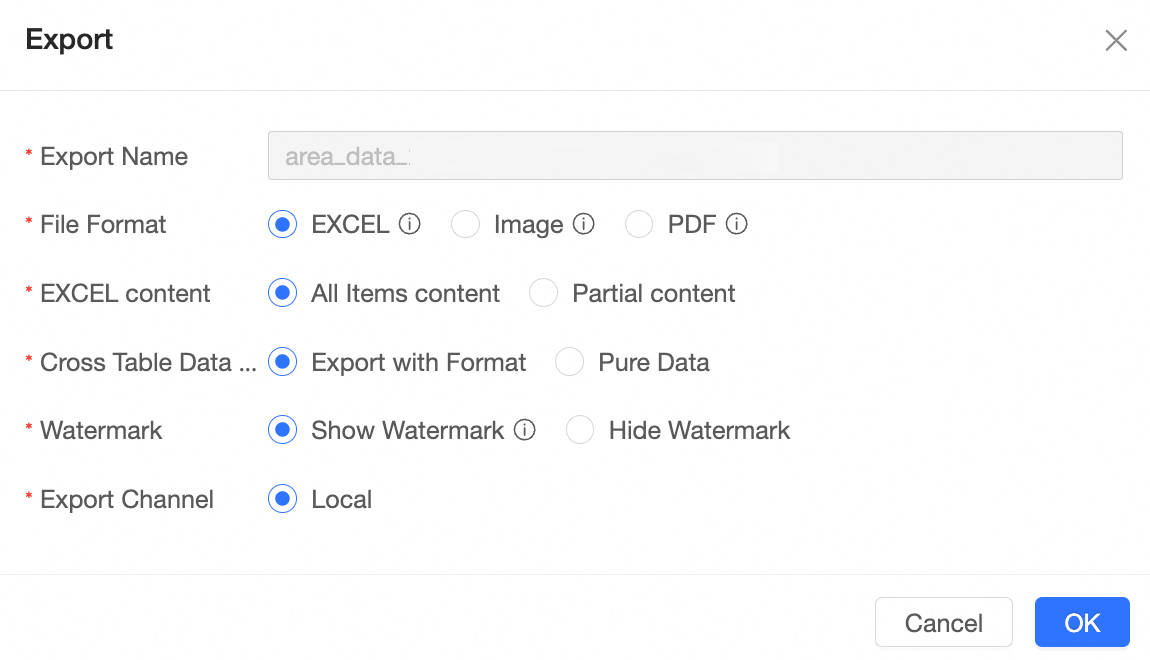
For more information, see Create a Bashboard.
After enabling the auto-save feature for the dashboard, it will automatically save every 5 minutes. For historical versions, the system can retain up to the 5 most recent published versions and 15 saved versions within the last three months. Historical versions exceeding the limit will be deleted sequentially online.
For more information, see Restore Historical Version.
The overall style of the dashboard legend has been optimized.
The dashboard icons have been updated and optimized.
Visualization chart
New feature: Multi-dimensional analysis table for multi-period trend analysis under multi-dimensional breakdown.

For more information, see multi-dimensional analysis table.
New feature: Box plot for displaying the distribution of continuous data, intuitively expressing data bias, outliers, and data distribution.
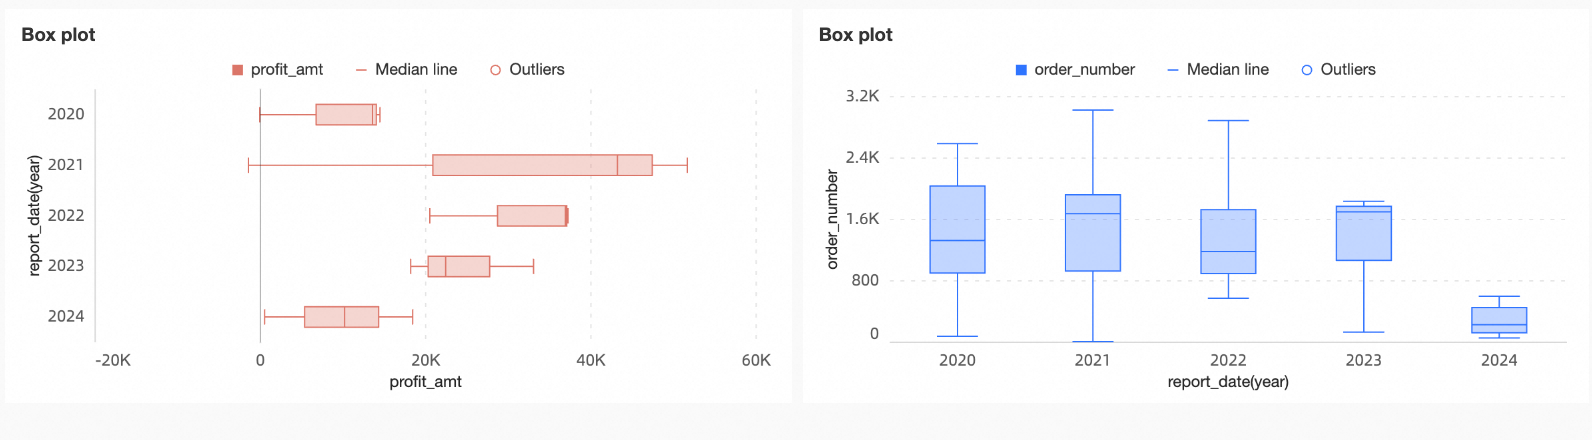
For more information, see box plot.
The area chart supports switching chart lines to a straight line form.
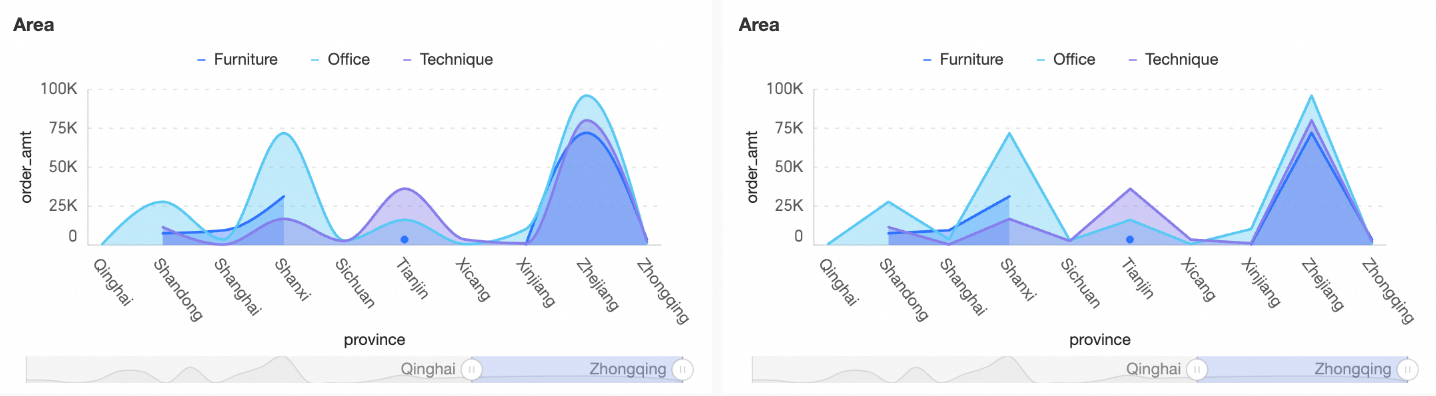
For more information, see area chart.
New feature: Bullet chart for displaying the comparison results of data with different targets or project progress stages.
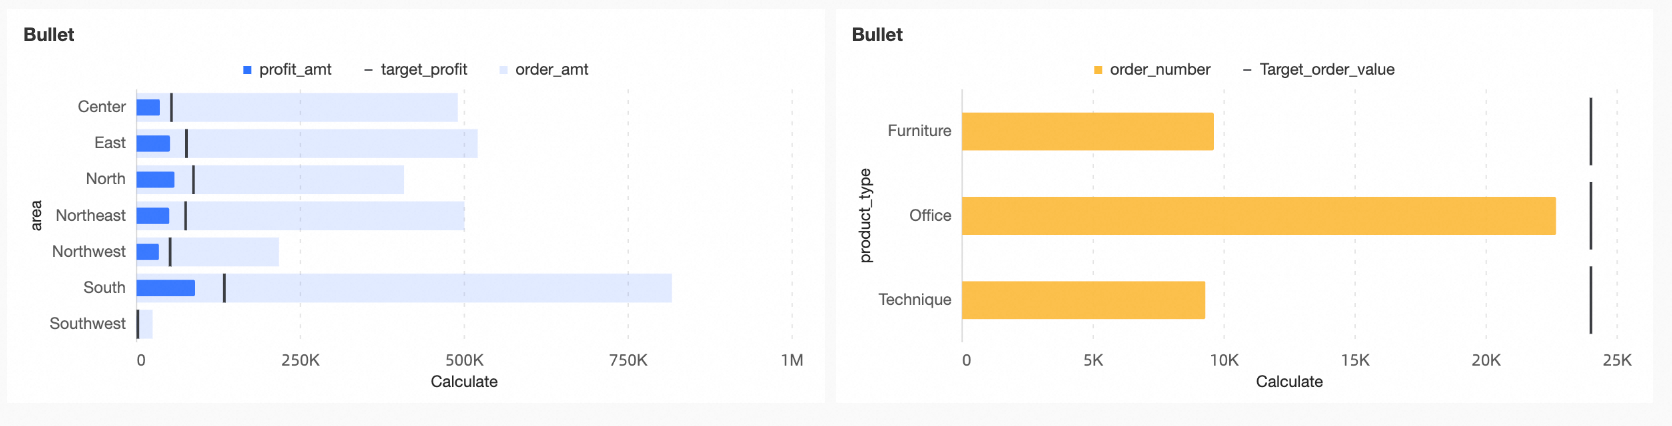
For more information, see bullet chart.
New feature: Histogram for displaying the frequency distribution of continuous data values, effectively revealing characteristics such as central tendency, dispersion, skewness, and kurtosis.
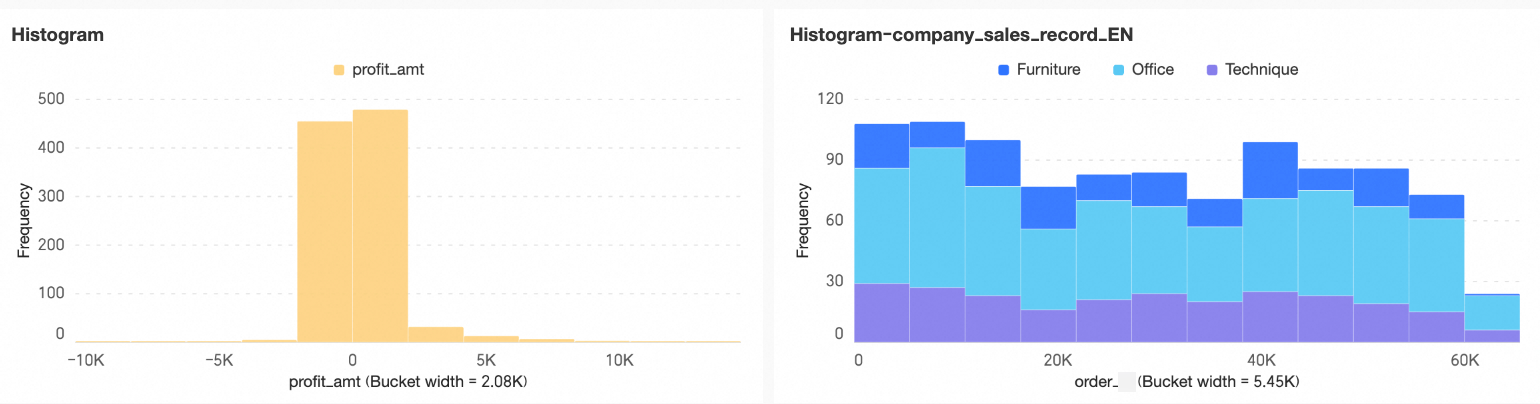
For more information, see histogram.
The indicator relationship graph supports configuration for period comparison.
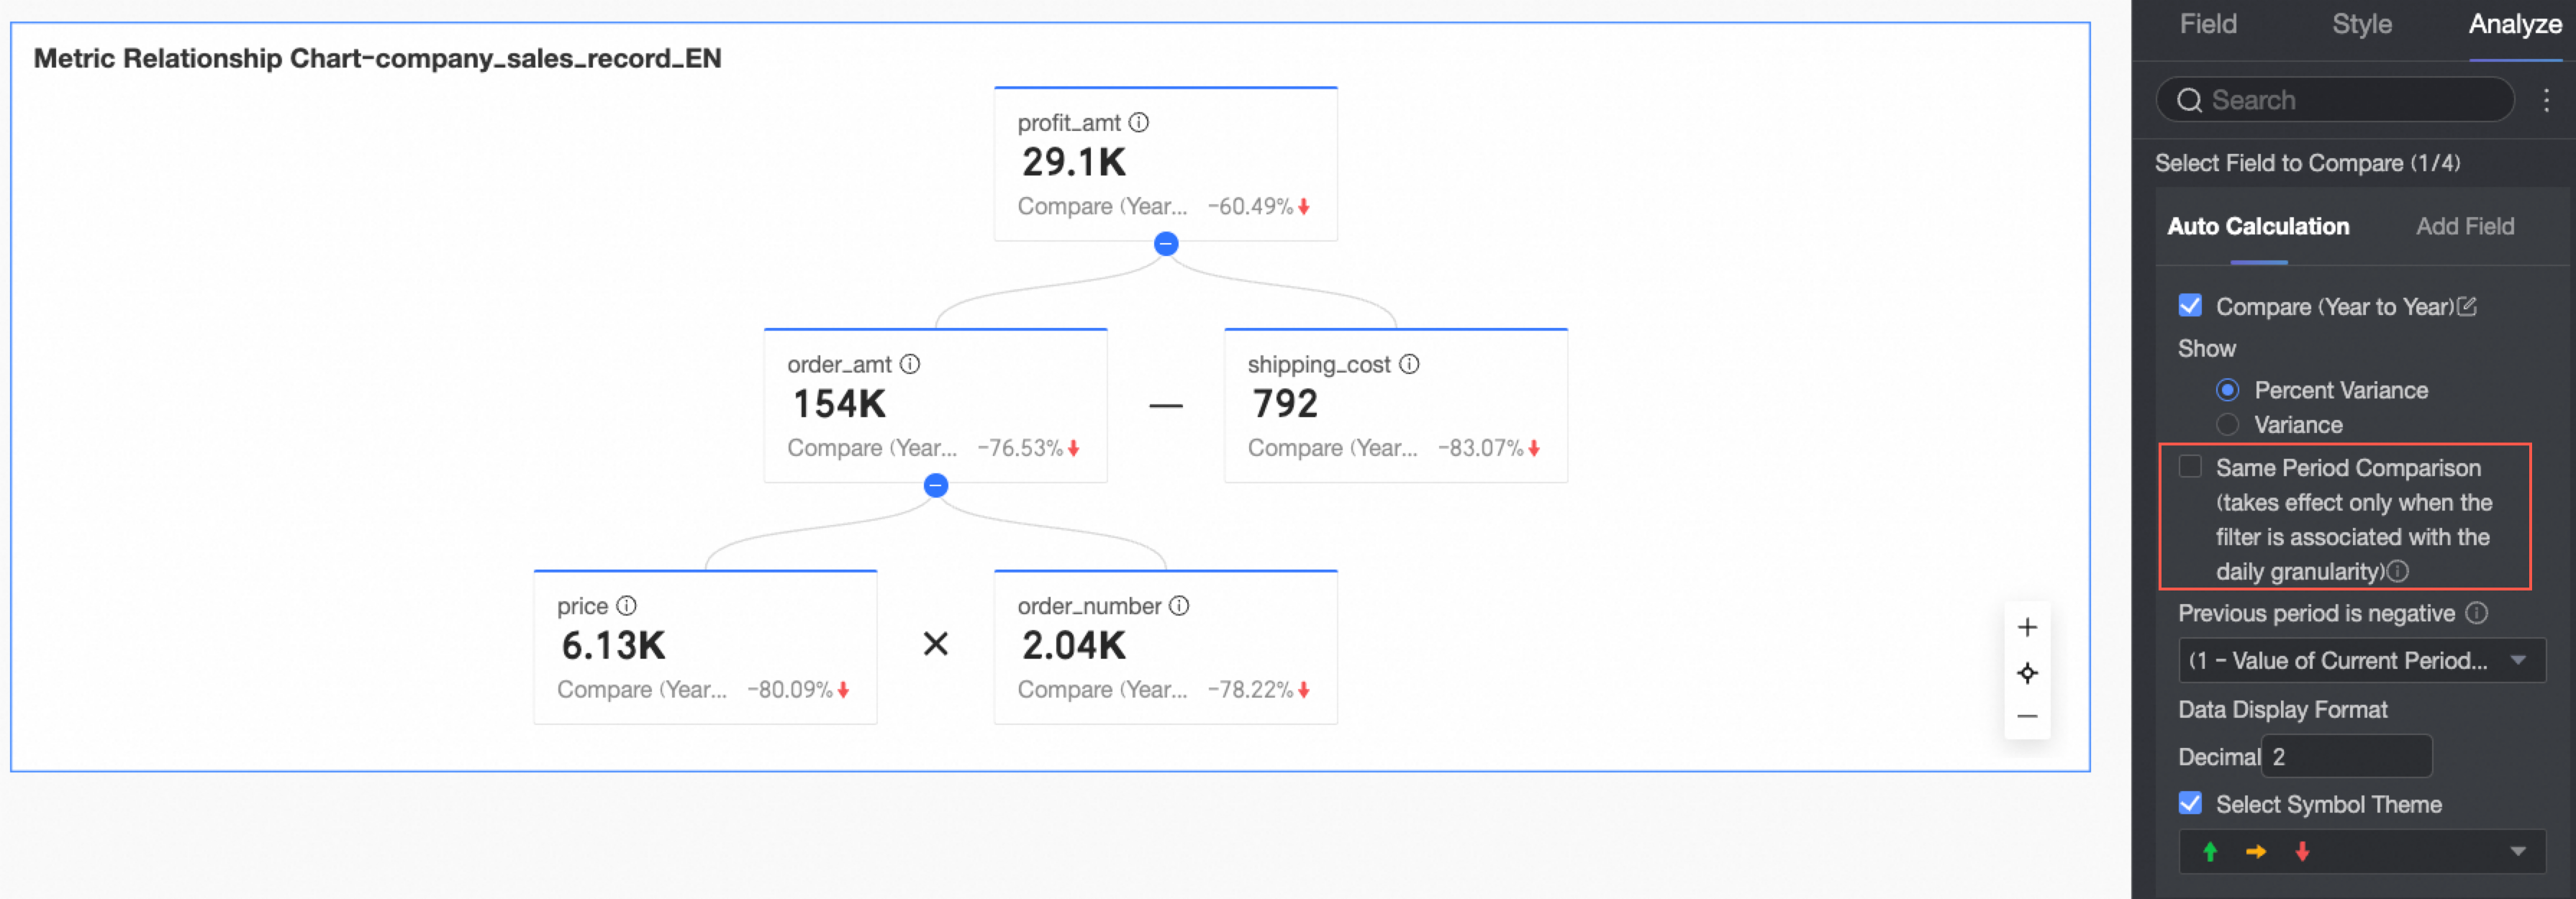
For more information, see indicator relationship graph.
The indicator decomposition tree supports configuration for conditional formatting.
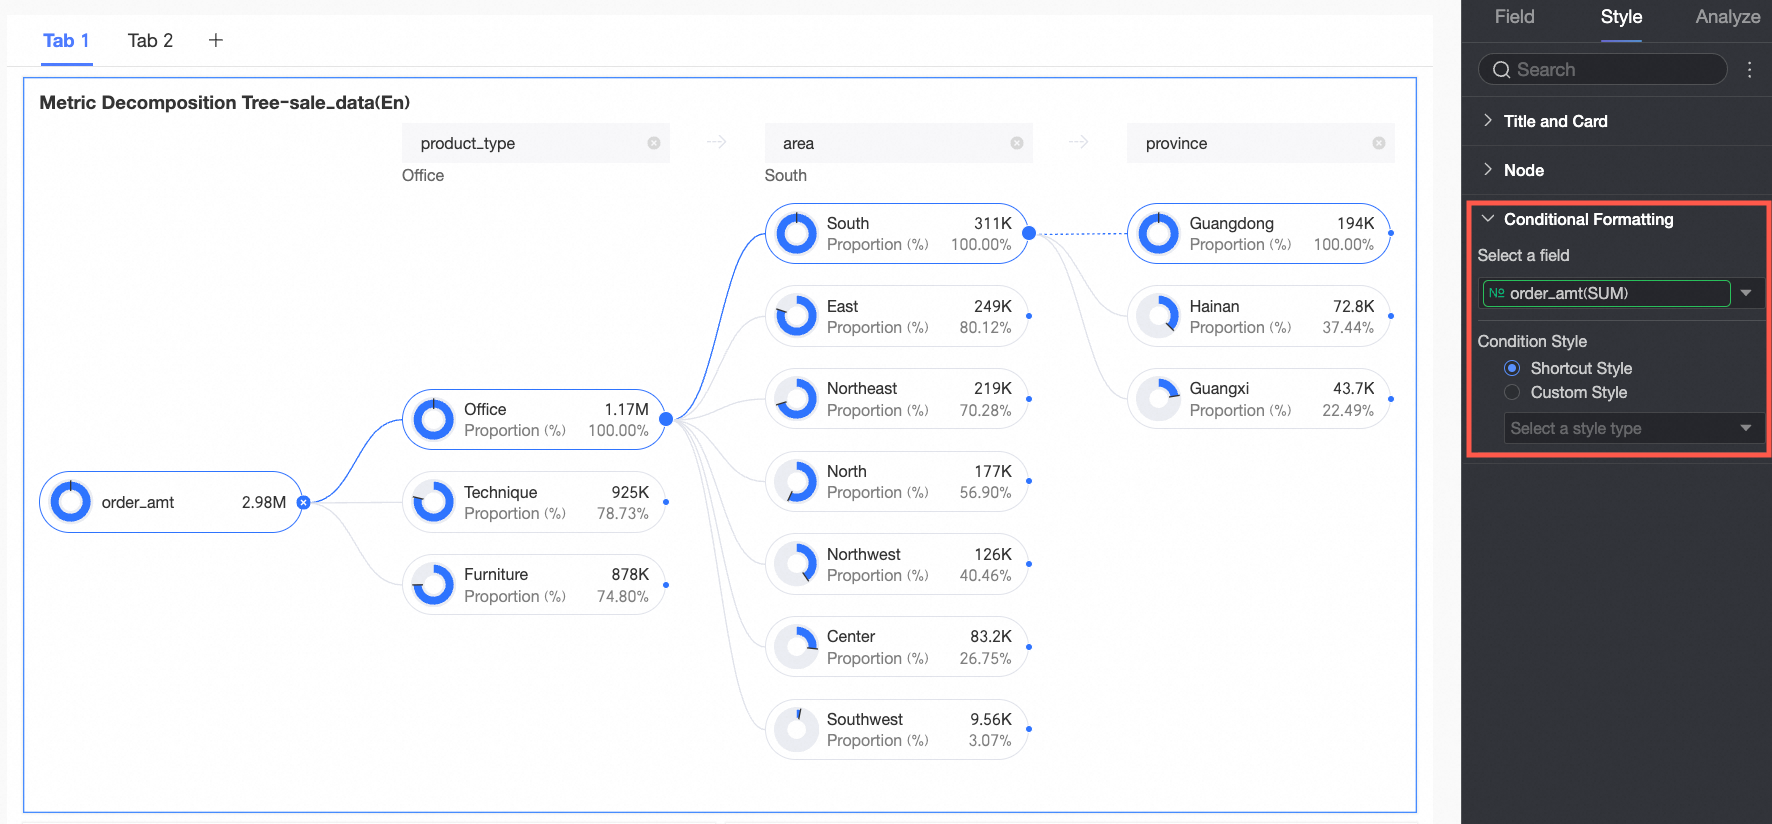
For more information, see indicator decomposition tree.
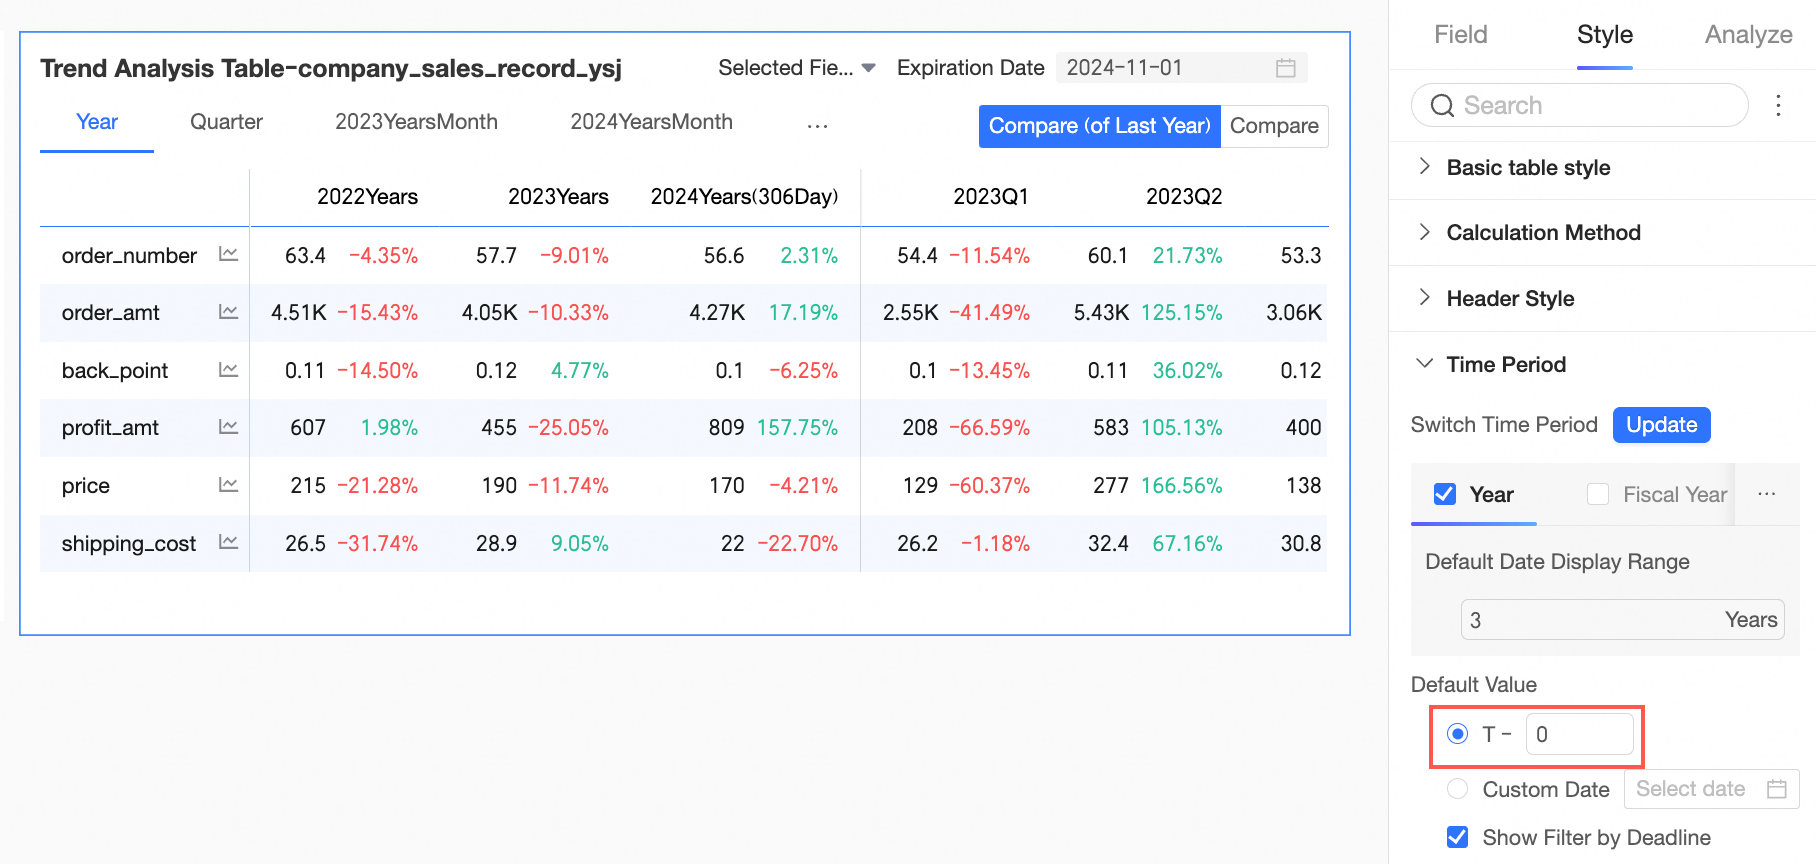
The multi-dimensional analysis table and trend analysis table support setting the default end date to T-0.
The heat map supports configuration for color and transparency.
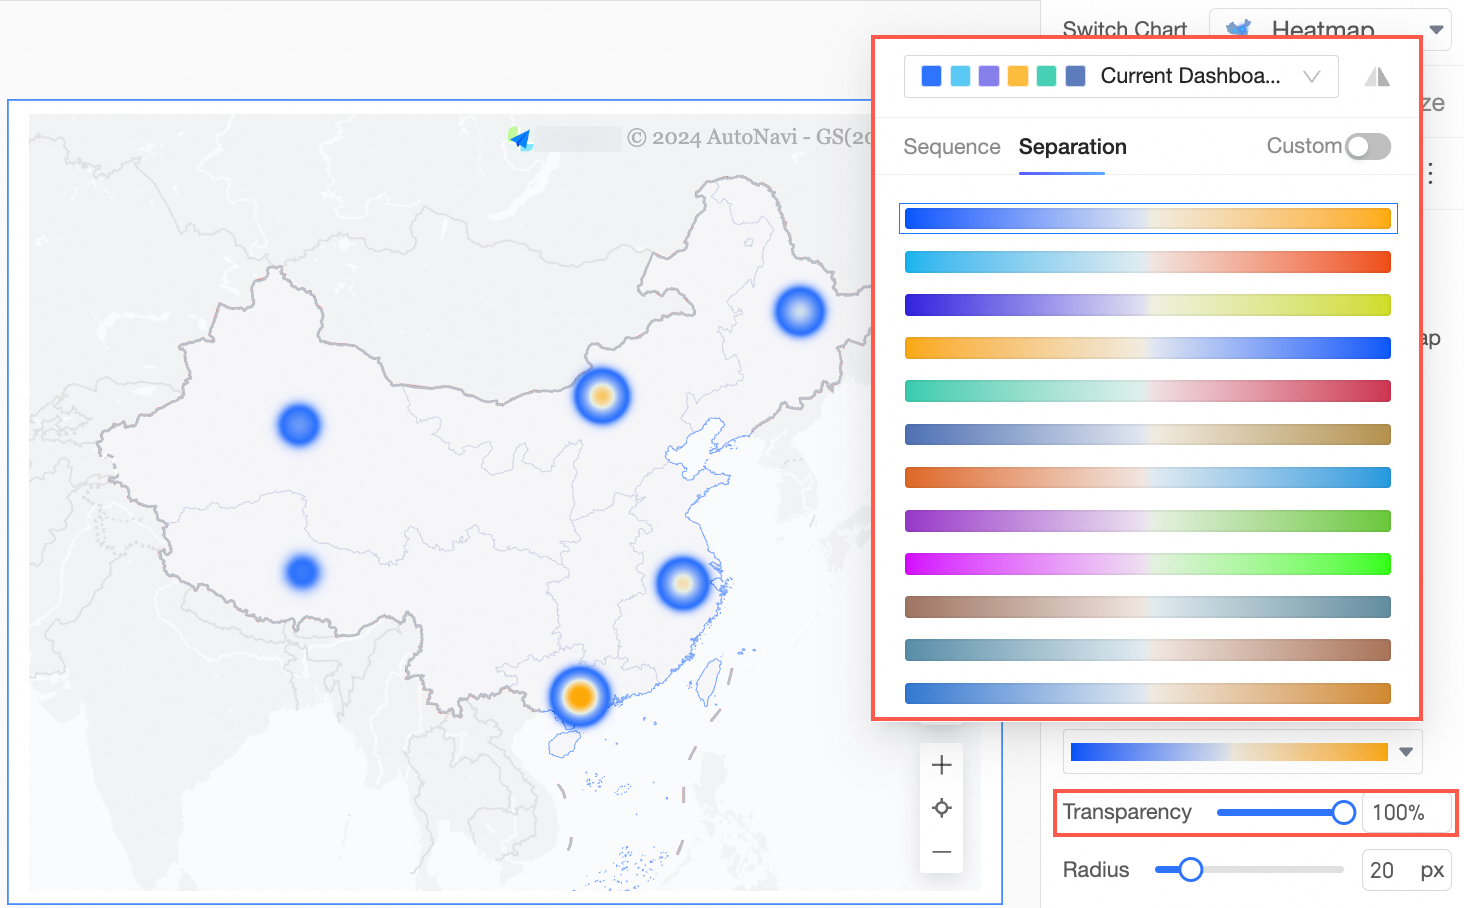
For more information, see heat map.
The multi-dimensional analysis table supports measure sorting and incremental data retrieval.
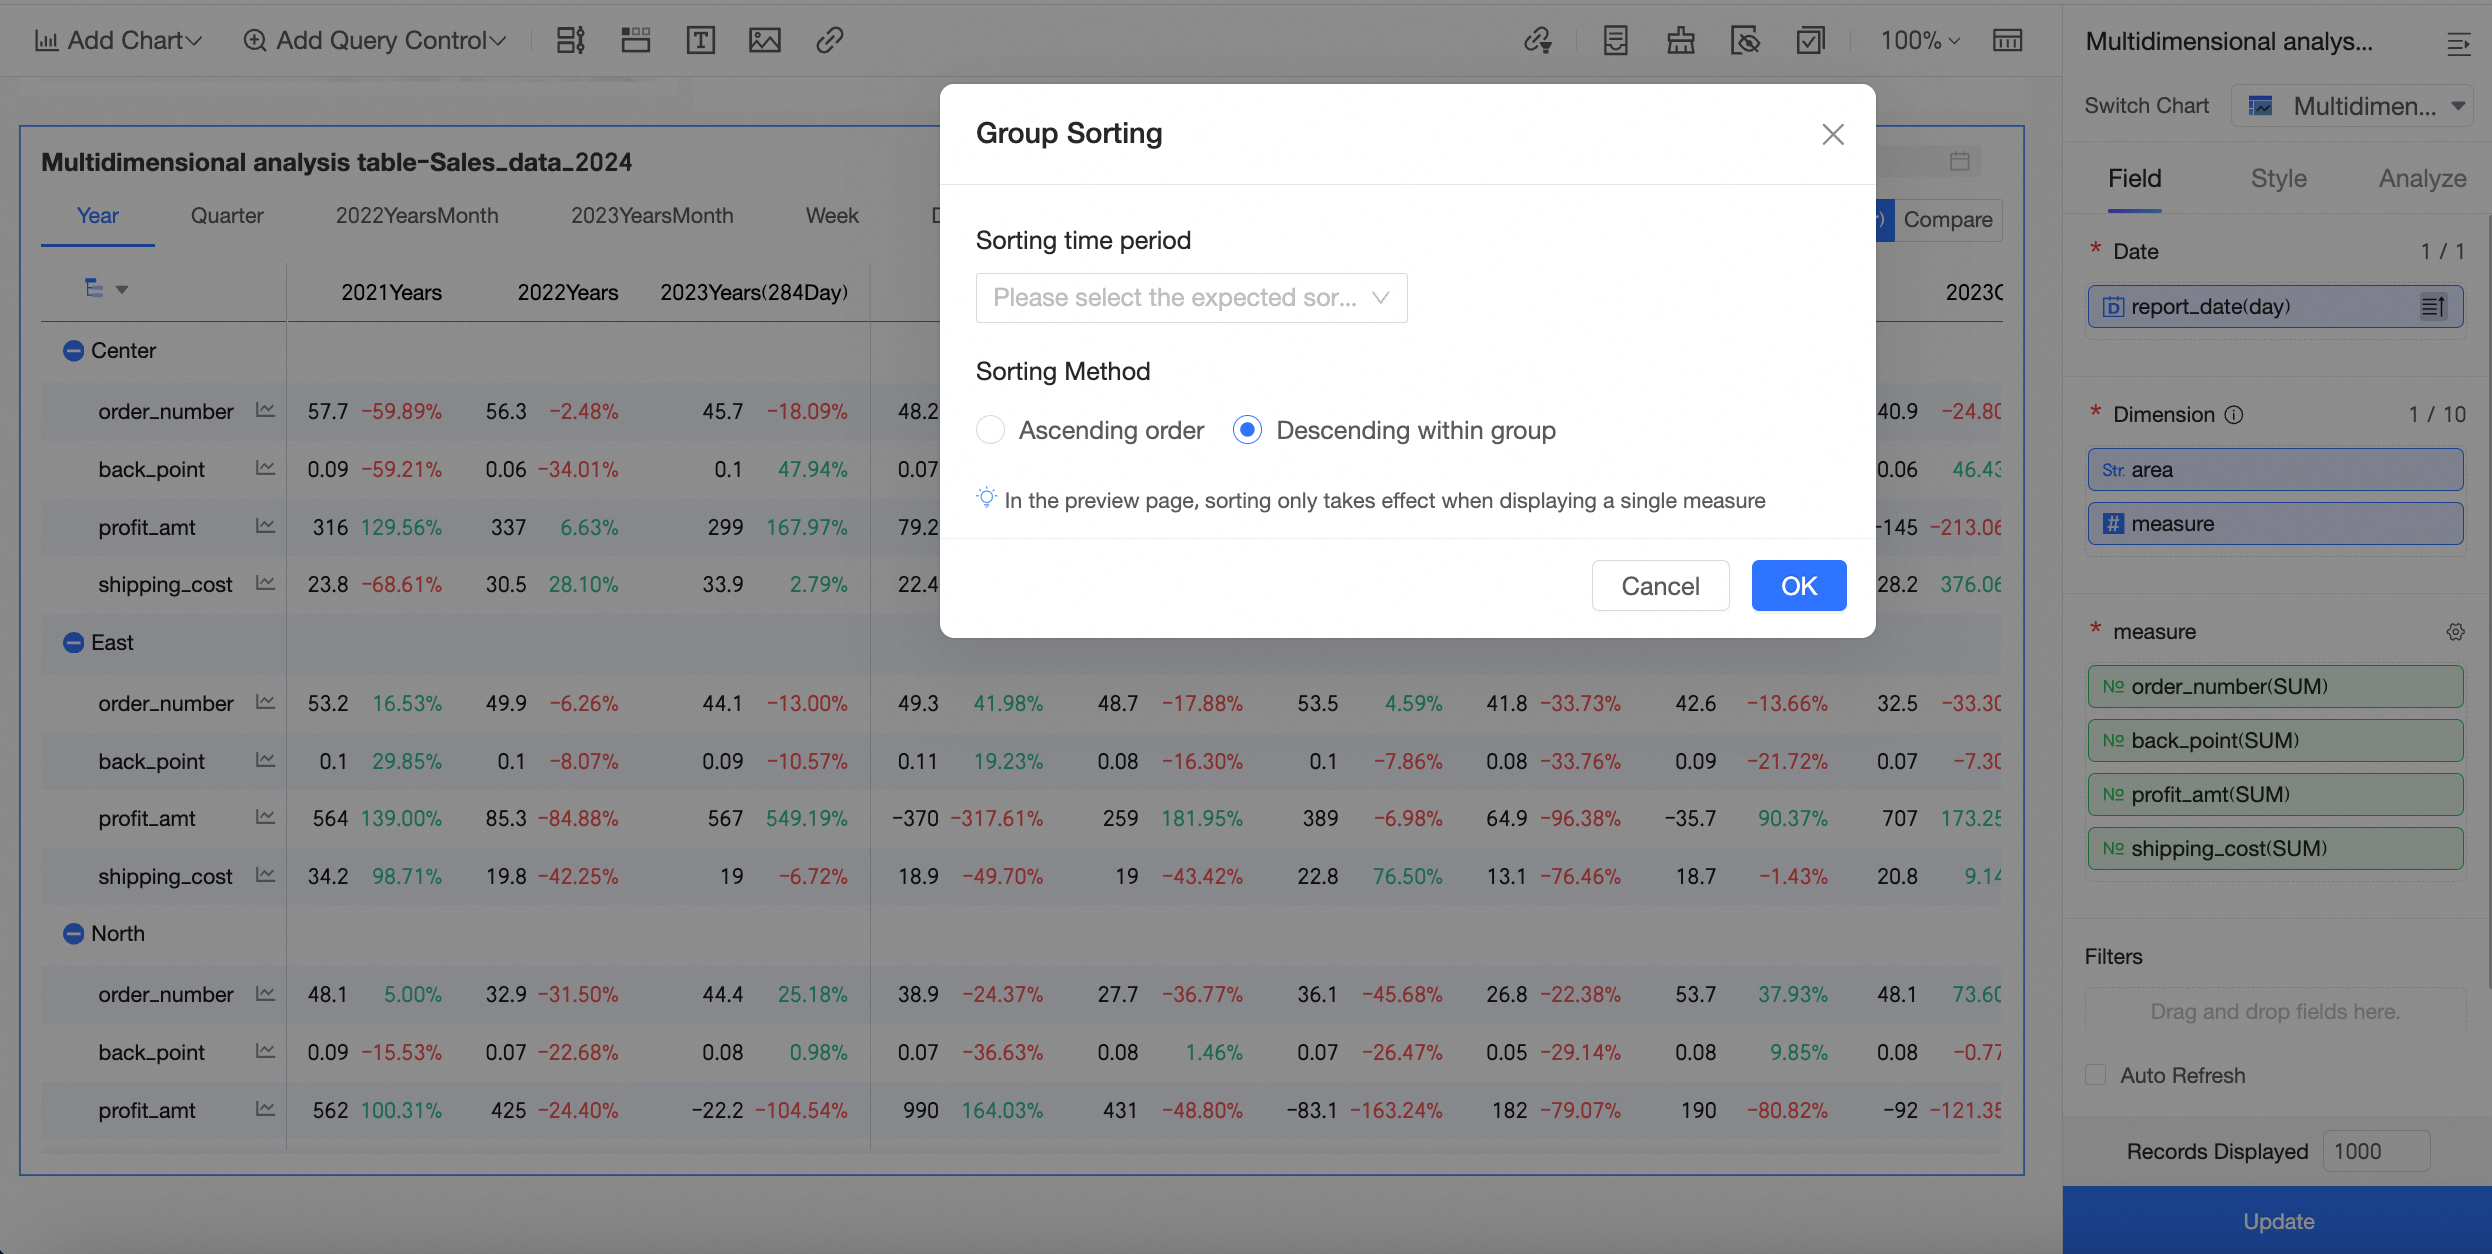
For more information, see multi-dimensional analysis table.
The cross table, detail table, trend analysis table, and multi-dimensional analysis table support dynamic automatic adjustment of table height based on table content.
For more information, see cross table, detail table, trend analysis table, multi-dimensional analysis table.
The first column width of the multi-dimensional analysis table and trend analysis table supports separate configuration on mobile and PC.
For more information, see trend analysis table, multi-dimensional analysis table.
The line chart, area chart, combo chart, and indicator trend chart support line thickness adjustment.
For more information, see line chart, area chart, combo chart, indicator trend chart.
After configuring the cross table for tree display, it supports exporting the tree structure by expanded level.
For more information, see cross table.
The logic for displaying data bars in the cross table has been optimized. The length of positive and negative value lines will be calculated using the same standard.
For more information, see cross table.
The cross table and detail table support detecting line feeds in fields, helping users achieve custom line break effects.
For more information, see cross table.
Supports adjusting the display of missing values in line charts by configuring empty value display styles.
Allows configuration of display styles for missing values in line charts to adjust their visibility.
For more information, see line charts.
The mobile view of the following tables supports configuring the maximum value for dynamic automatic adjustment of table height: cross table, detail table, multi-dimensional analysis table, trend analysis table.
For more information, see cross table, detail table, multi-dimensional analysis table, trend analysis table.
Supports configuring conditional rules based on the values of other fields. Complex conditional rules can be configured using calculated fields (involving cross table, detail table, scorecard, indicator trend chart, ticker board, indicator relationship graph).
For more information, see cross table, detail table, Scorecard, indicator trend chart, ticker board, indicator relationship graph.
Supports quickly configuring conditional rules for background color for entire rows or columns (involving cross table, detail table).
For more information, see cross table, detail table.
When the measure field is placed in the row area and the dimension field is in the column area in the cross table, conditional formatting can also be configured.
For more information, see cross table.
The internal region granularity matching mechanism for Hong Kong (China) and Macao (China) has been adjusted. Districts and counties within Hong Kong (China) and Macao (China) are matched to county granularity. Hong Kong (China) and Macao (China) are matched to province and city granularity, maintaining a consistent logic with municipalities.
For more information, see colored map, bubble map, heat map, flight line map.
Supports configuring conditional rules for when the value is empty or not empty.
Interactive analysis
When setting filter interaction for charts, you can select all items in the search results after searching for charts.
For more information, see filter interaction.
When configuring chart redirection, you can bind placeholders in the global parameter settings.
For more information, see redirection.
Cross tables and detail tables support the use of the select-only and exclude features through lasso selection.
For more information, see lasso selection.
Query control
Supports the cascade capability of date query controls: when the date selection is sourced from a dataset field, it supports cascading with other dropdown list controls, and multiple dates can be directly cascaded.
For more information, see date query control cascade configuration.
Supports configuring quick intervals based on yesterday for the current month, week, and quarter in the time granularity of time query controls.
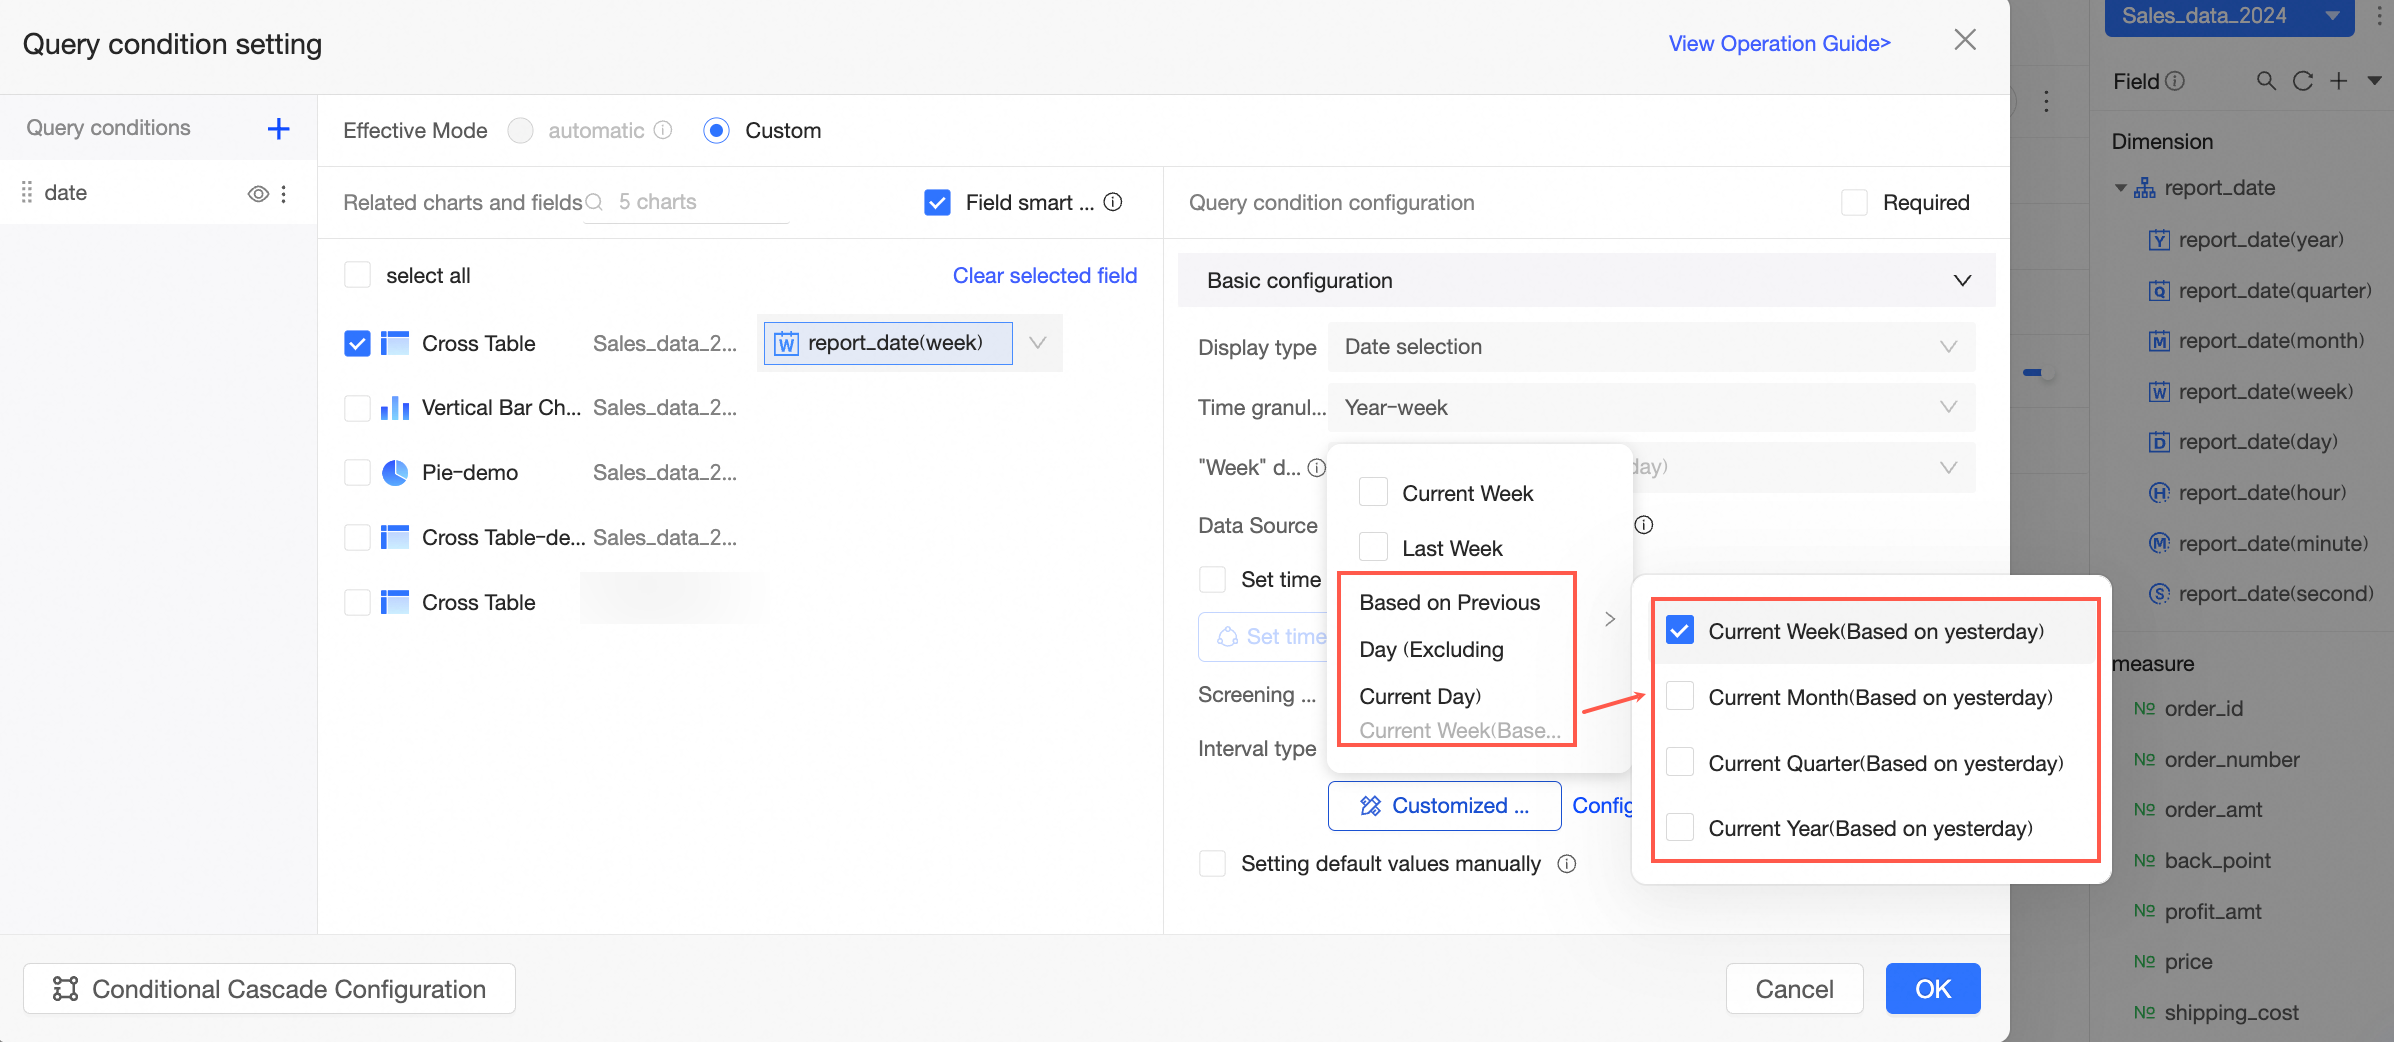
For more information, see create query control and date query.
When the display type of the query control is a dropdown list and the option values are sourced from a single dataset, it supports custom setting of the arrangement order of option values.
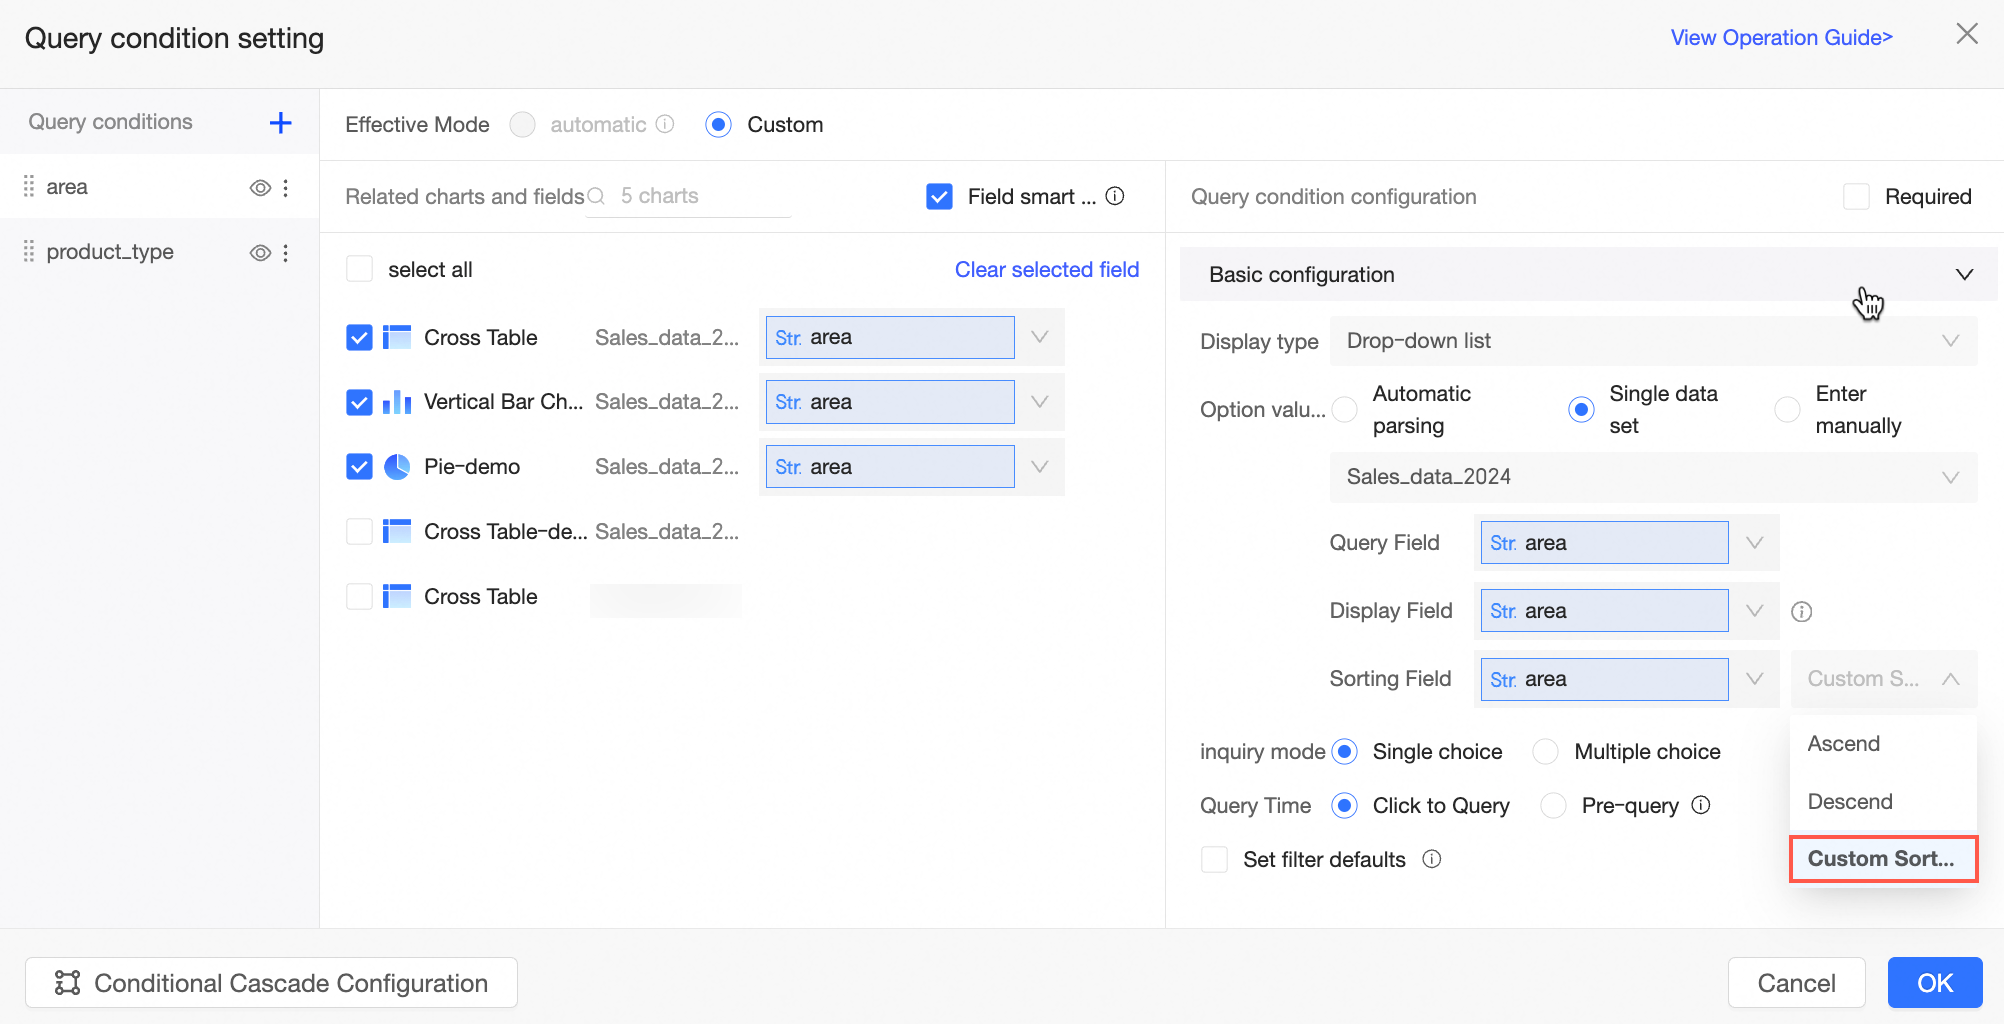
For more information, see create query control and text query.
The cascade of query controls supports placeholder type fields.
For more information, see configure query control cascade.
Workbook
The workbook supports viewing on mobile devices.
For more information, see mobile workbook.
Images can be pasted using shortcut keys within a cell.
For more information, see configure a workbook.
After grouping in the workbook, the grouping feature can be viewed in preview mode.
For more information, see configure a workbook.
The hidden gridlines in the workbook can be saved.
For more information, see configure a workbook.
The public link of the workbook supports downloads and data retrieval (for large data volumes).
For more information, see report configuration.
The workbook can retain up to the 5 most recent published versions and 15 saved versions within the last three months. Online historical versions exceeding the limit will be deleted gradually.
For more information, see recover historical versions.
The workbook supports configuring whether to apply conditional formatting to summary data.
The custom formula interaction experience in the workbook is optimized.
For more information, see configure a workbook.
When measure fields are placed in the row area and dimension fields are in the column area, conditional formatting can also be configured.
For more information, see configure a workbook.
Supports quick configuration of background color conditional rules for entire rows or columns.
For more information, see configure a workbook.
Supports configuring conditional rules for when values are empty or not empty.
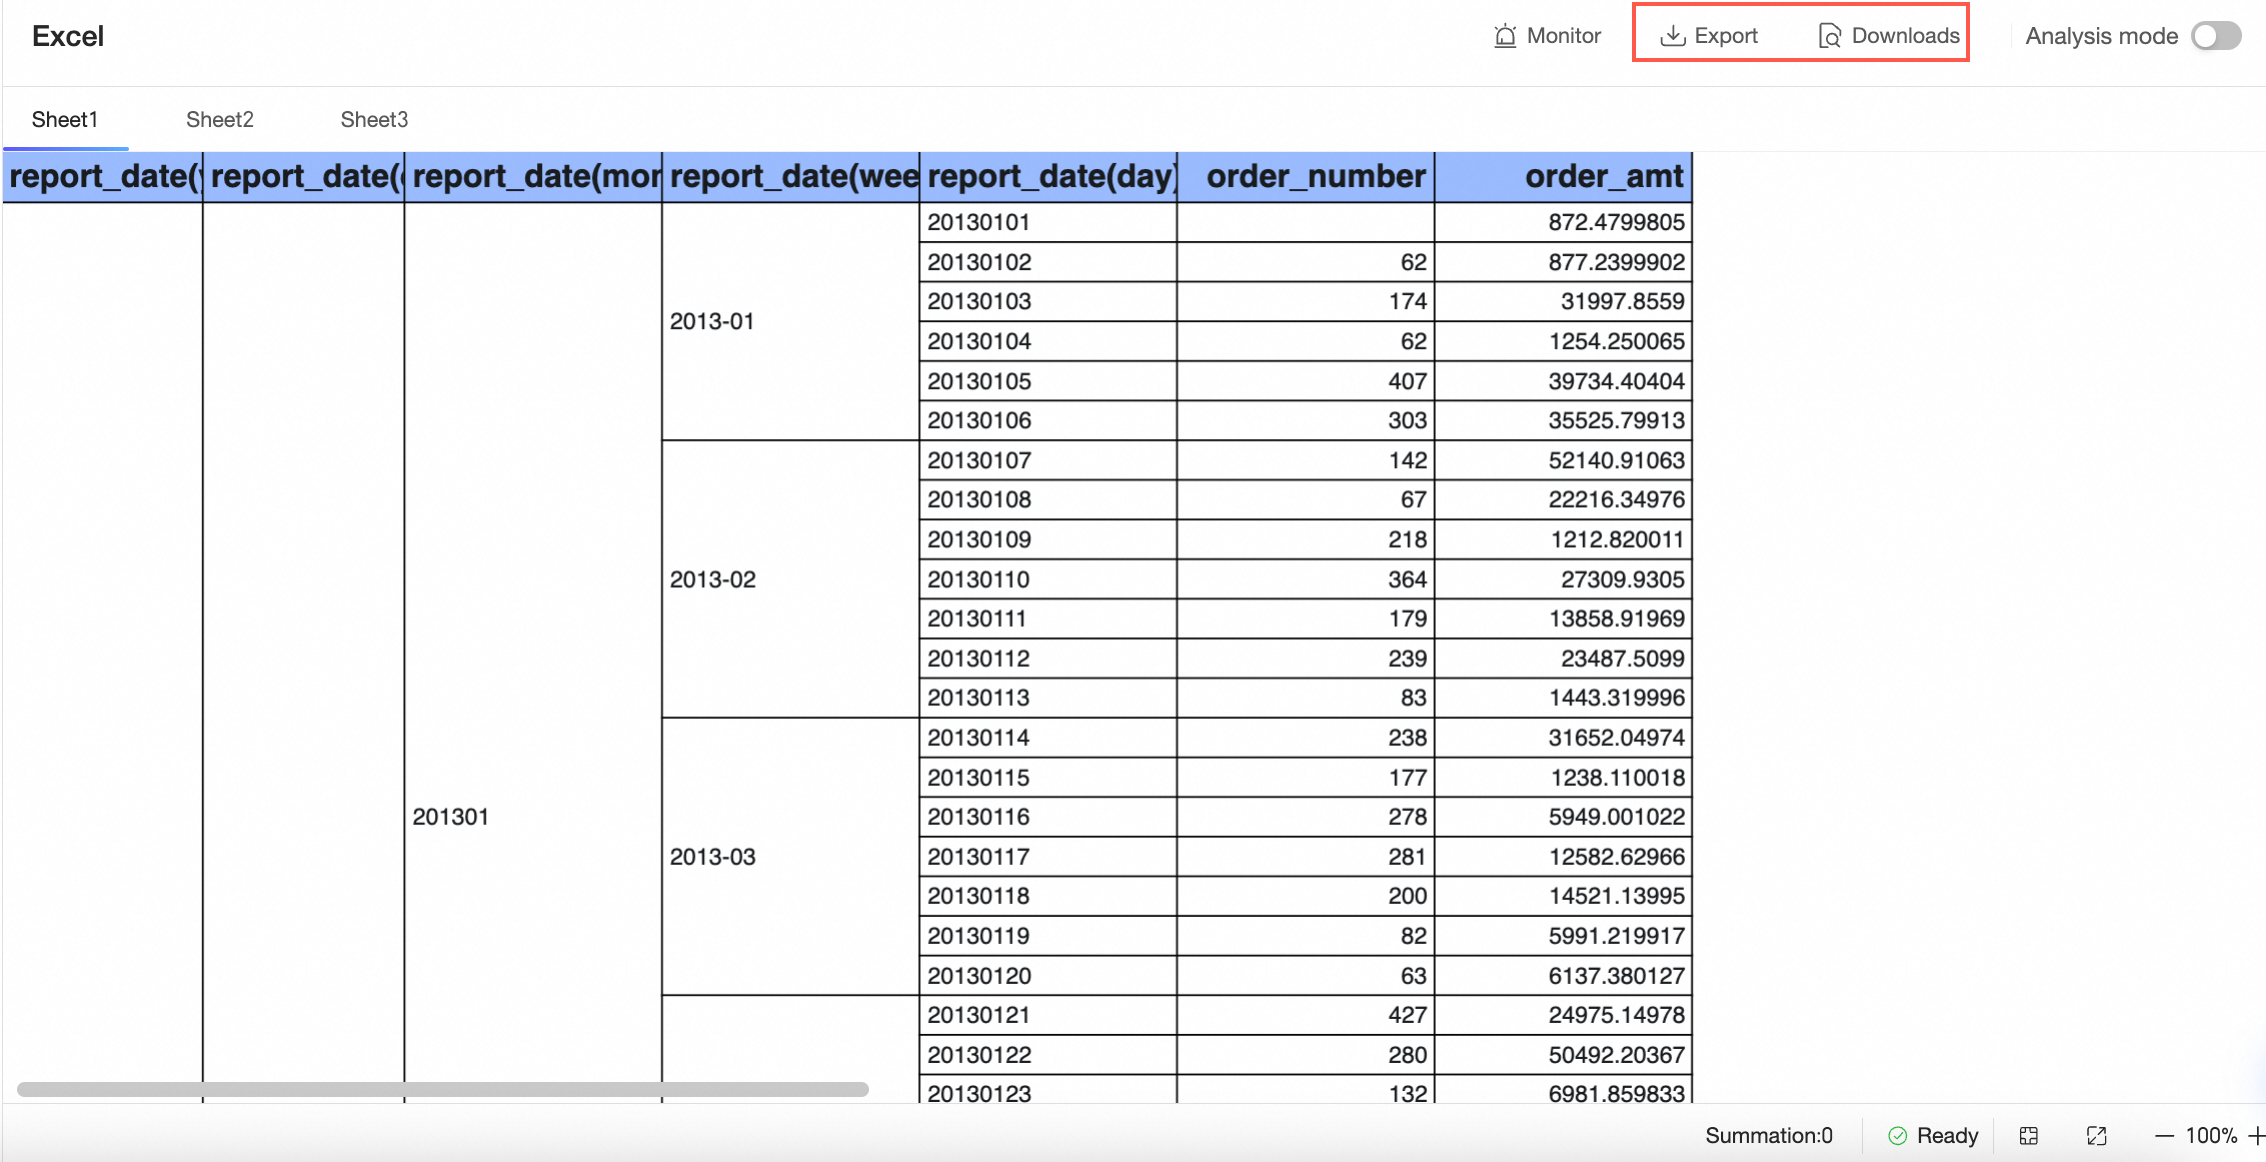
Downloads
The export format for downloads has been expanded to support formatted CSV.
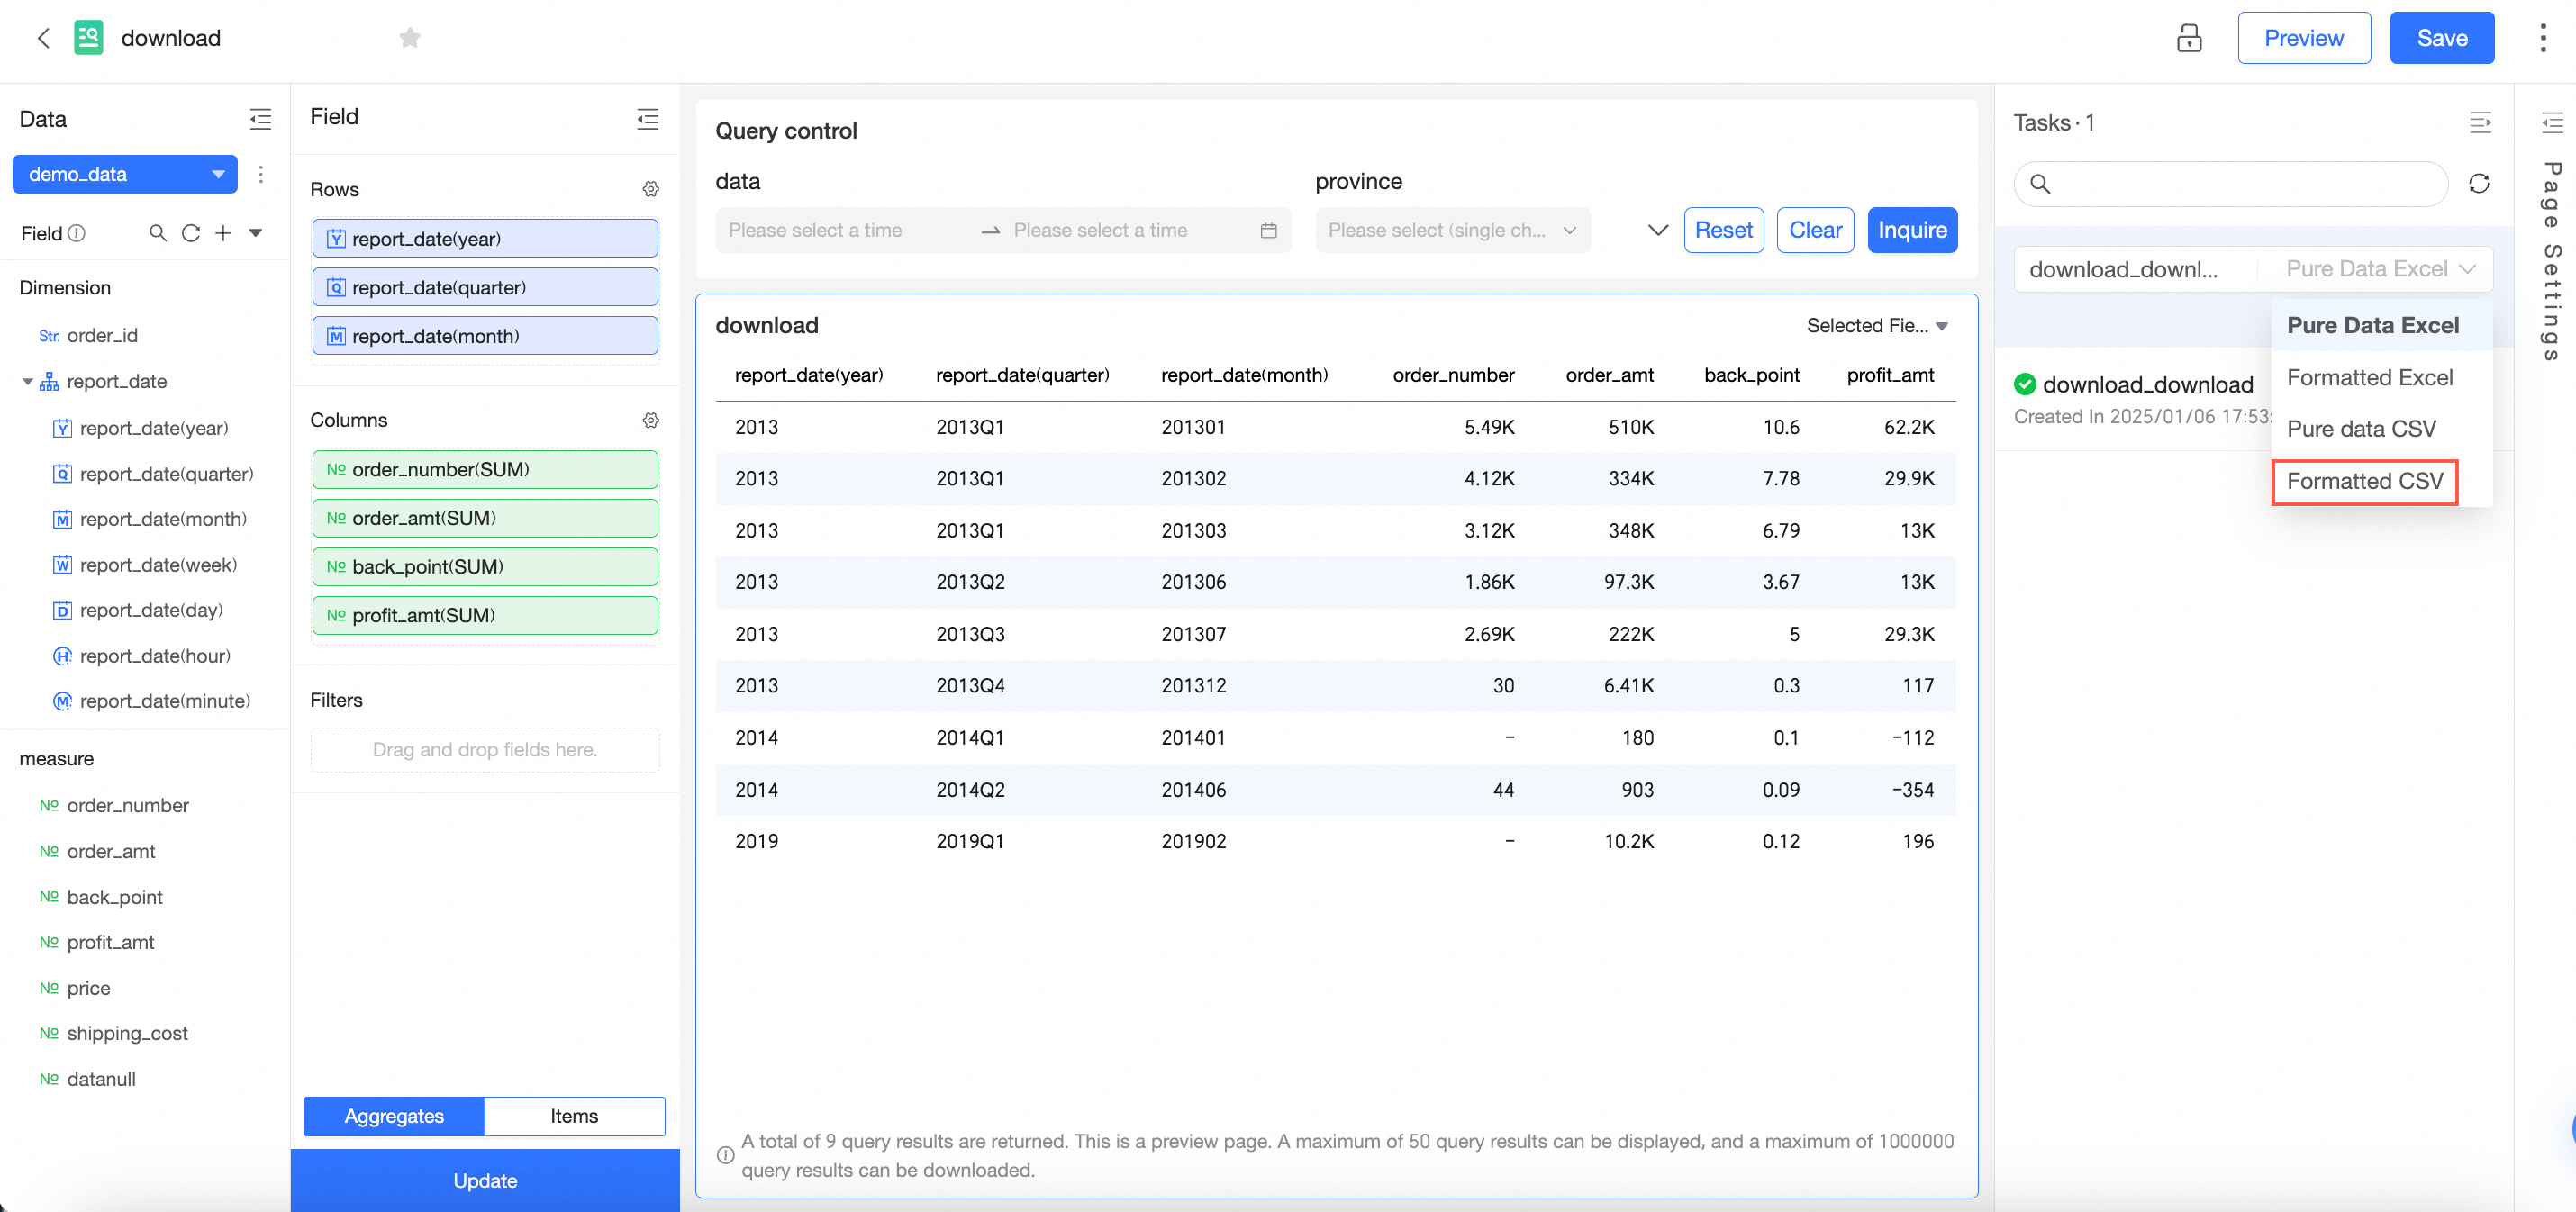
For more information, see Create and manage download tasks.
Downloads support configuring custom organization roles for management.
For more information, see Role management.
Downloads support switching between light and dark themes.
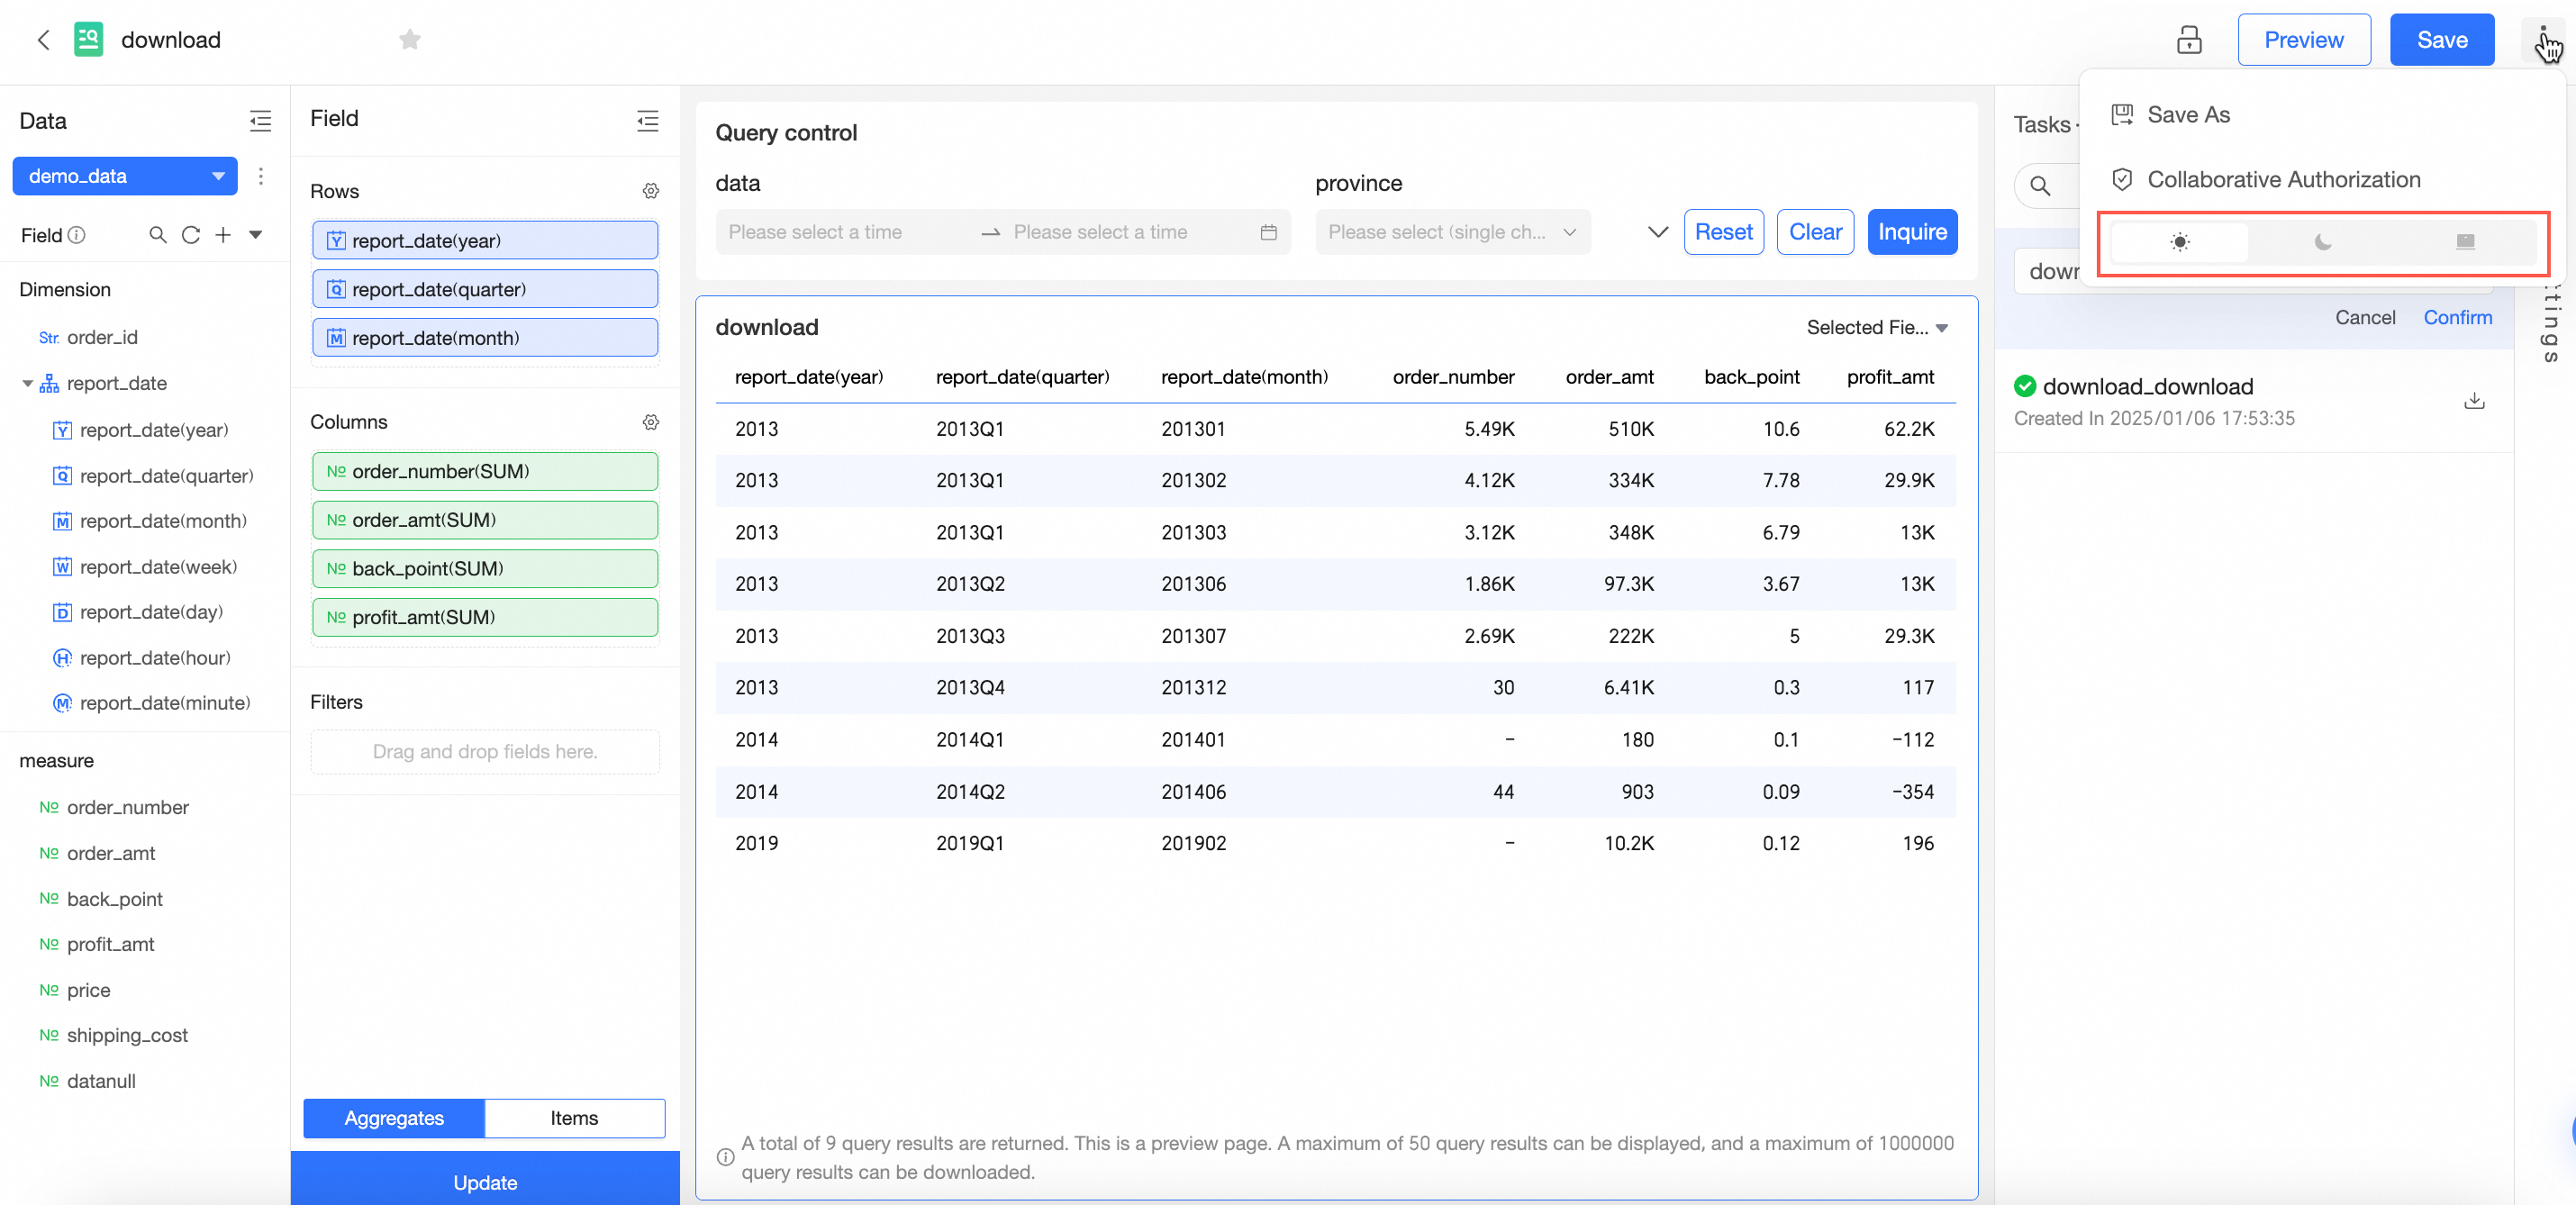
For more information, see Configure a download.
BI portal
The BI portal adds a "click folder node to select submenu" configuration item. After checking, clicking the folder node will automatically display the next level submenu.
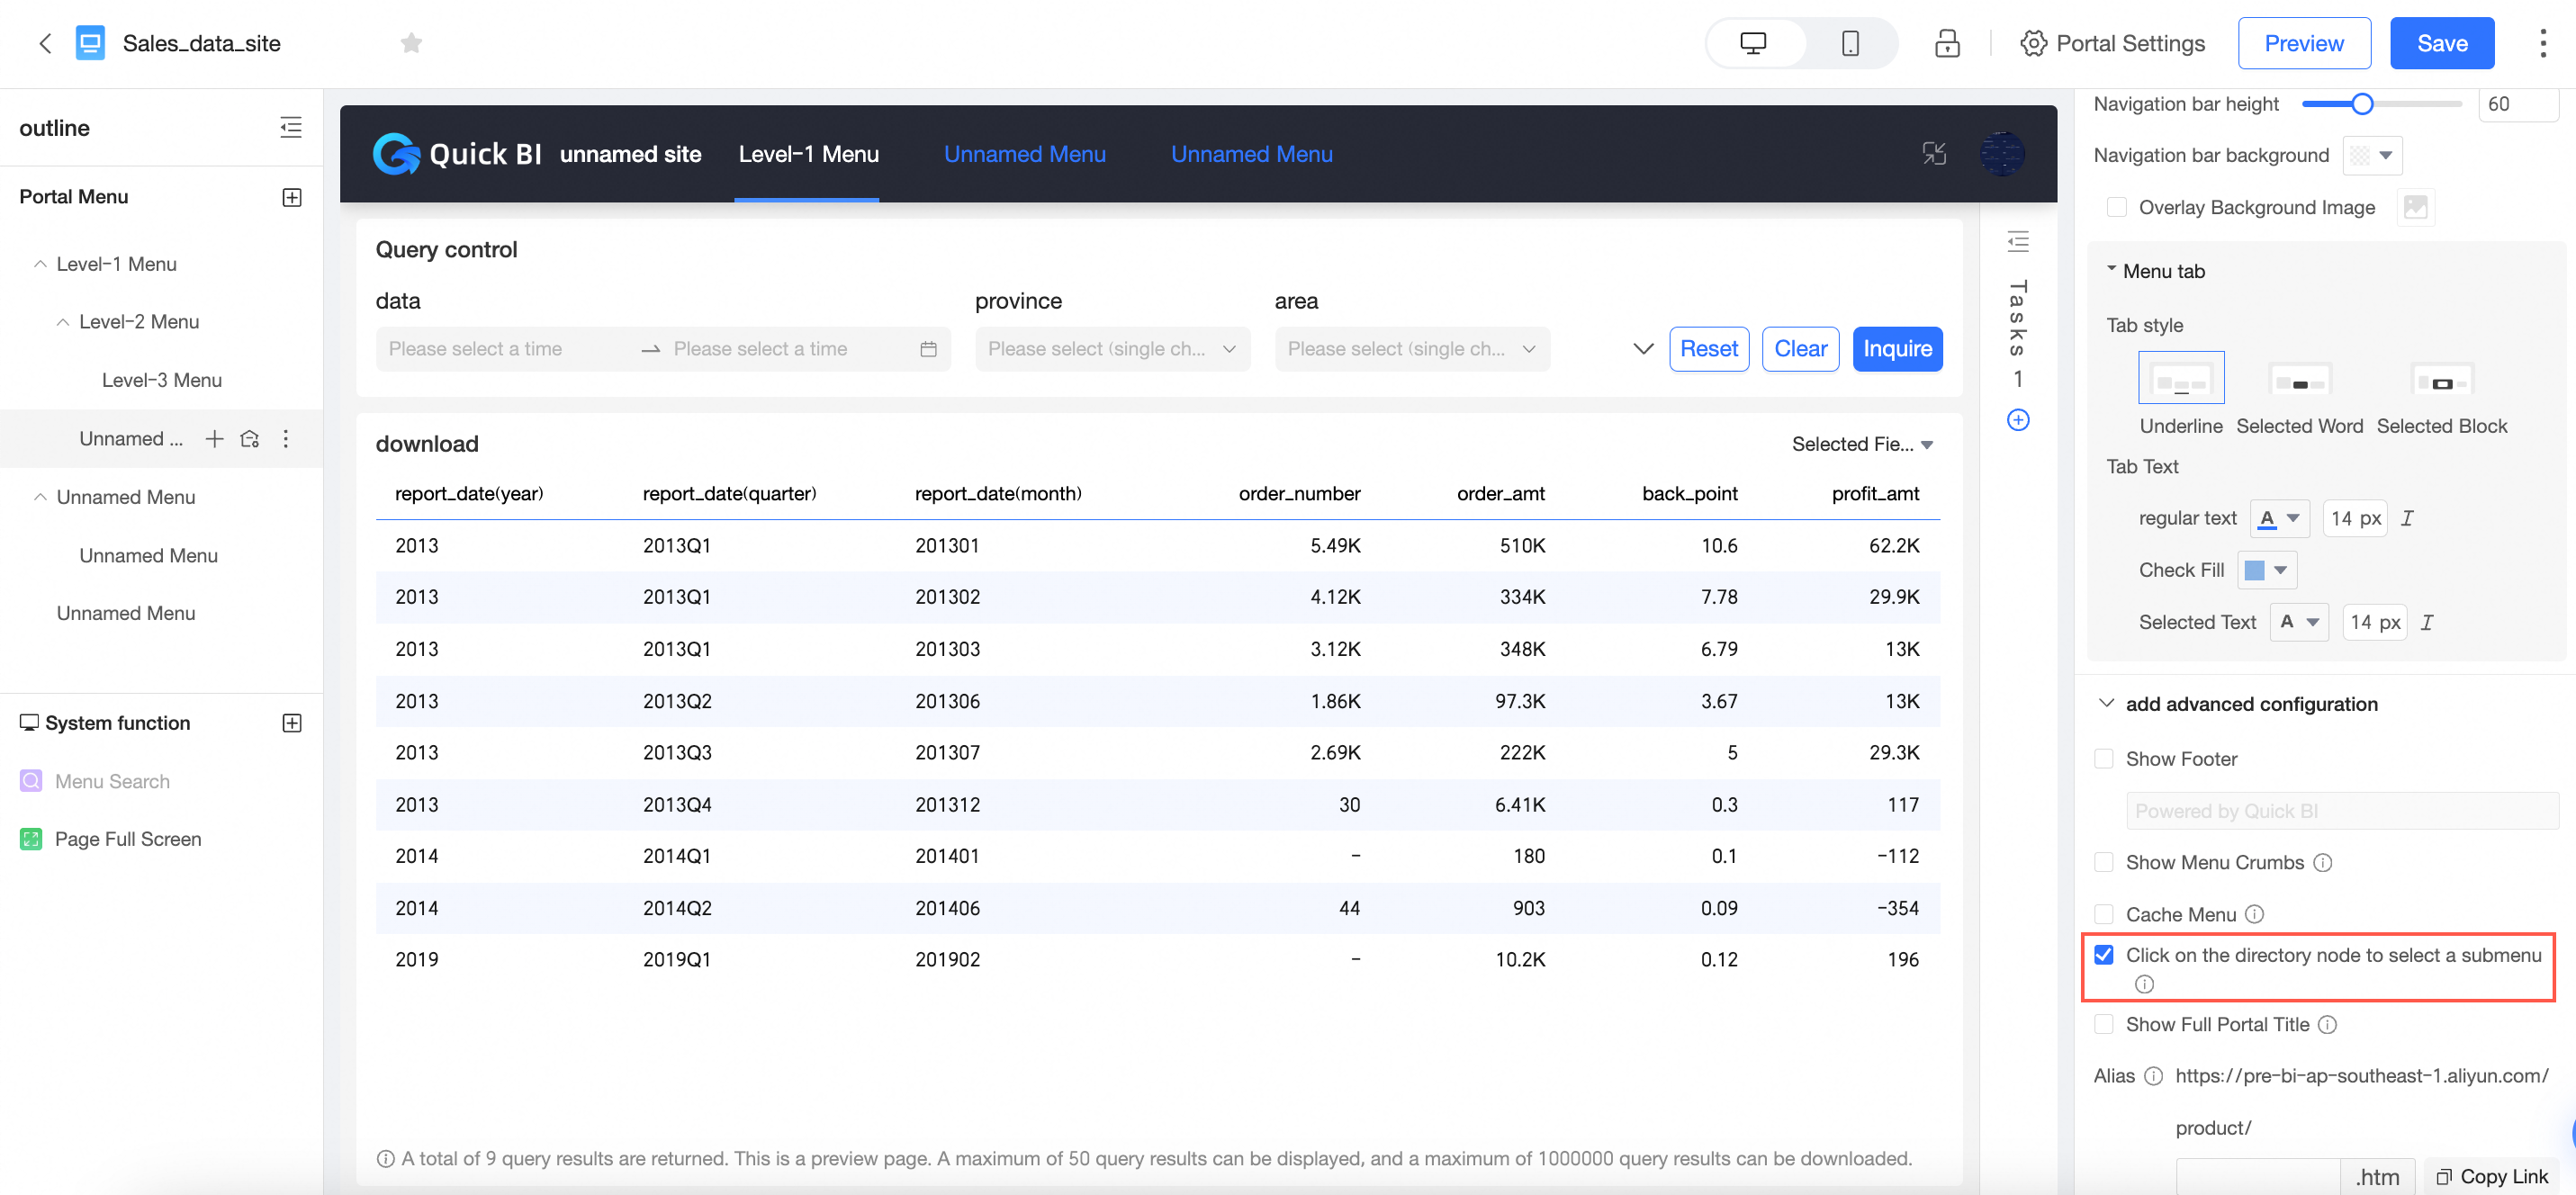
For more information, see create a PC BI portal.
The BI portal collaborative authorization supports configuring the menu entry to be hidden for unauthorized users at the parent node. The original "menu entry visible only to authorized users" is renamed to "menu entry hidden for unauthorized users".
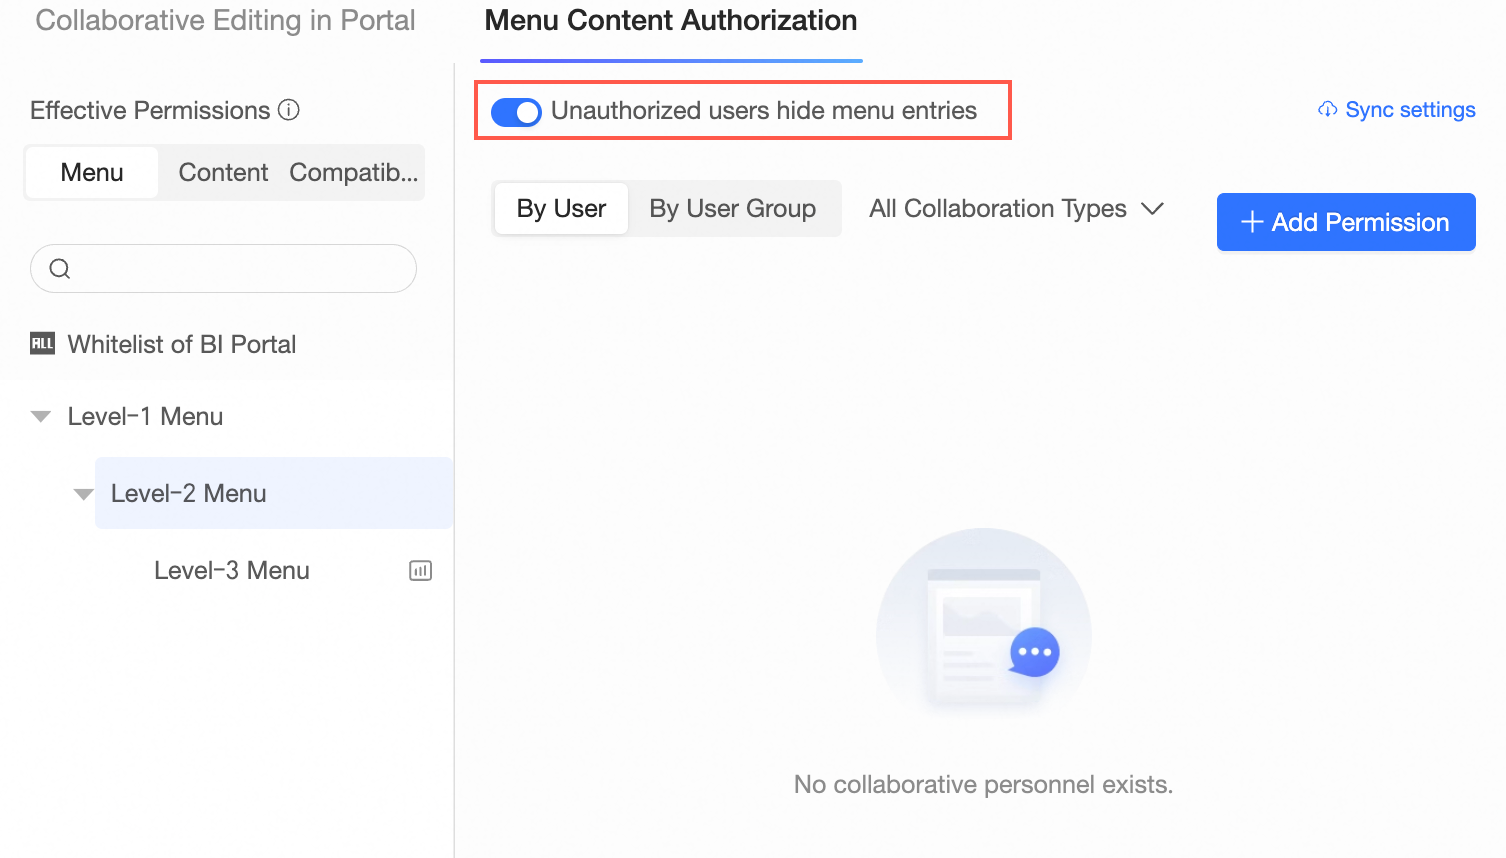
For more information, see grant users the permissions on BI portals.
Monitoring alerts
Add the feature to stop scheduling after consecutive failures.
For more information, see configure monitoring.
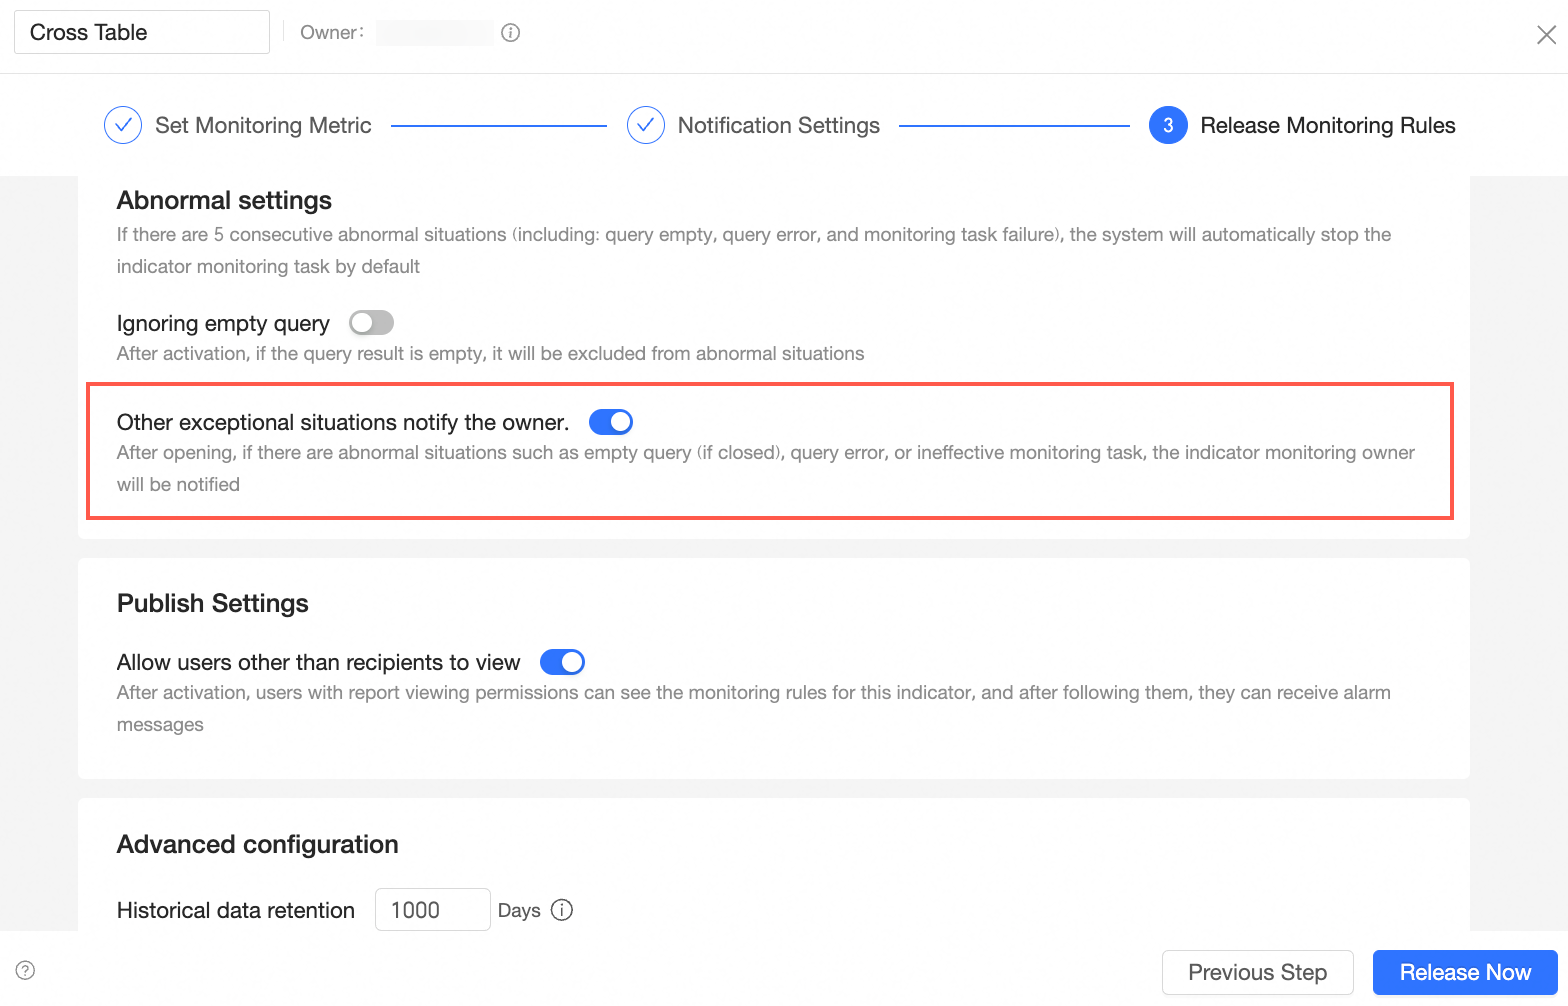
Support custom abnormal alert rules. You can choose whether to ignore queries that are empty based on the business scenario.
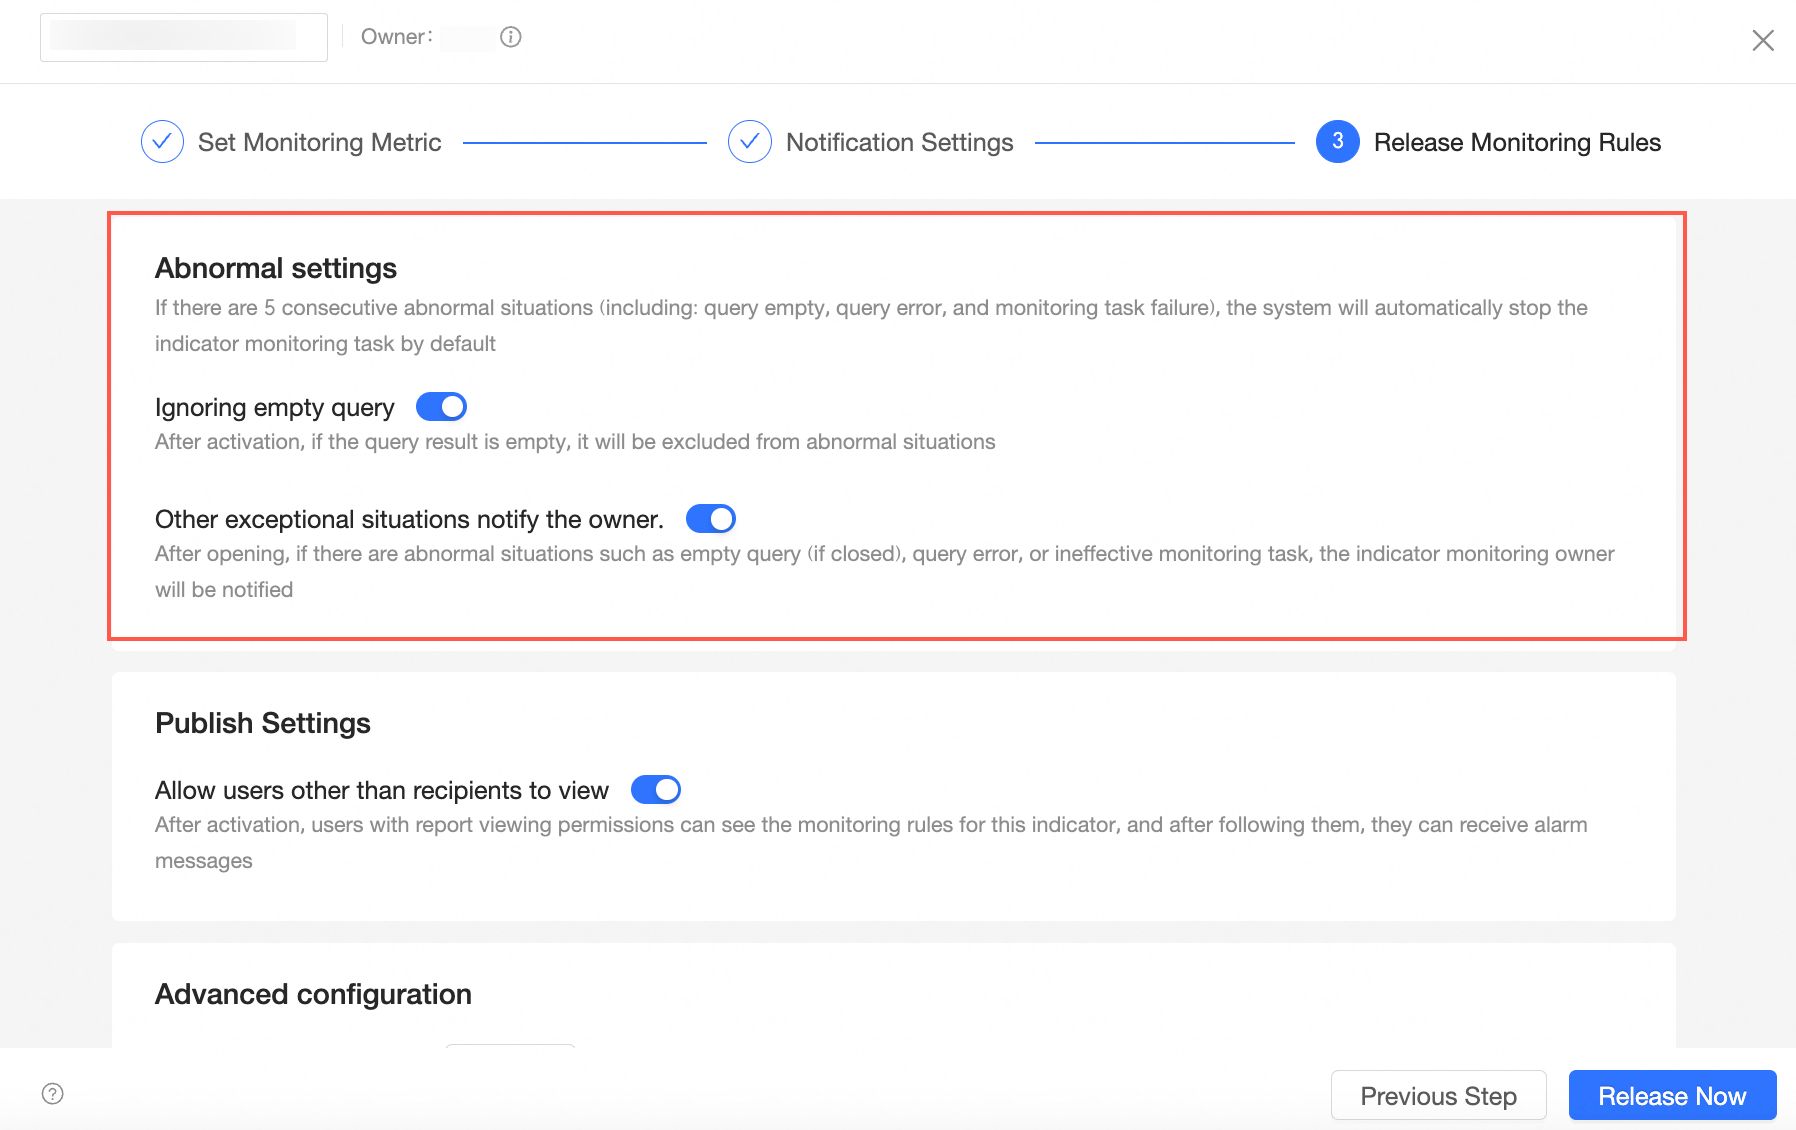
For more information, see configure monitoring.
The card dashboard supports creating monitoring.
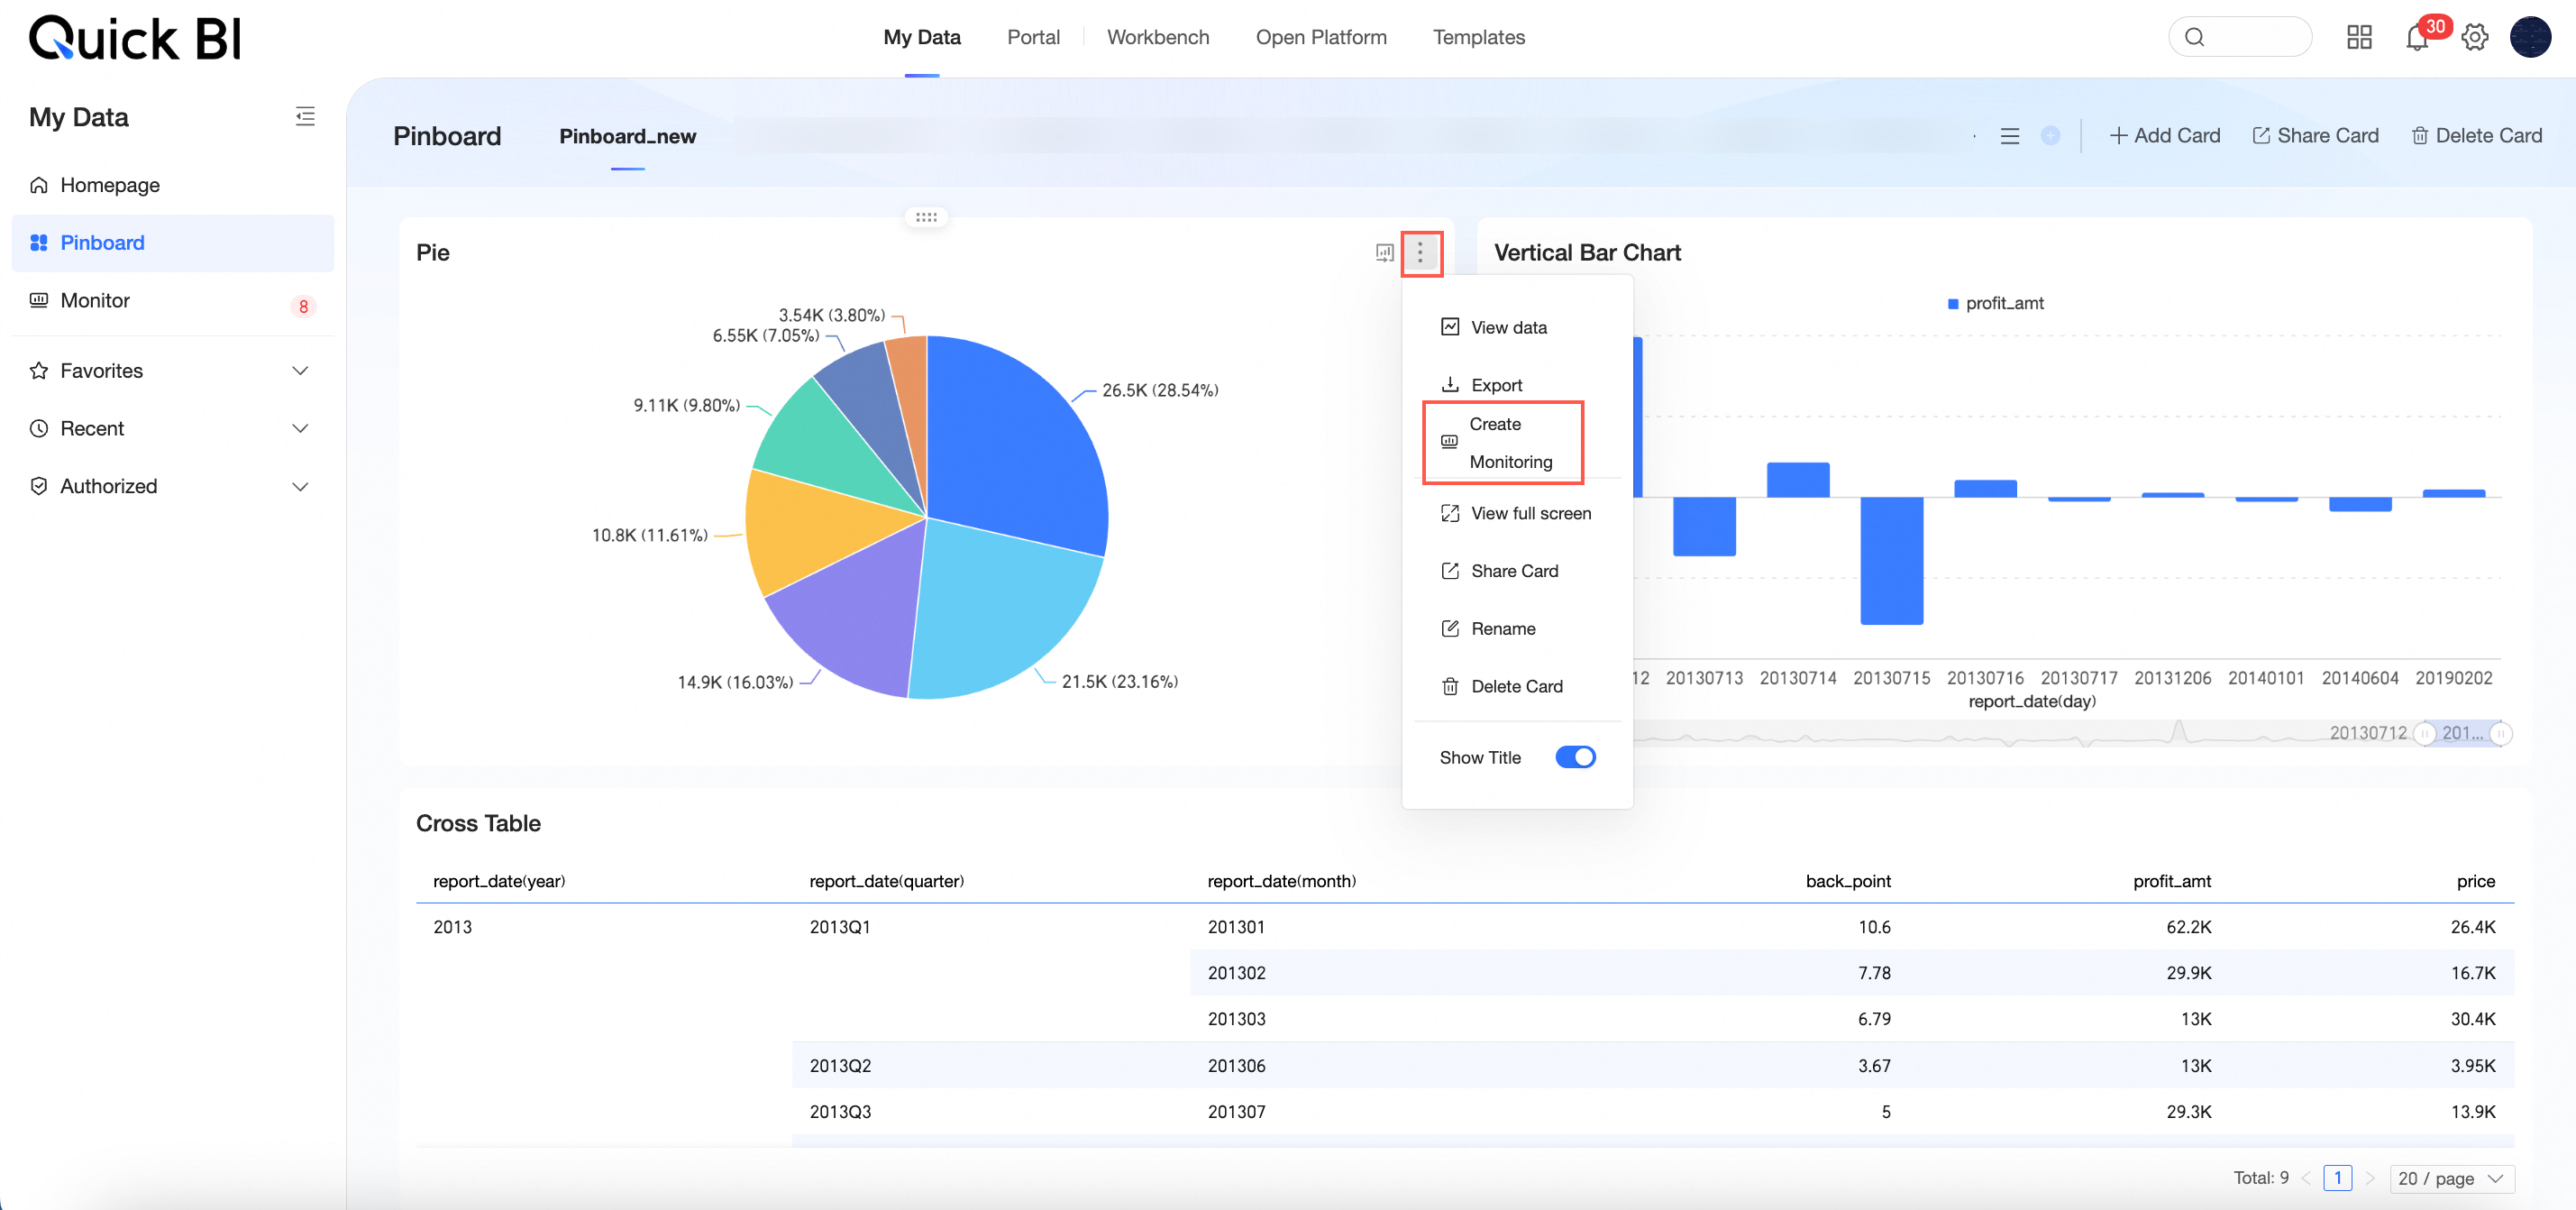
For more information, see card dashboard.
Optimize the metric details page. Monitoring data is retained for up to 1000 entries.
For more information, see view alarm information.
Optimize the display of the source of work notification metrics.
Subscribe
The subscription content supports adding watermarks, providing better data security.
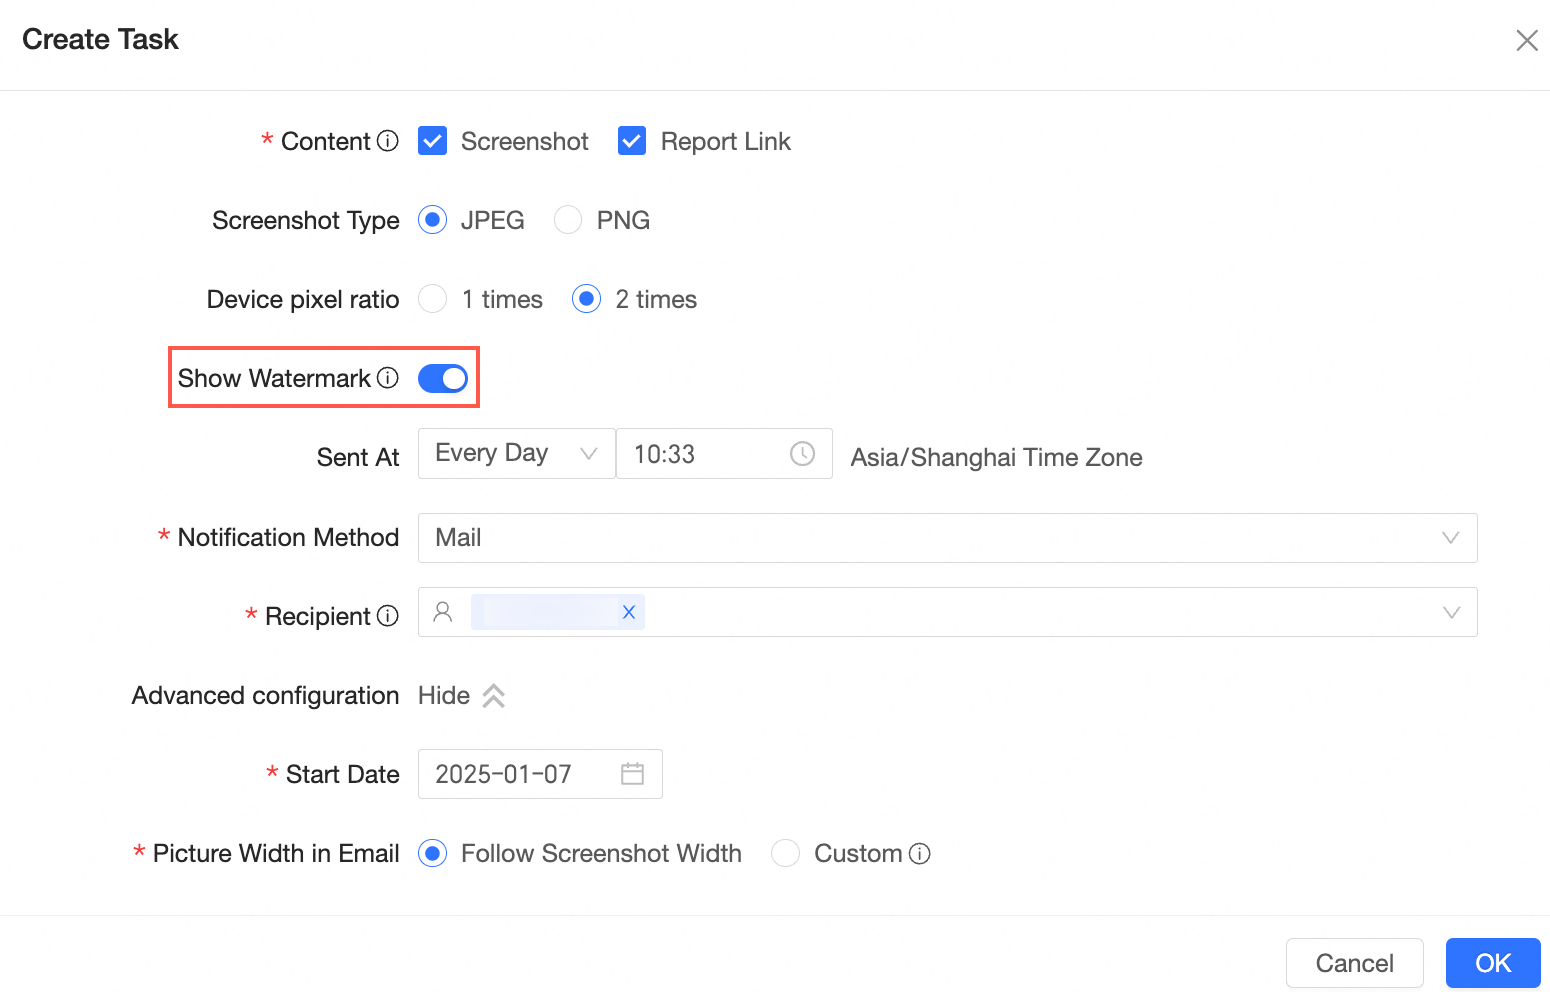
For more information, see Create a Subscription Task.
Supports batch pausing or deleting subscription tasks.
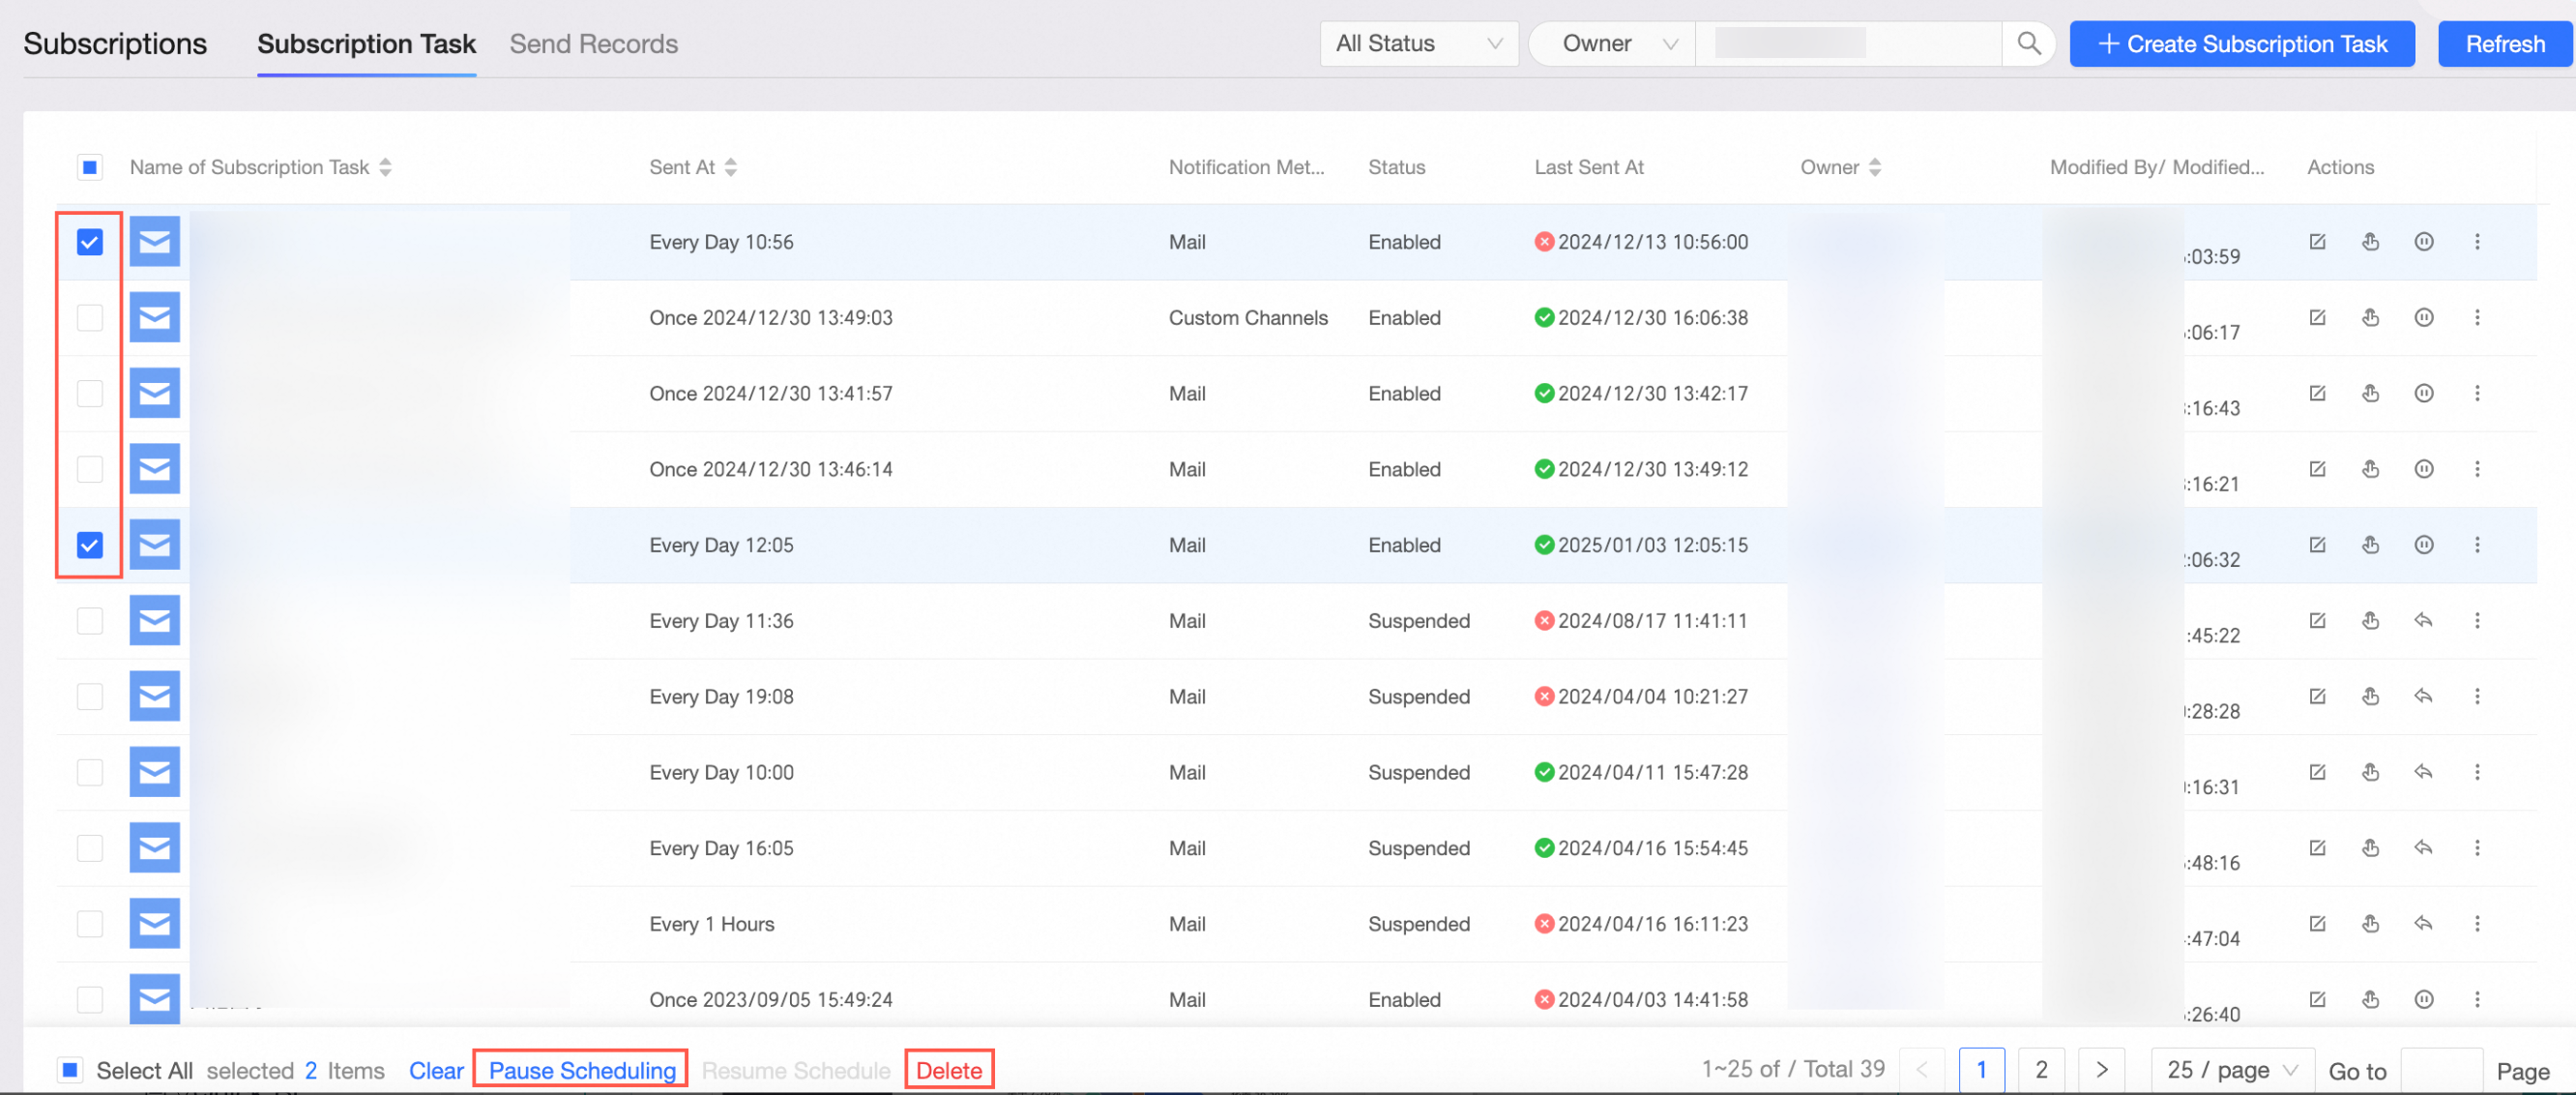
For more information, see Manage Subscription Tasks.
Pinboard
Support collecting data cards from the portal.
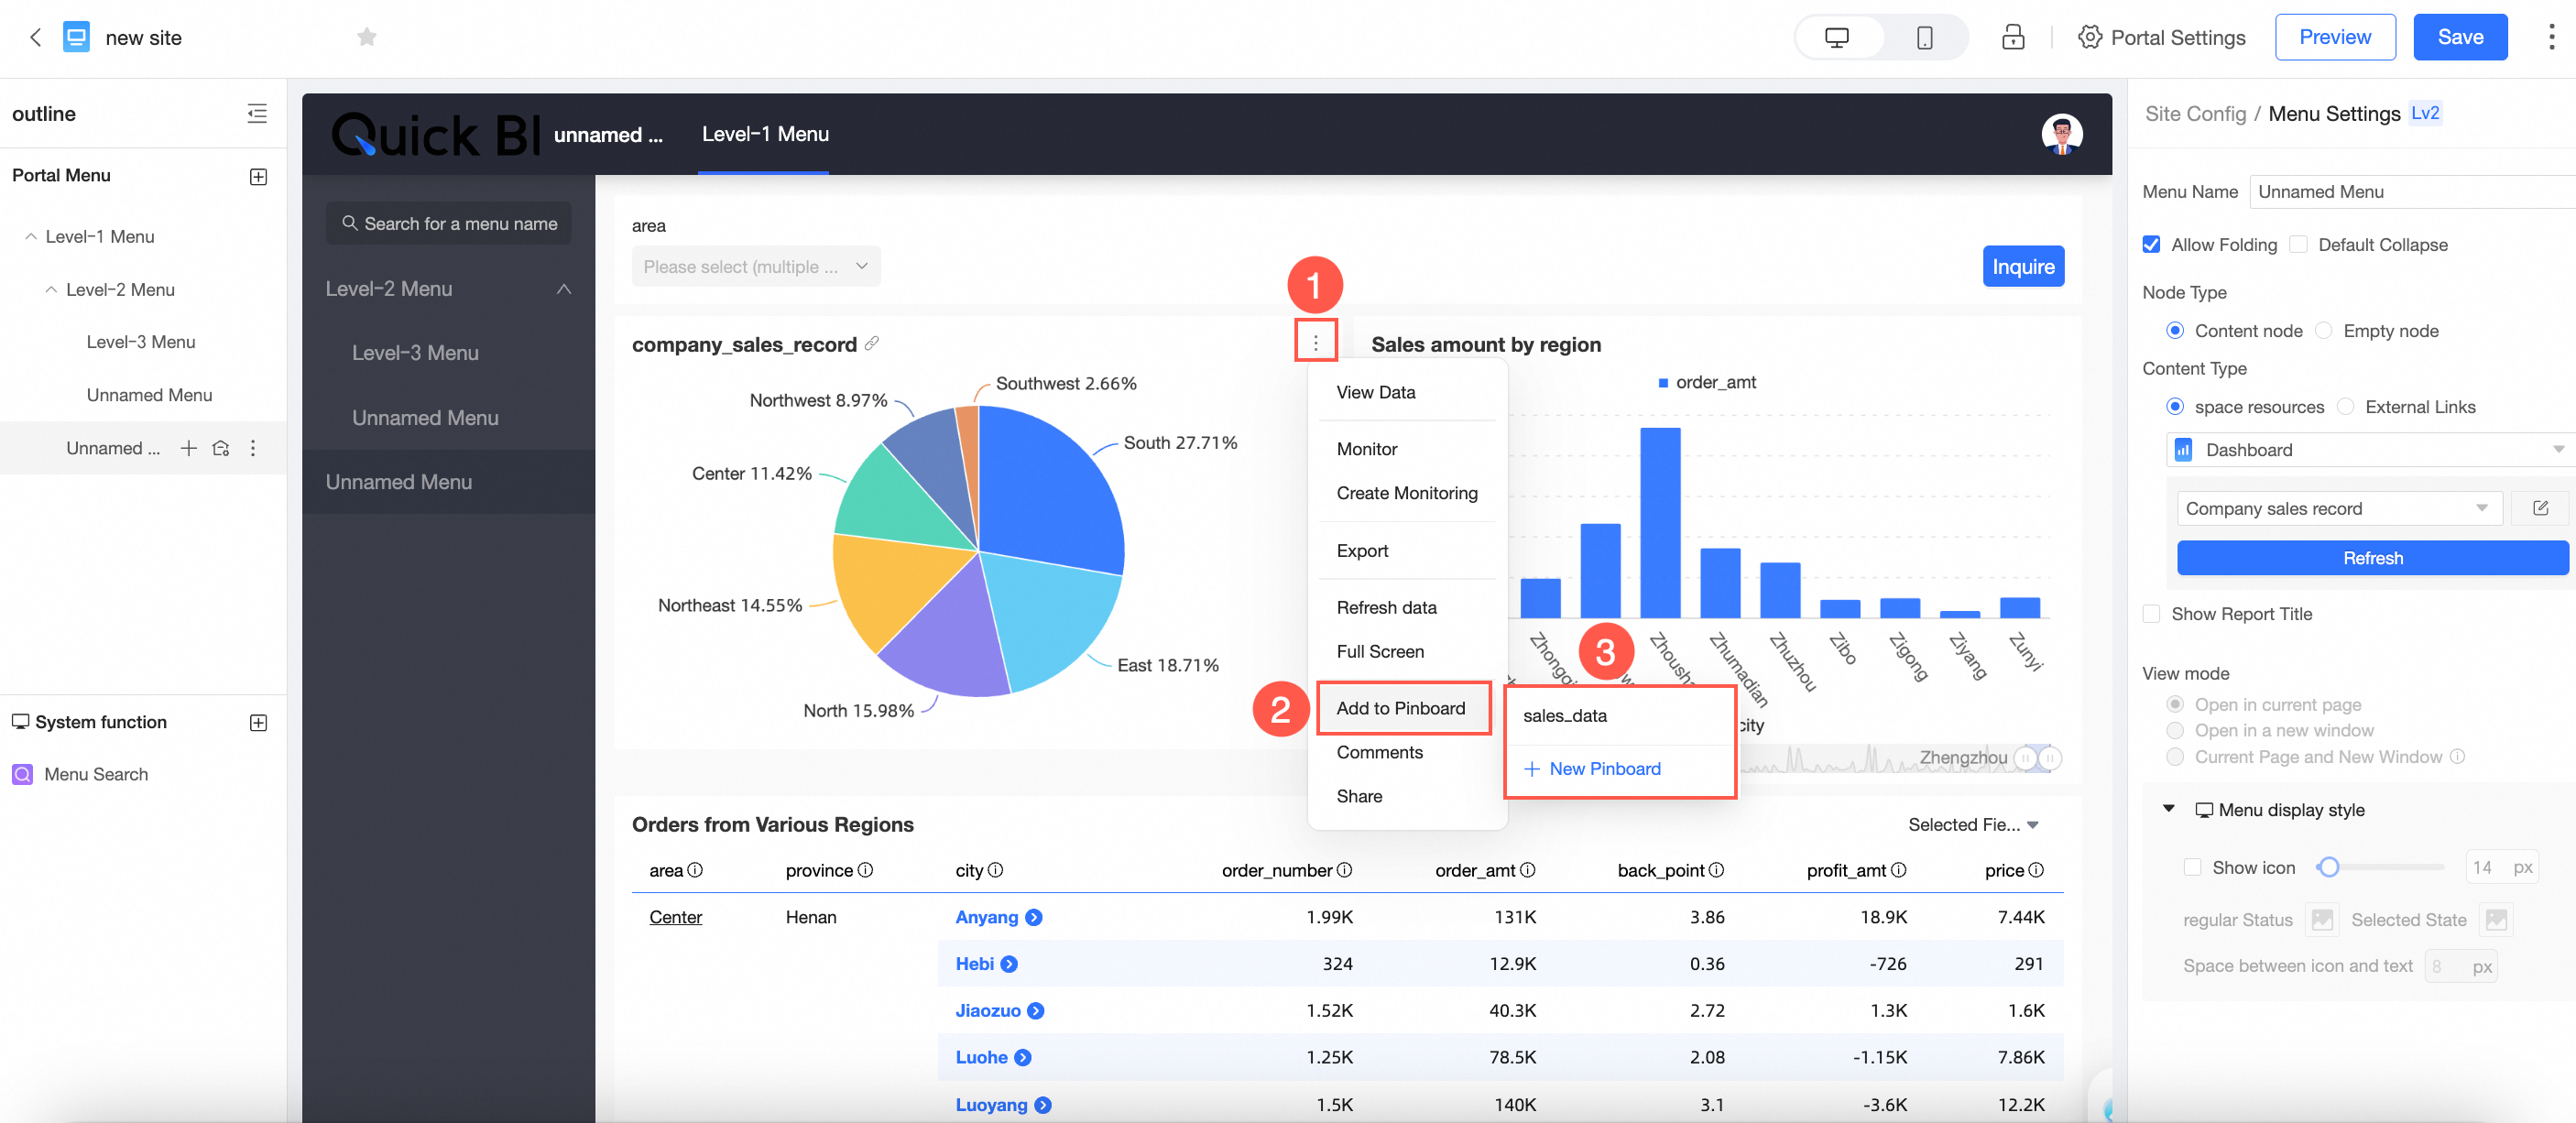
For more information, see the referenced document.
When cards are collected into the card dashboard, they can include dashboard-level, tab-level, and widget-level query controls and support modifications.
For more information, see the referenced document.
Permission management
Support setting organization-level column-level permission desensitization rules.
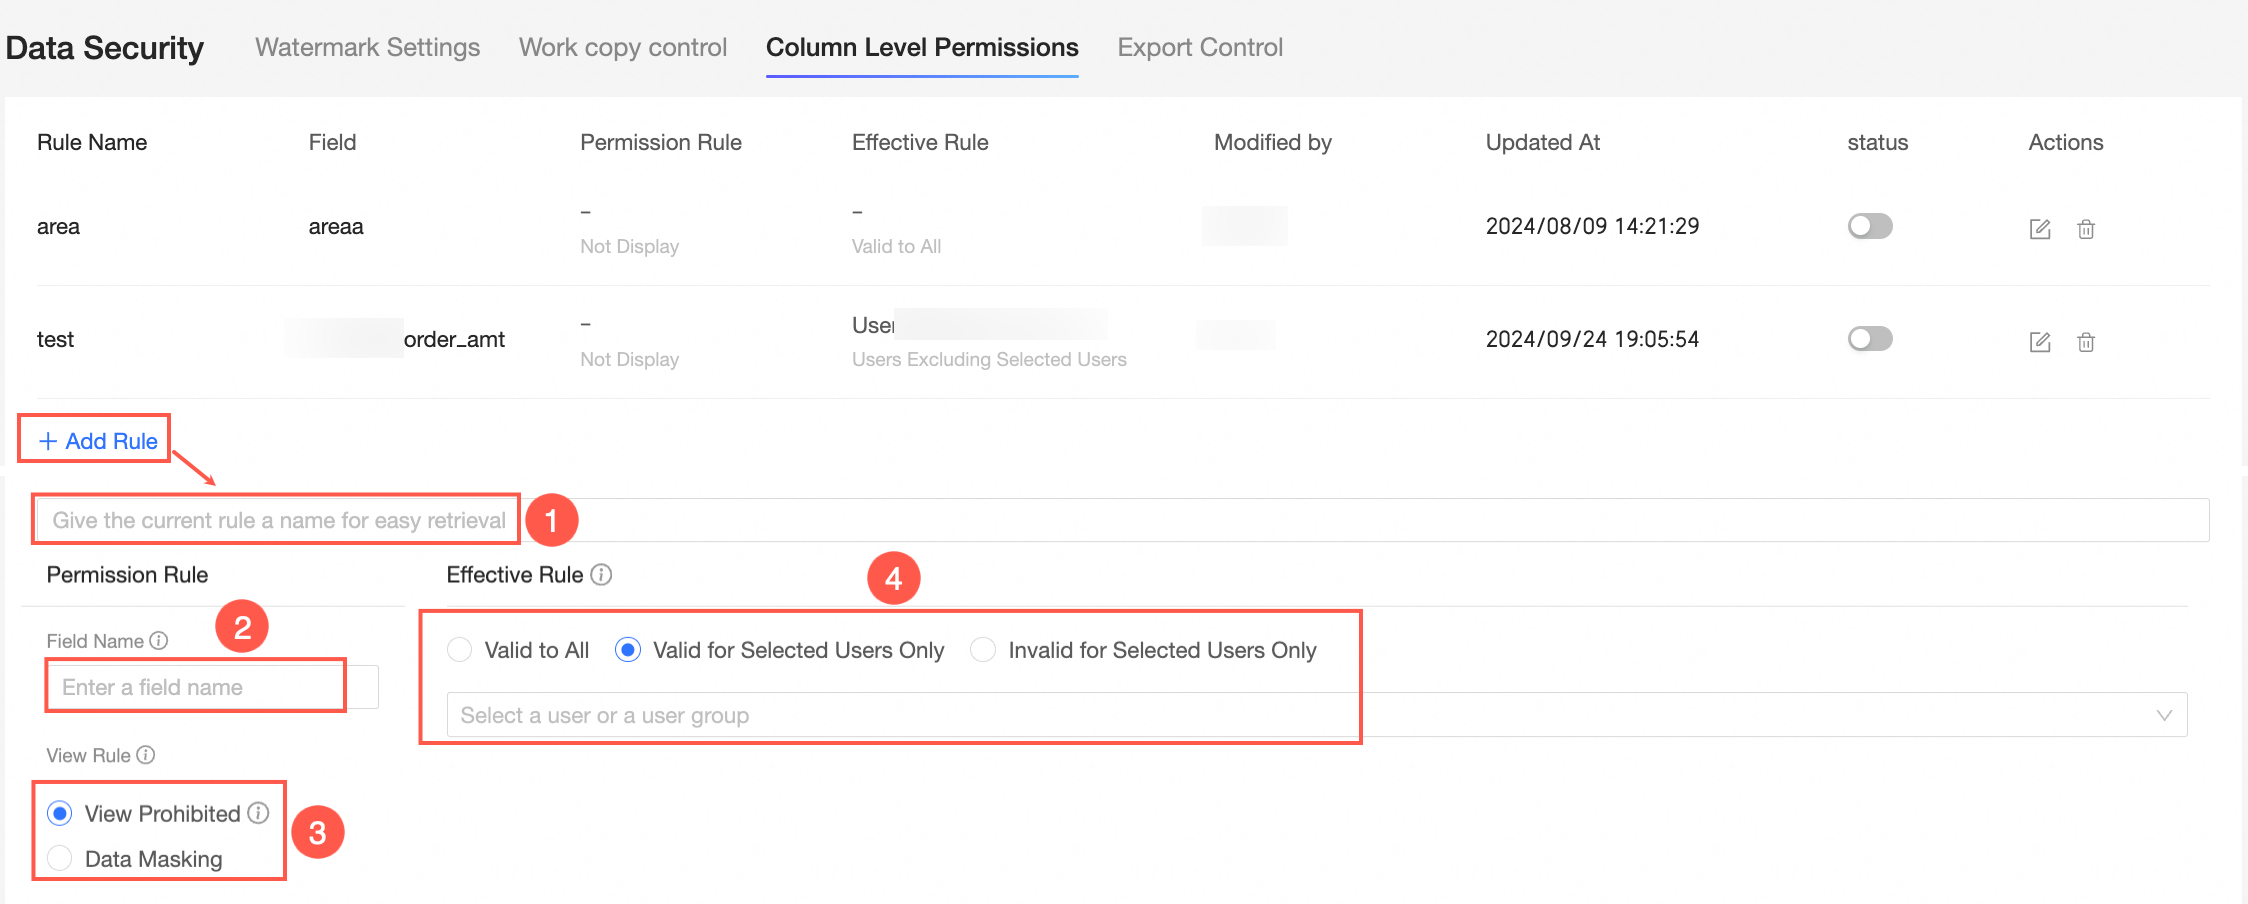 For more information, see column-level permissions.
The organization role adds a new role for artificial intelligence for IT operations. Users associated with this role have permissions for the artificial intelligence for IT operations module (including statistical analysis, app performance analytics, and kinship analysis).
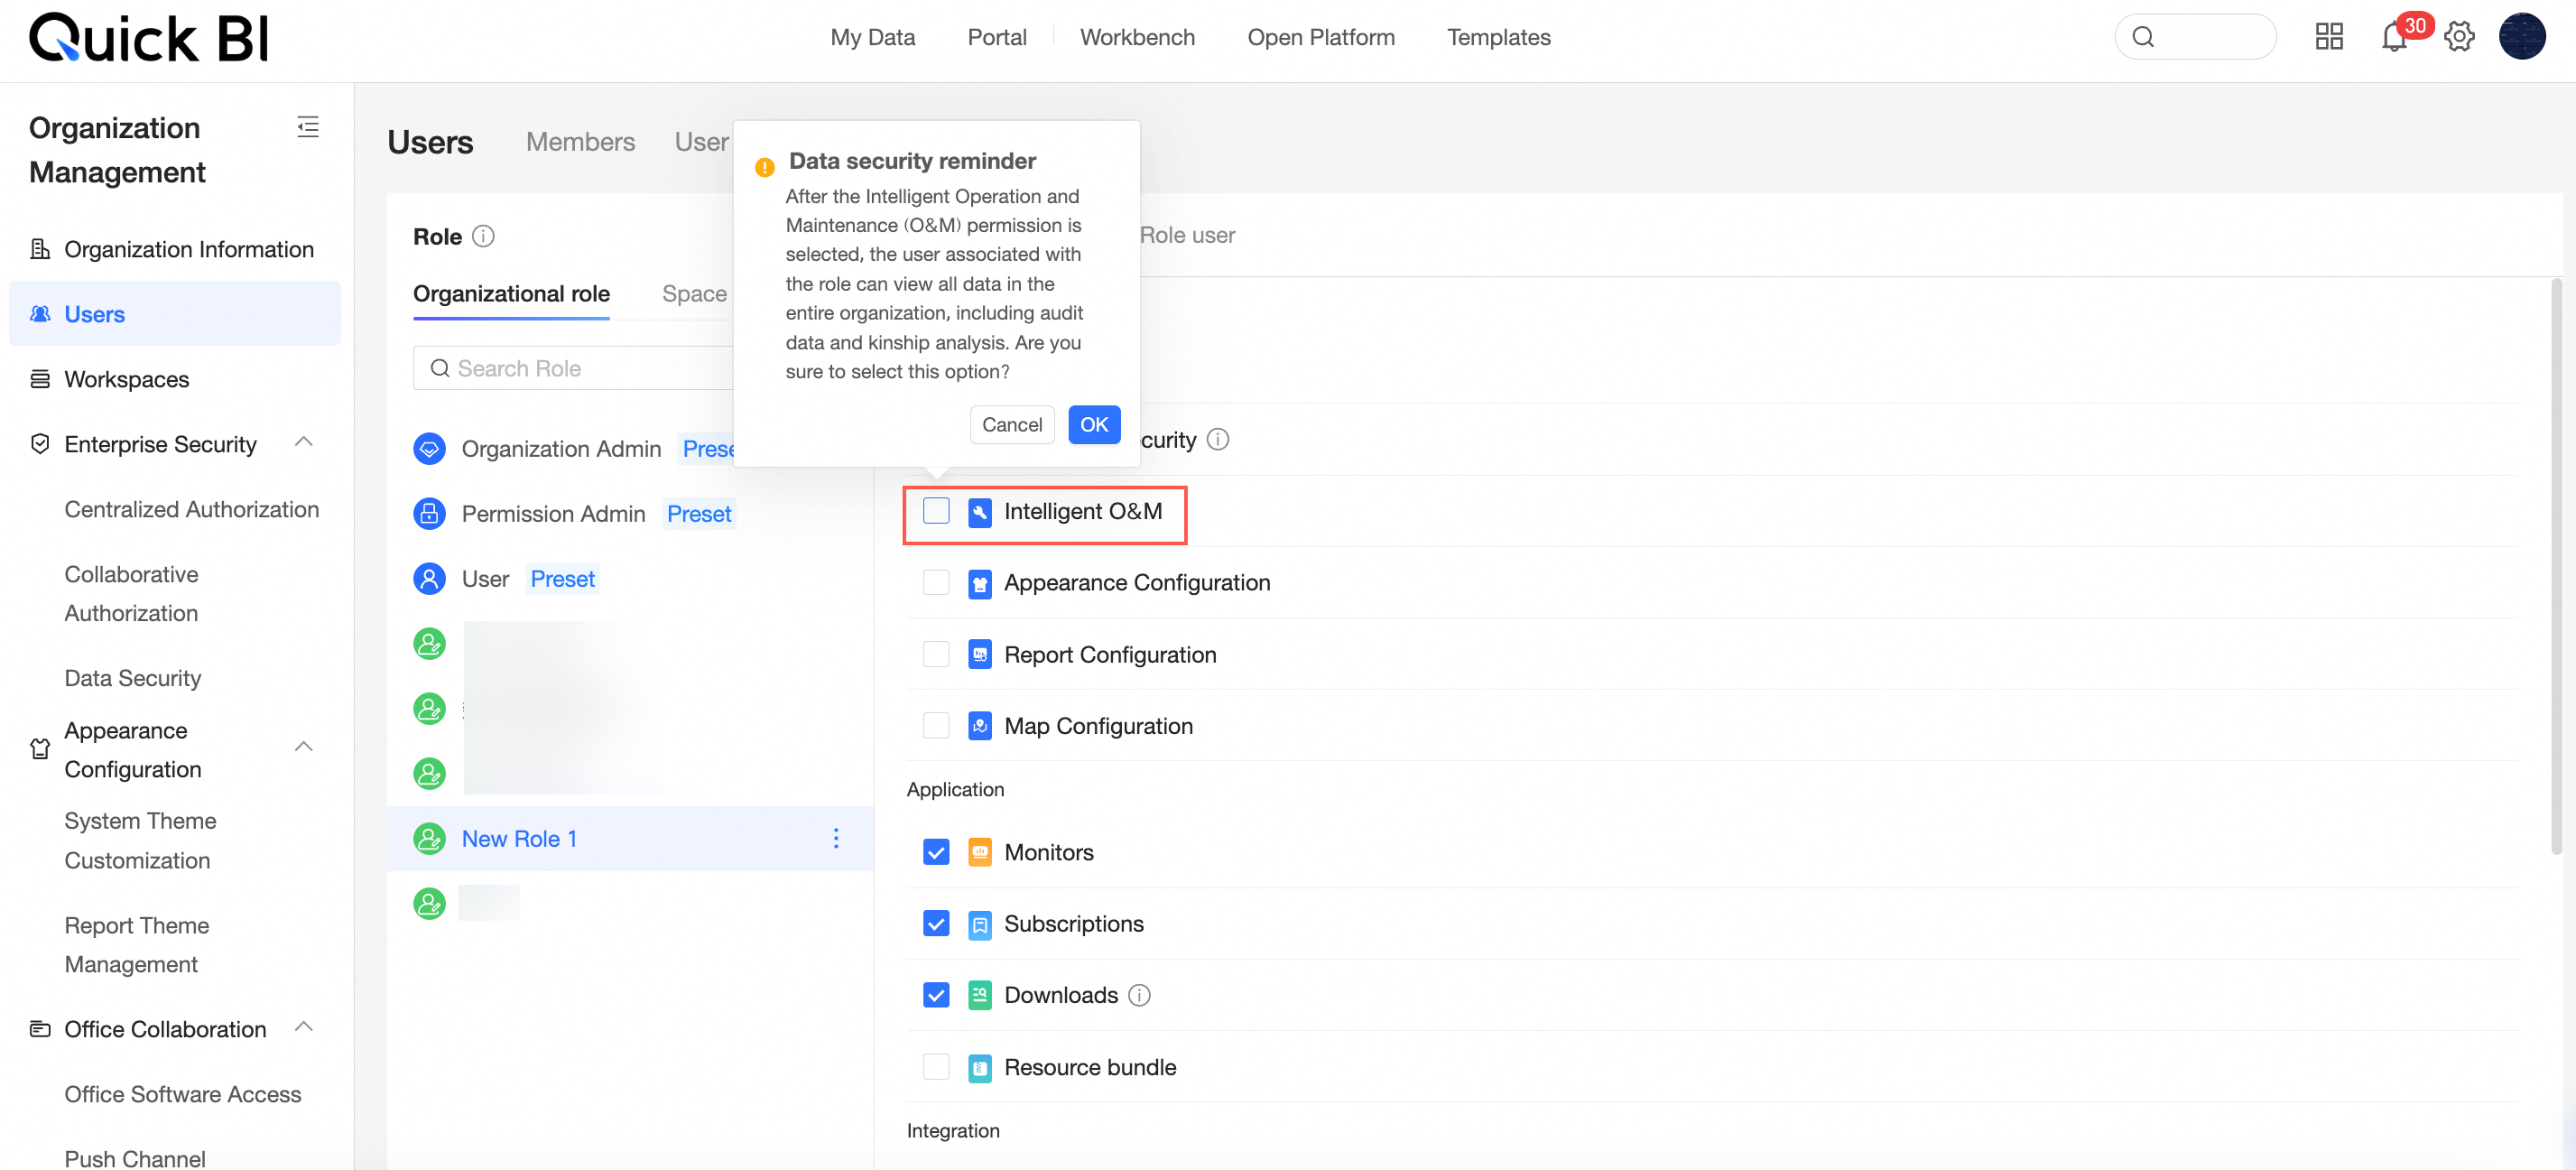 For more information, see role management.
Custom organization roles add three permission points for skin configuration, report configuration, and map configuration. The feature permission points have been organized and classified.
For more information, see role management.
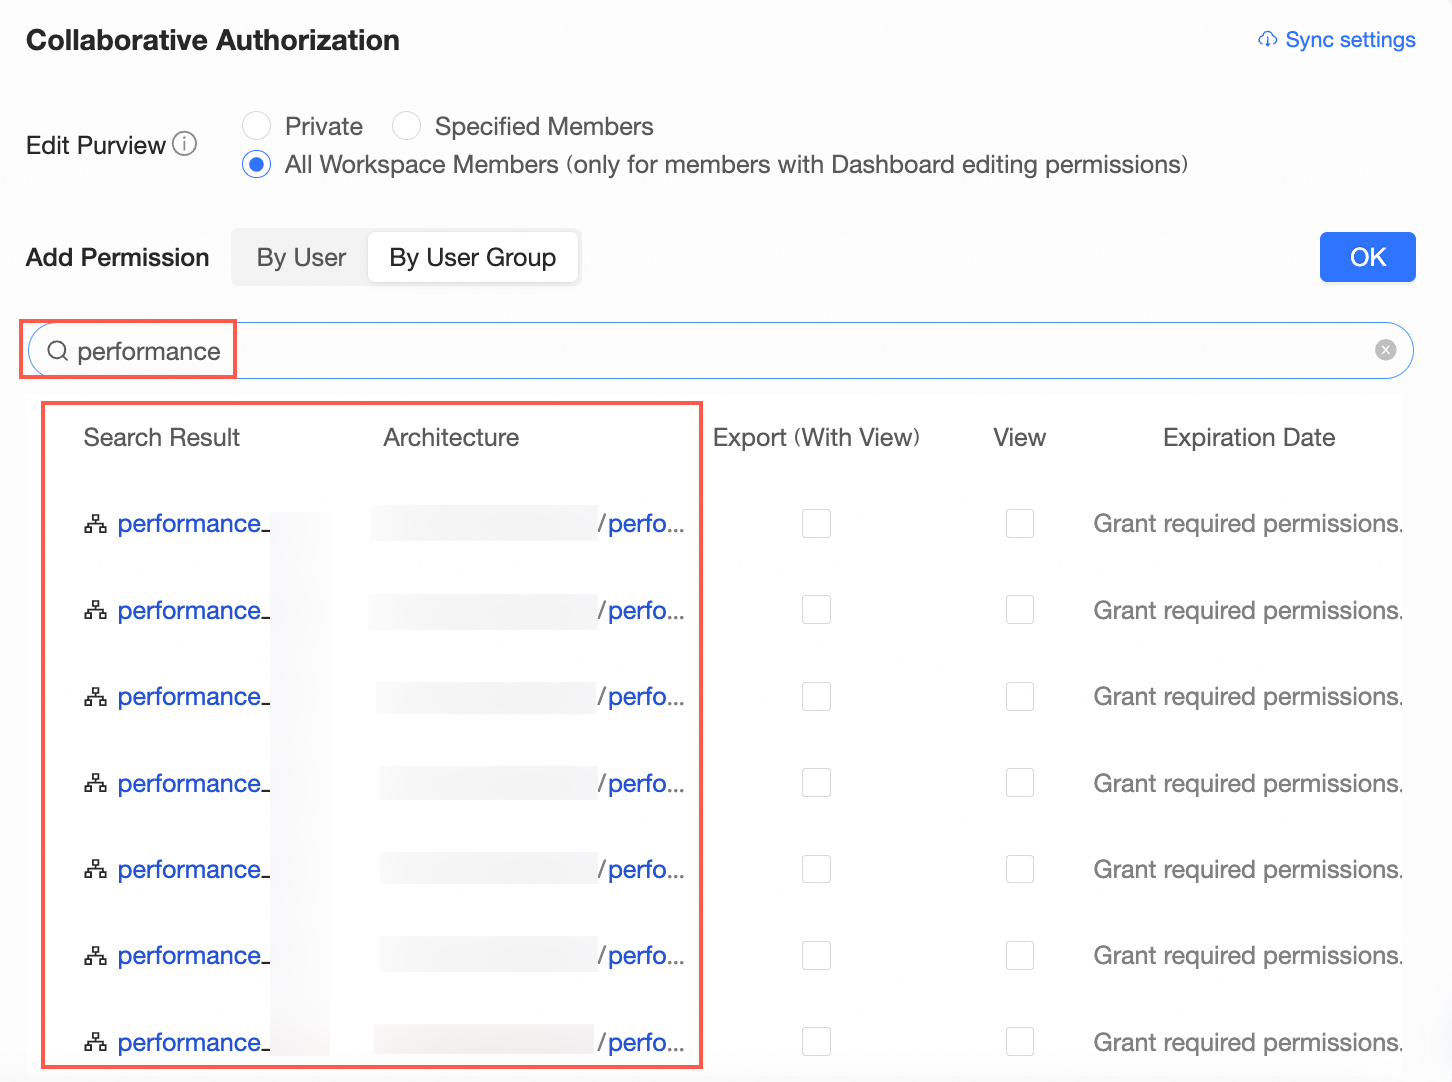
Collaborative authorization: HTML optimization for the user group search results page, with the addition of an architecture column.
Tennant management
Optimization of the interaction for removing tag tables. Removing a tag table will affect the use of related tags, and detailed prompts will be provided during the removal process.
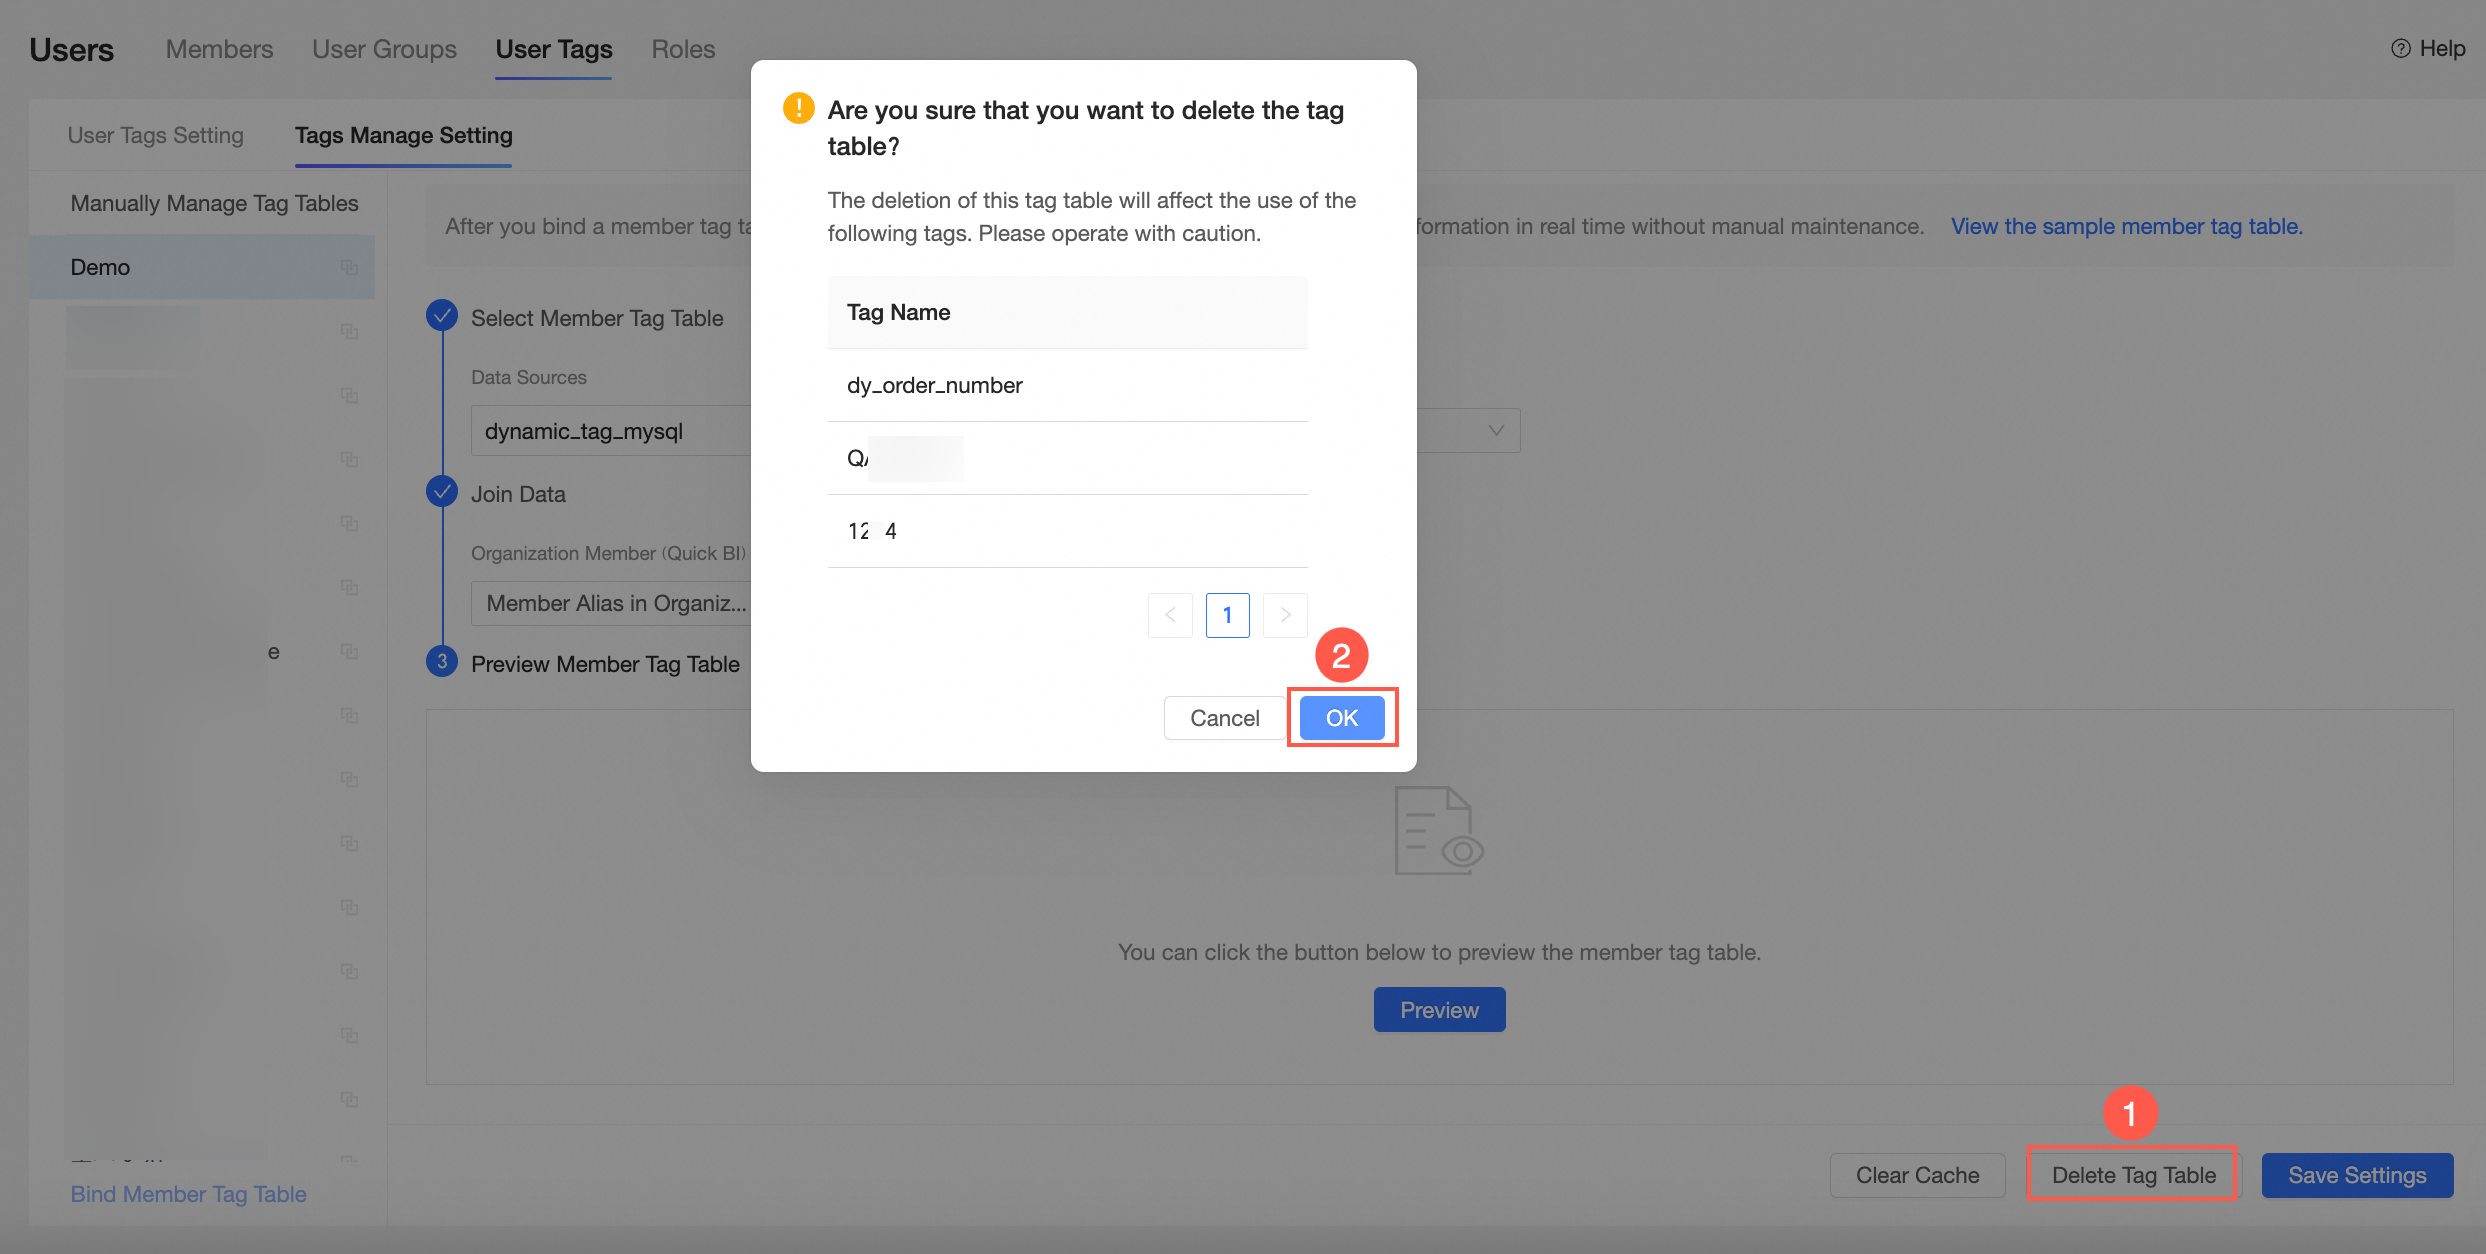
For more information, see manage user tag values.
The user group supports batch import of members.
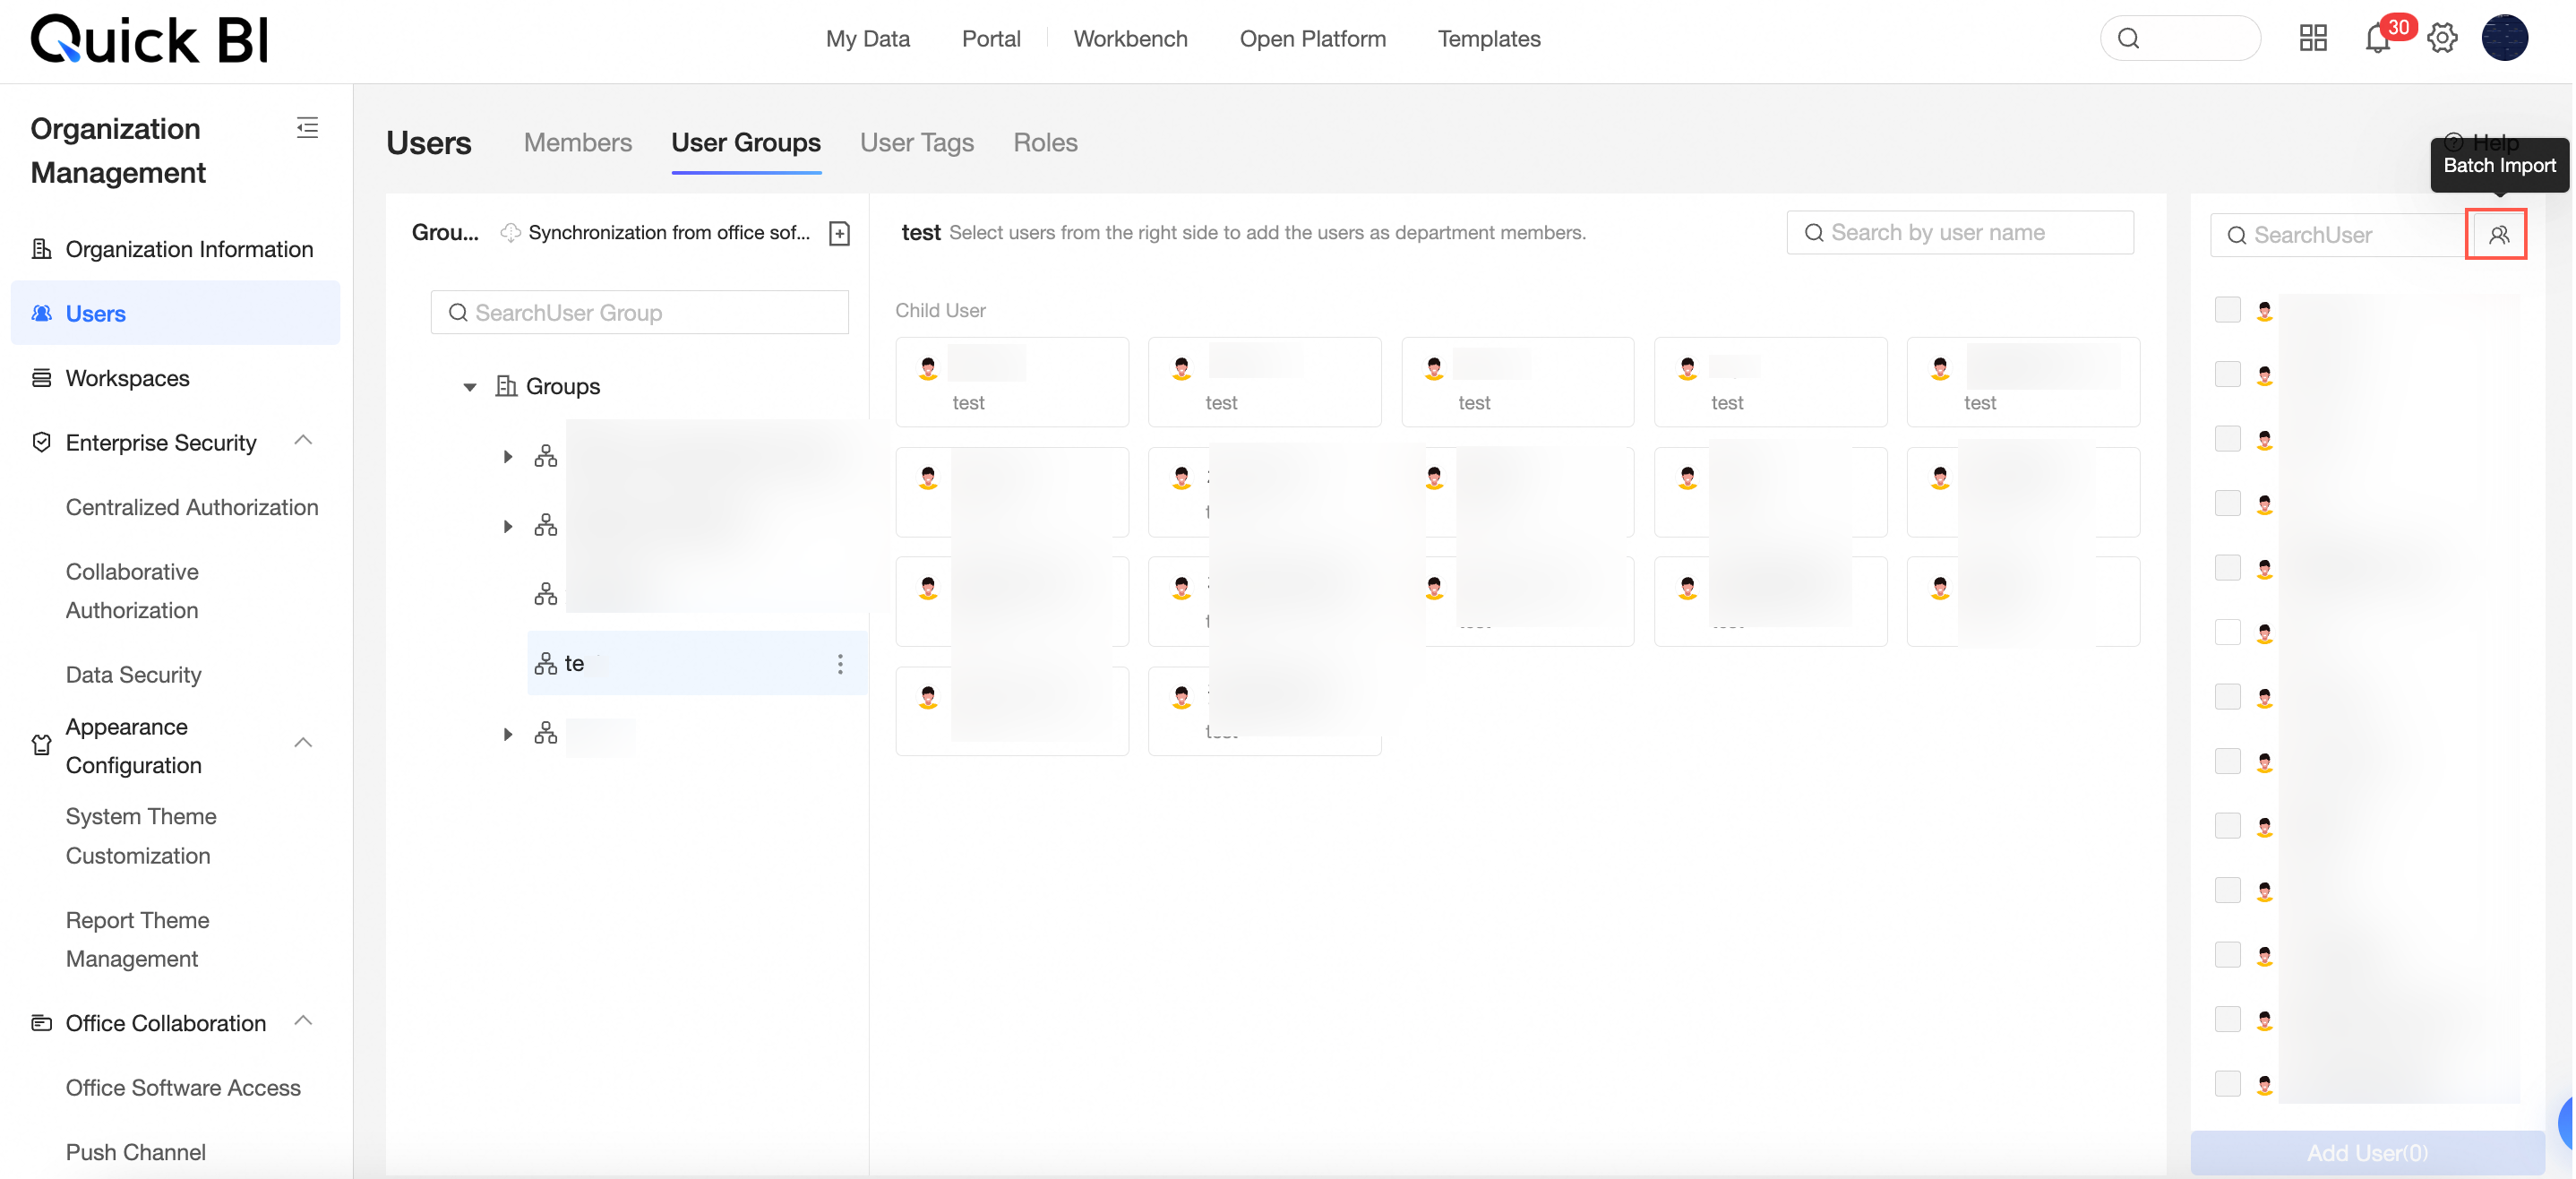
For more information, see create user group.
A new user type filter is added, which can be used on the user role management page to filter all users under the corresponding type.
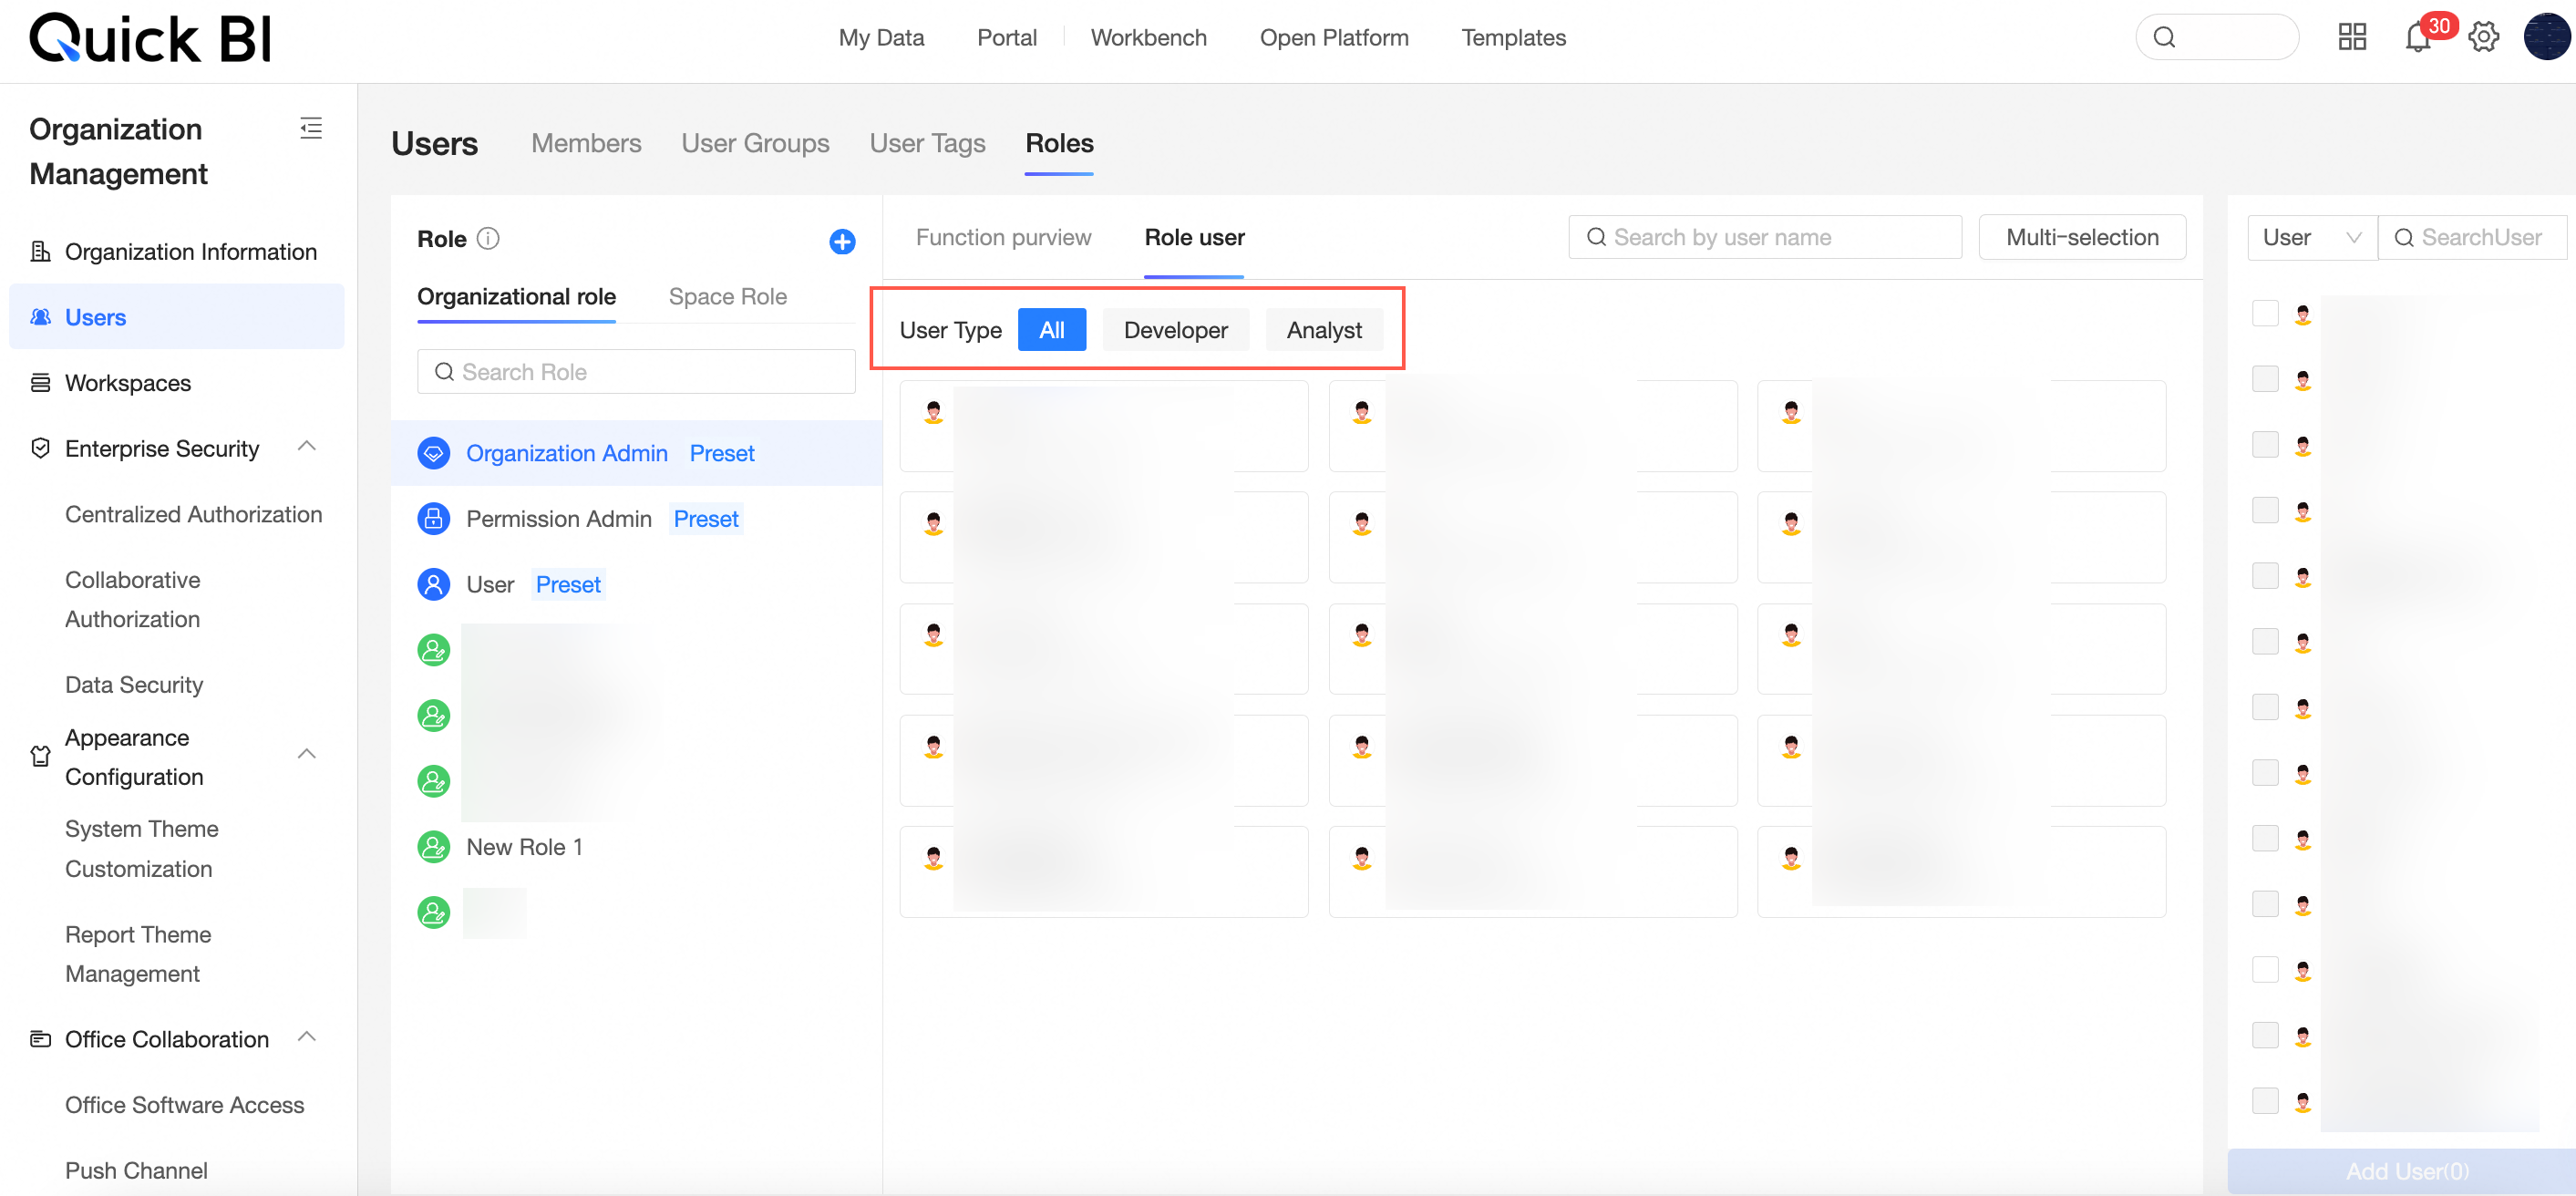
For more information, see role management.
Adjustments to the category of the organization management interface, including changes such as exporting controls being separately classified under the data security category.
Modifications to the organization management interface include reclassifying export controls under the data security category.
For more information, see export control or skin configuration.
When exporting user information in batches on the user management page, it supports exporting user status information.
For more information, see manage organization users.
Artificial intelligence for IT operations
Added health inspection feature. By providing white-screen operation and maintenance capabilities, you can understand the threats and optimization items within the organization and provide reasonable suggestions to achieve self-service operation and maintenance.
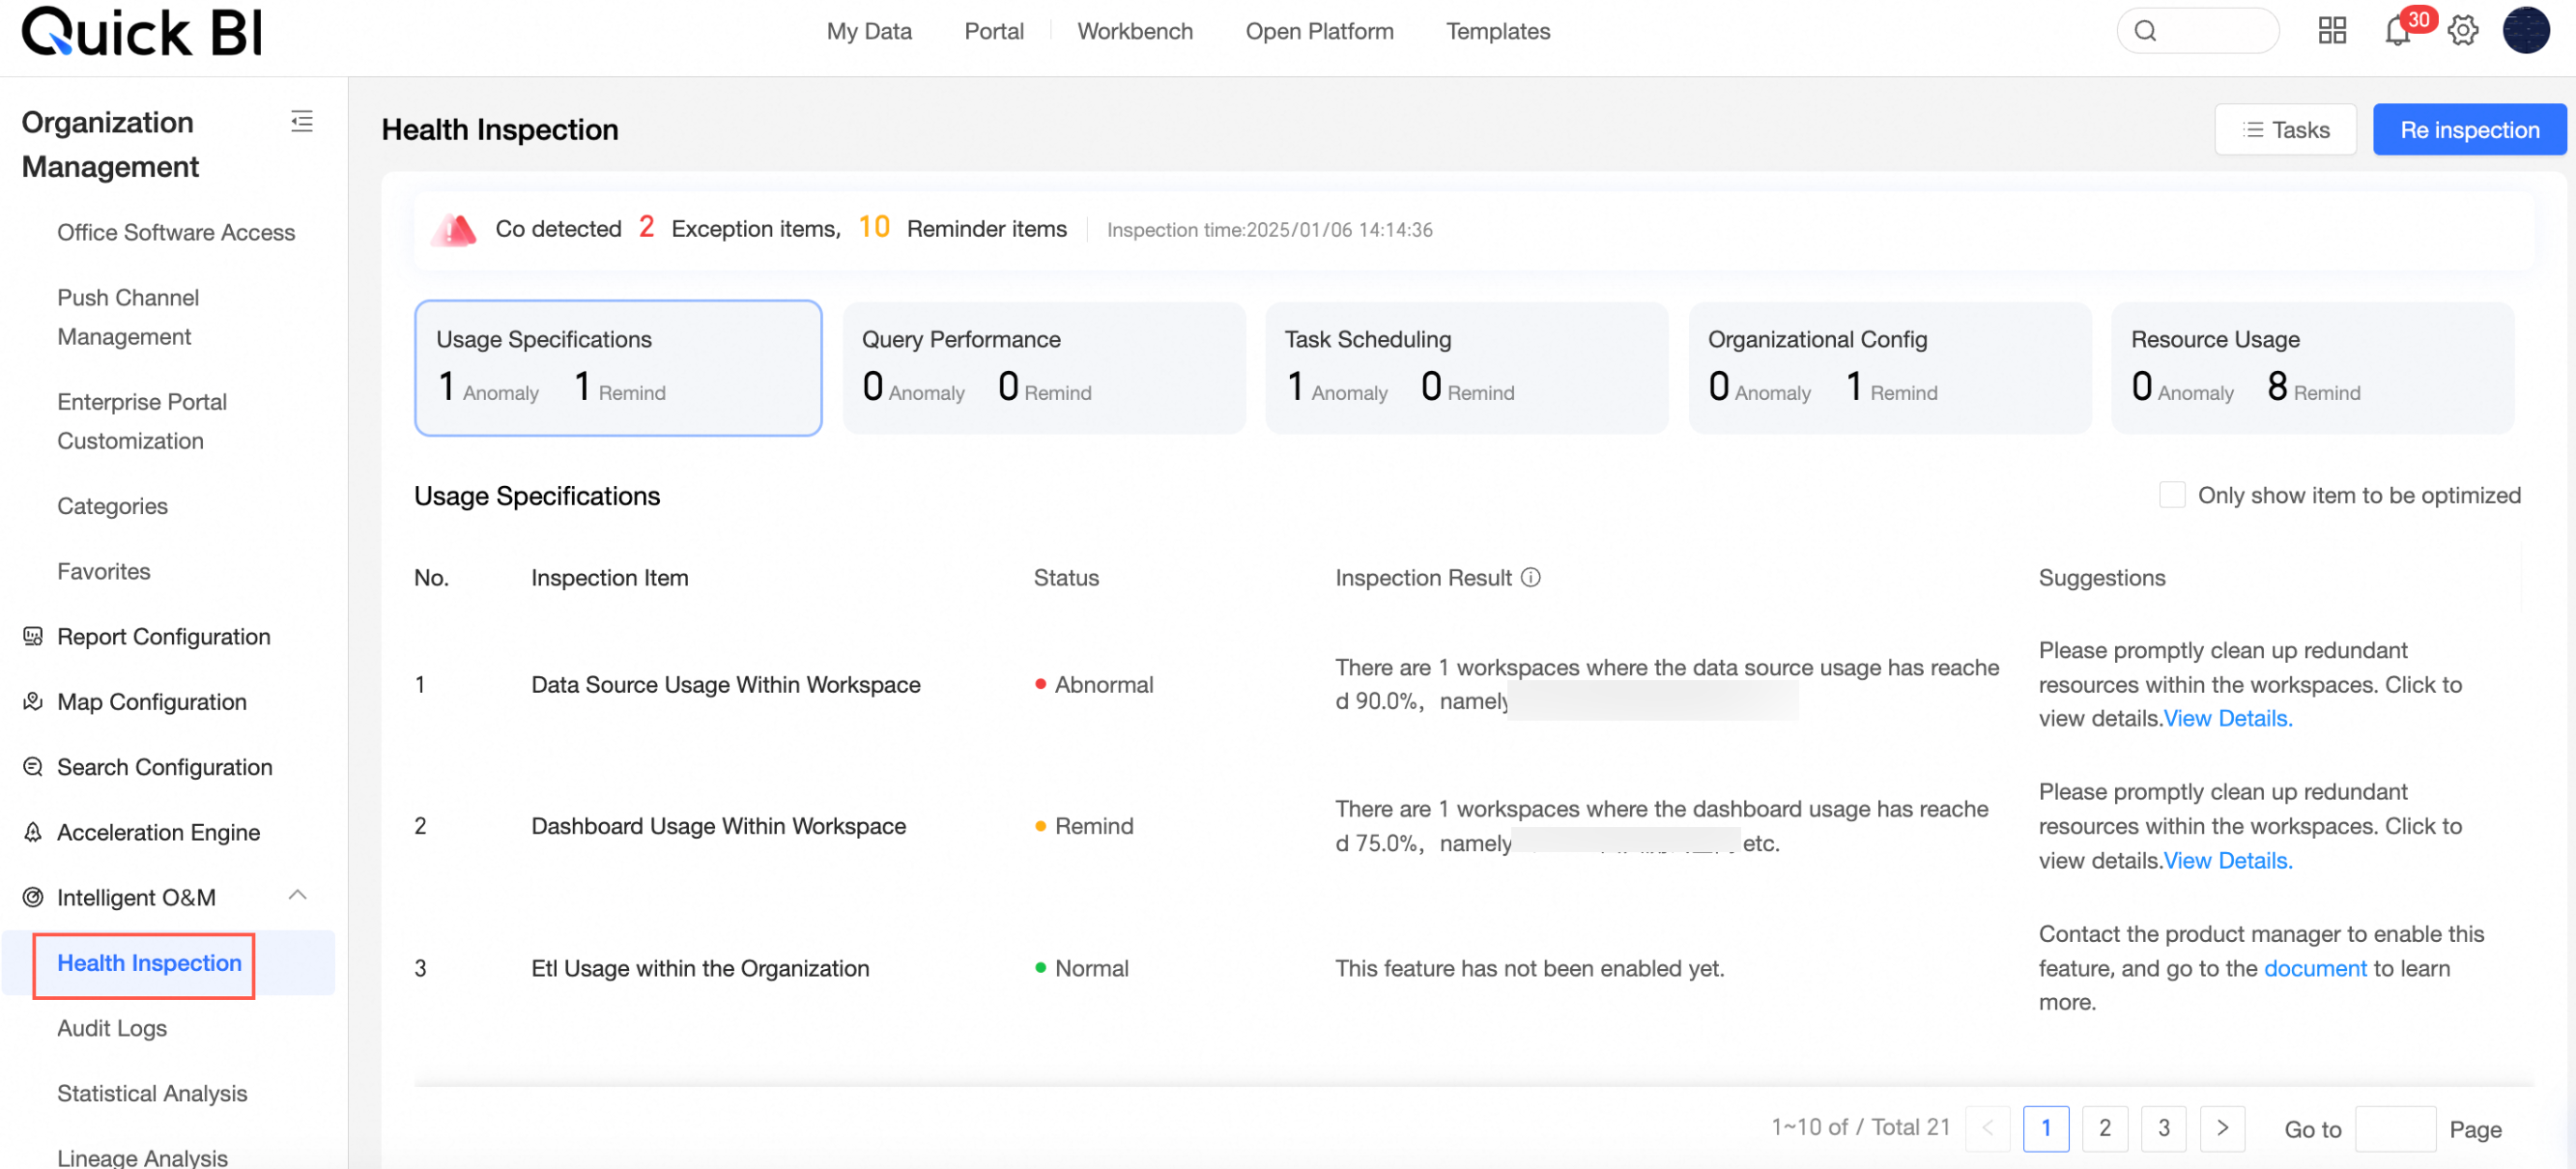
For more information, see health inspection.
Added report-level statistical analysis to help you better understand the operation of your developed works within the entire organization.
For more information, see access analysis.
Independent audit log page setup supports viewing audit logs of logon, access, operation, and permission types. Access audit logs have added fields for access device and access source. The sharing types in permission audit logs are subdivided.
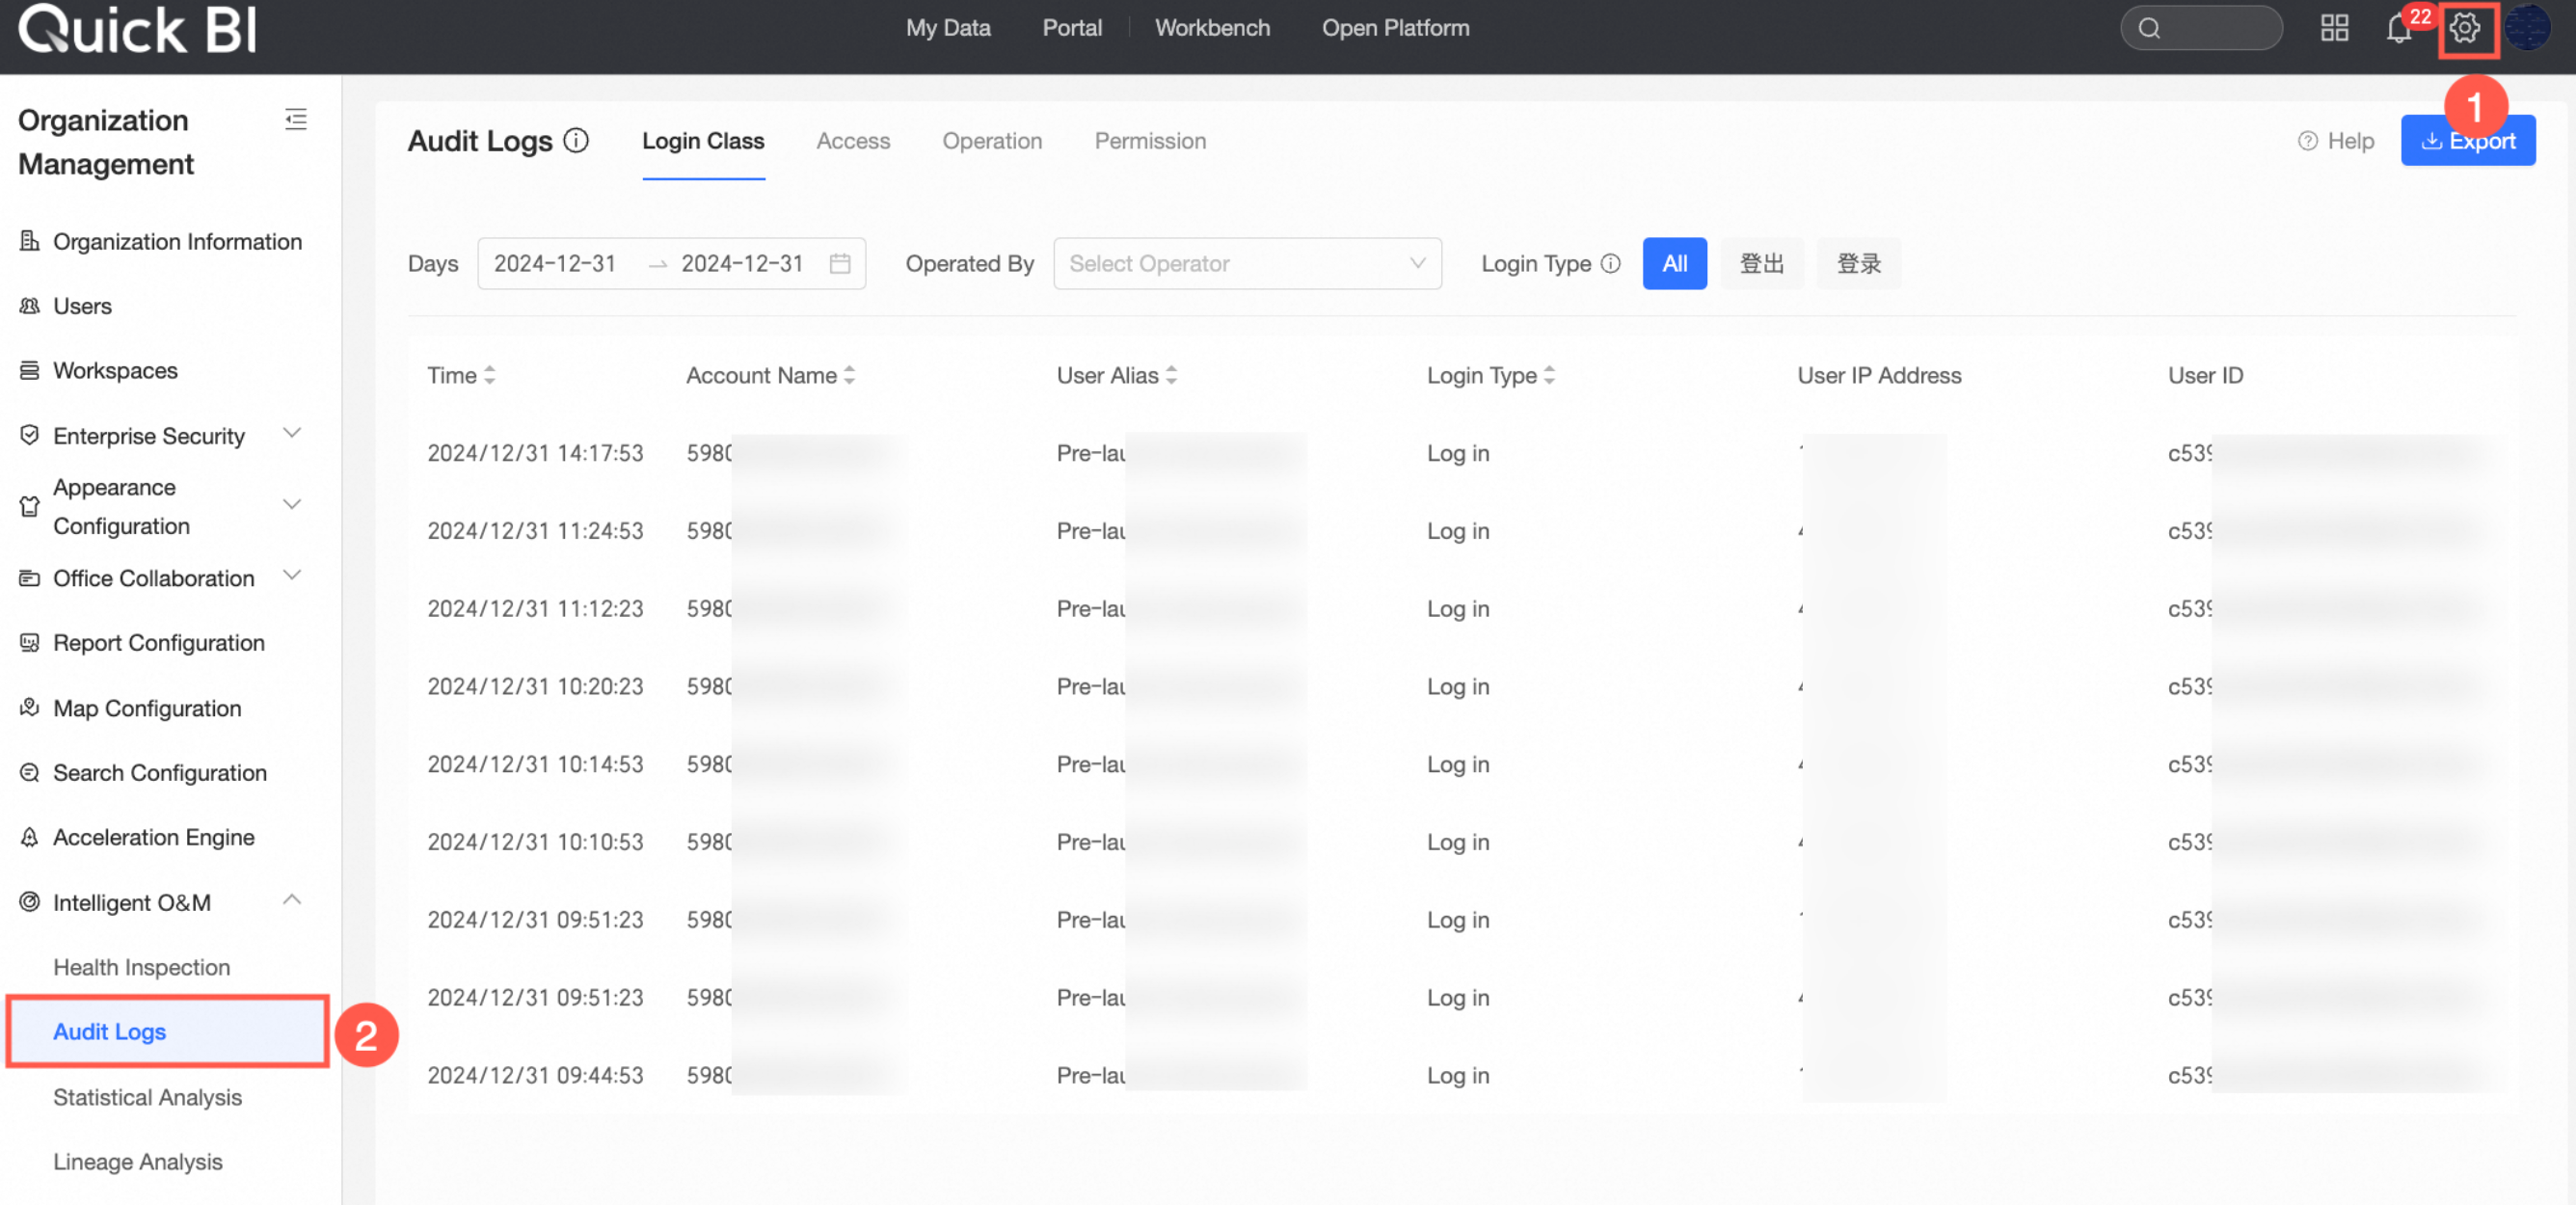
For more information, see audit log.
The statistical analysis interface has been revamped and is divided into two modules: usage analysis and access analysis. Usage analysis is used to analyze the usage of resources within the organization. Access analysis is used to analyze user access data.
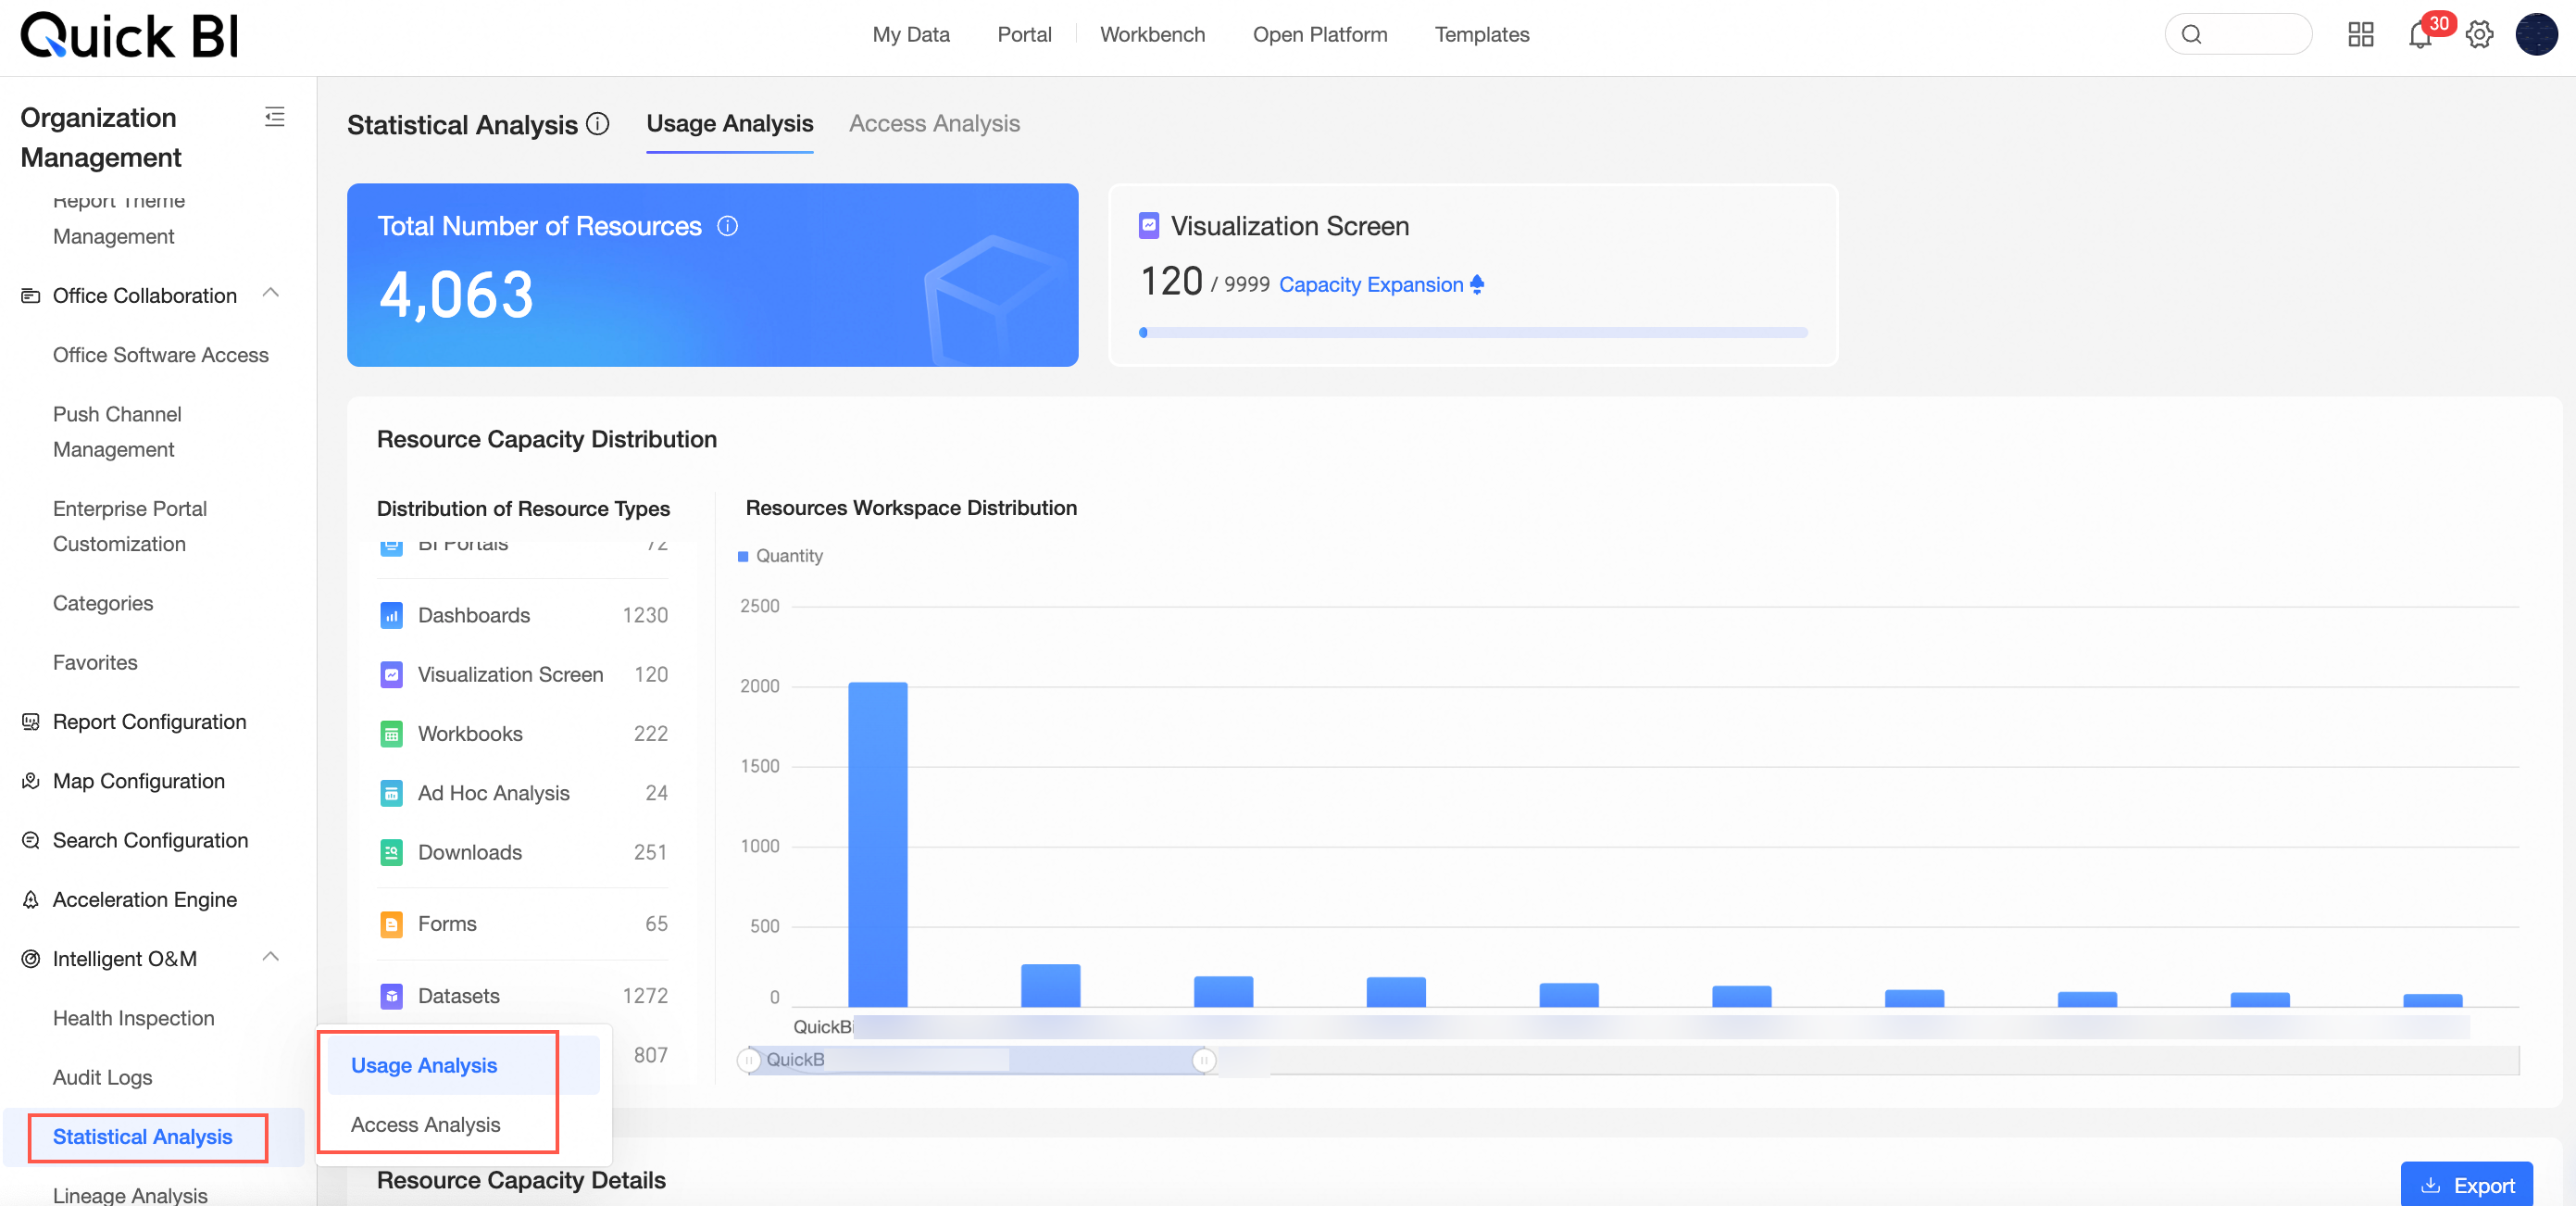
For more information, see usage analysis and access analysis.
Optimized statistical analysis capabilities, supporting the download of operation type comparison tables in audit logs and access analysis.
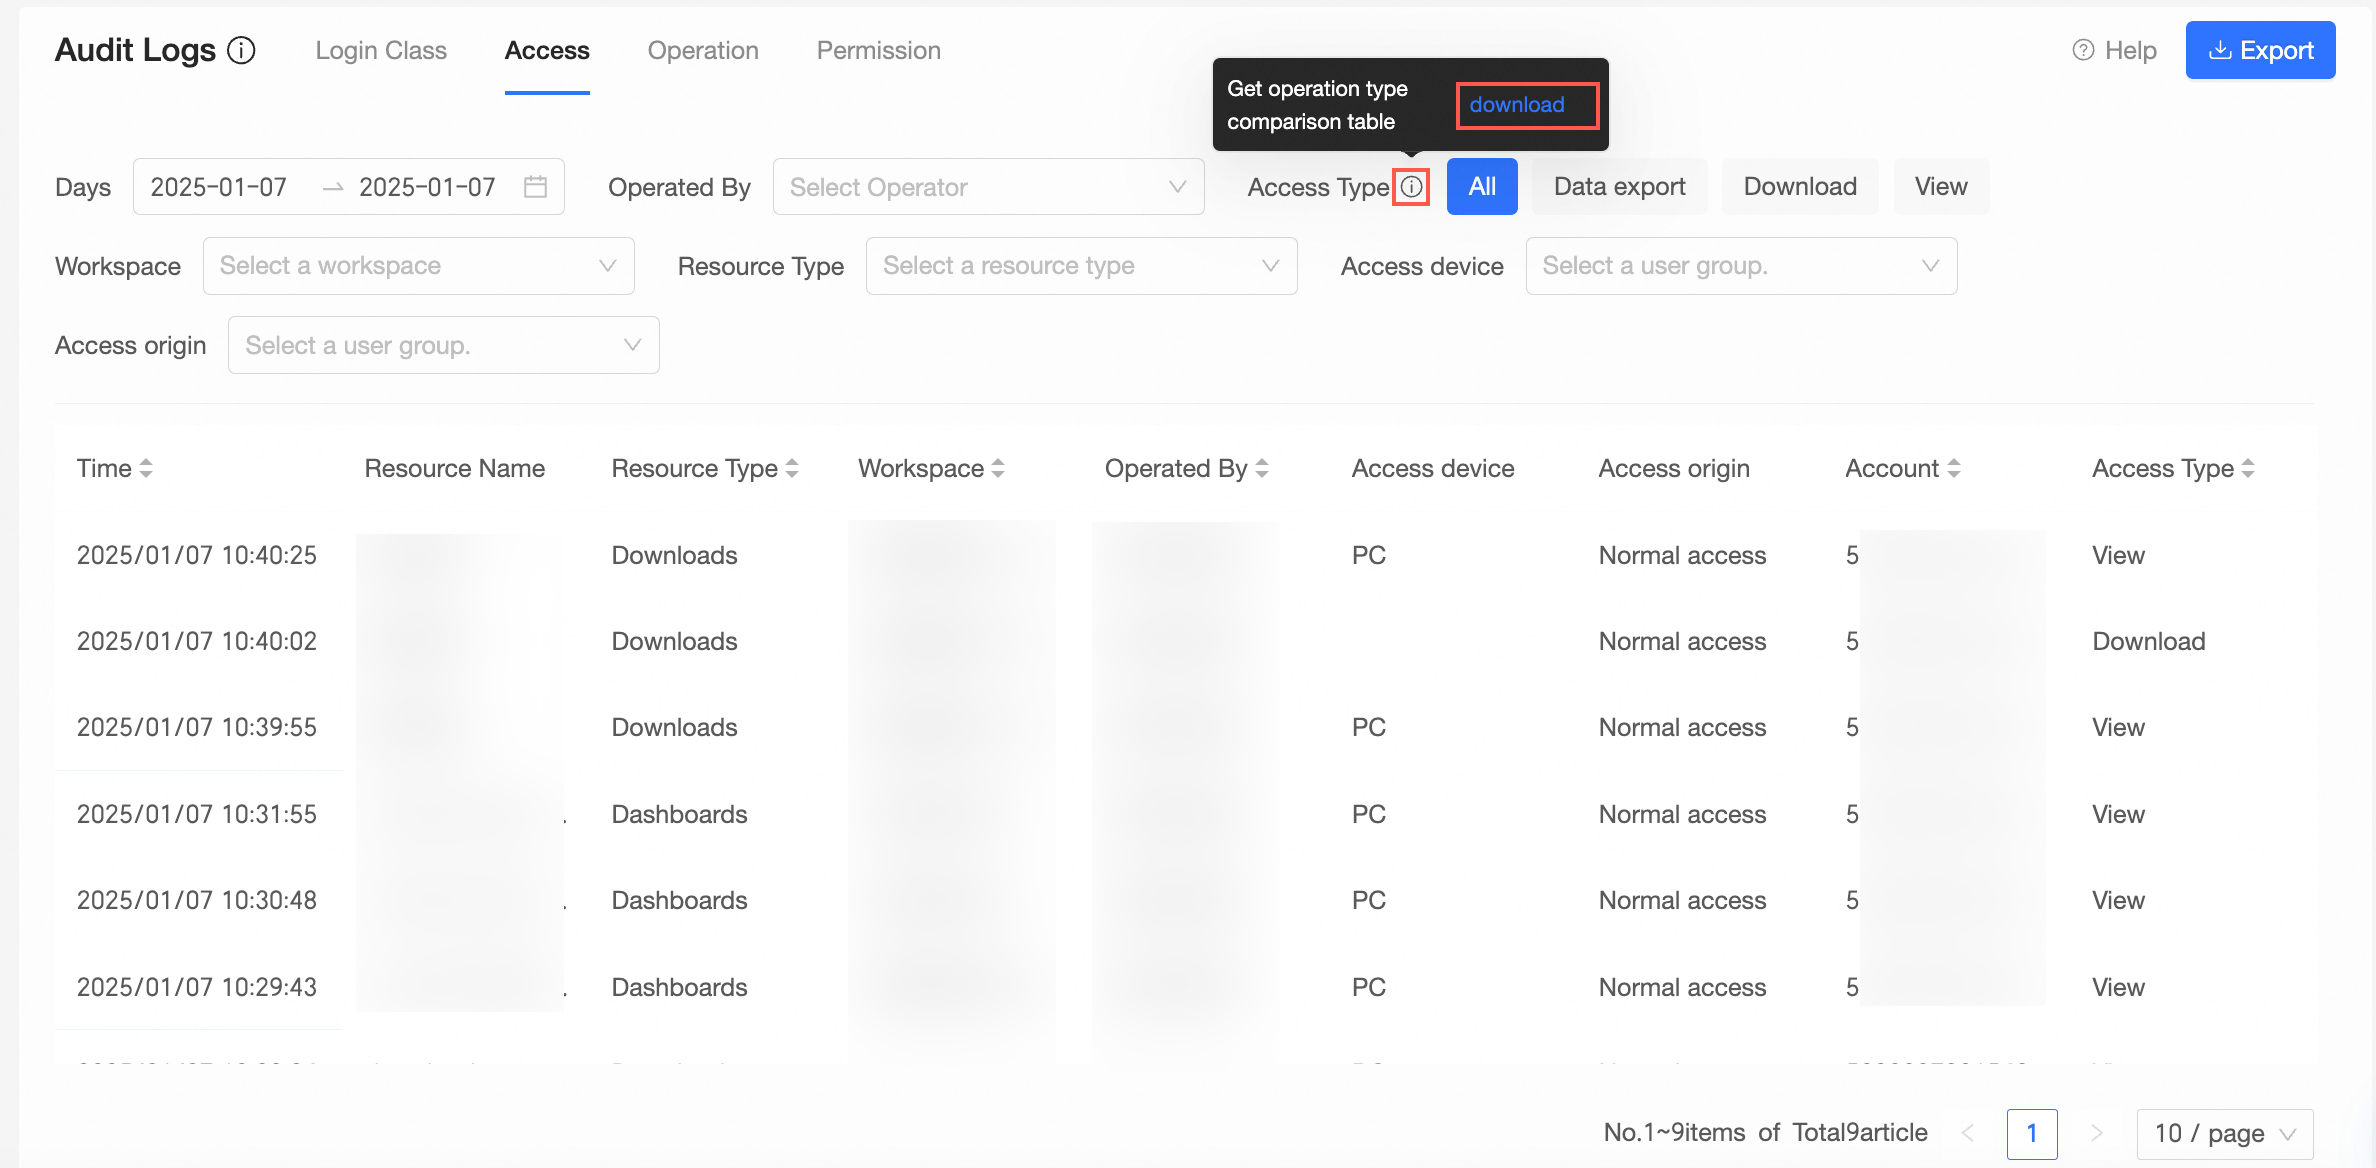
For more information, see audit log and access analysis.
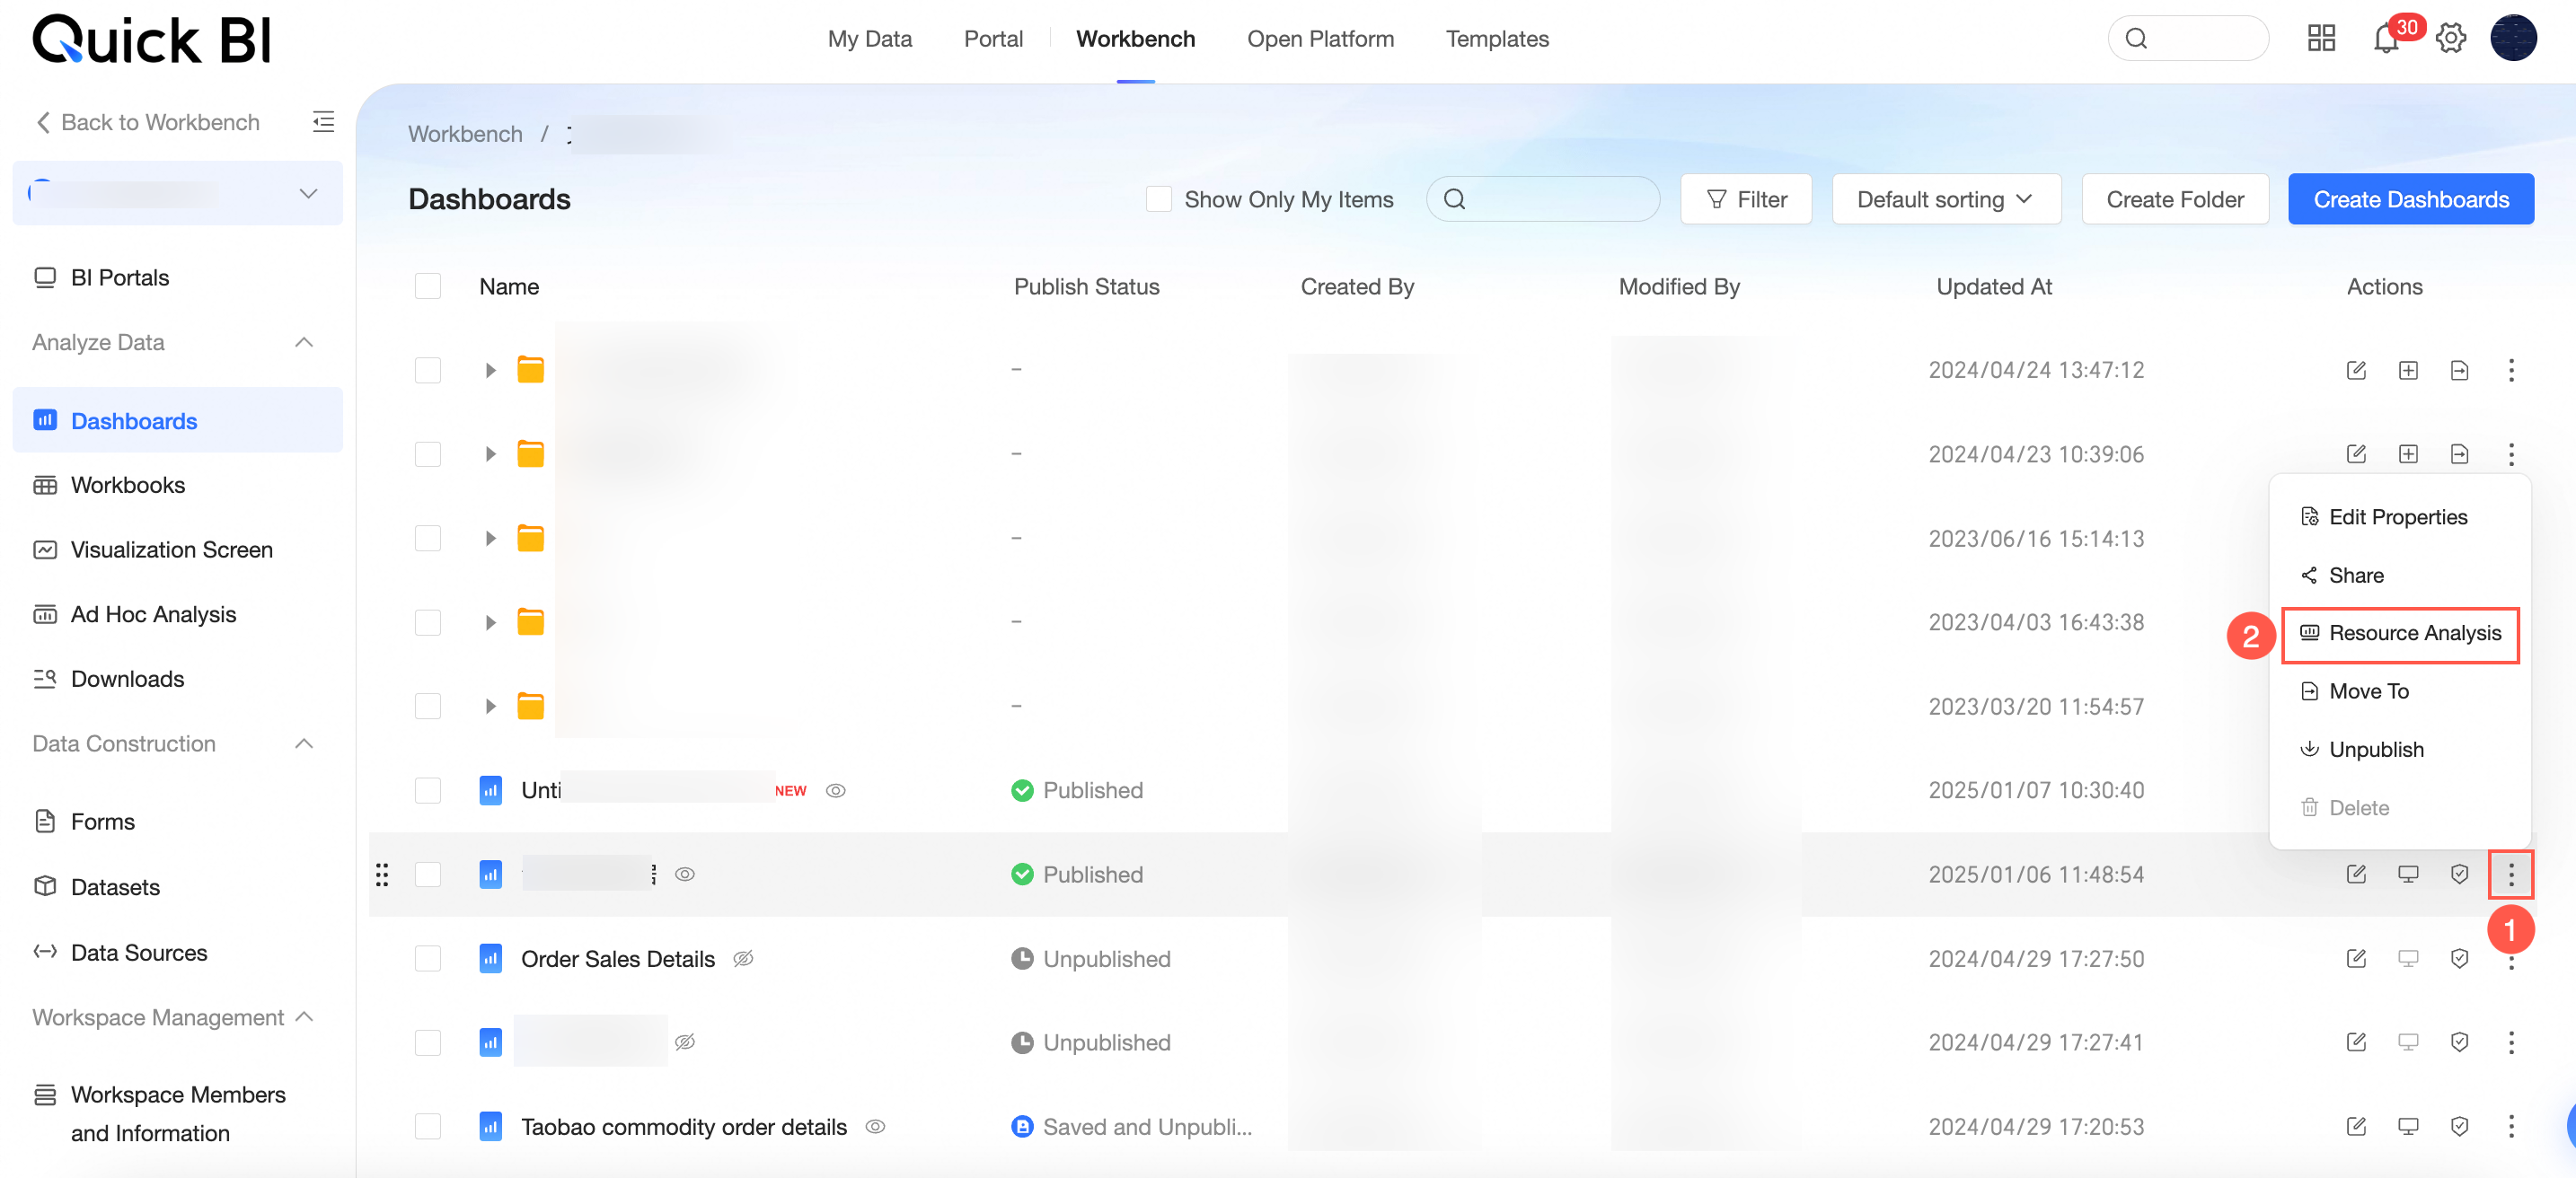
Kinship analysis supports exporting data lineage in graph analysis pattern.
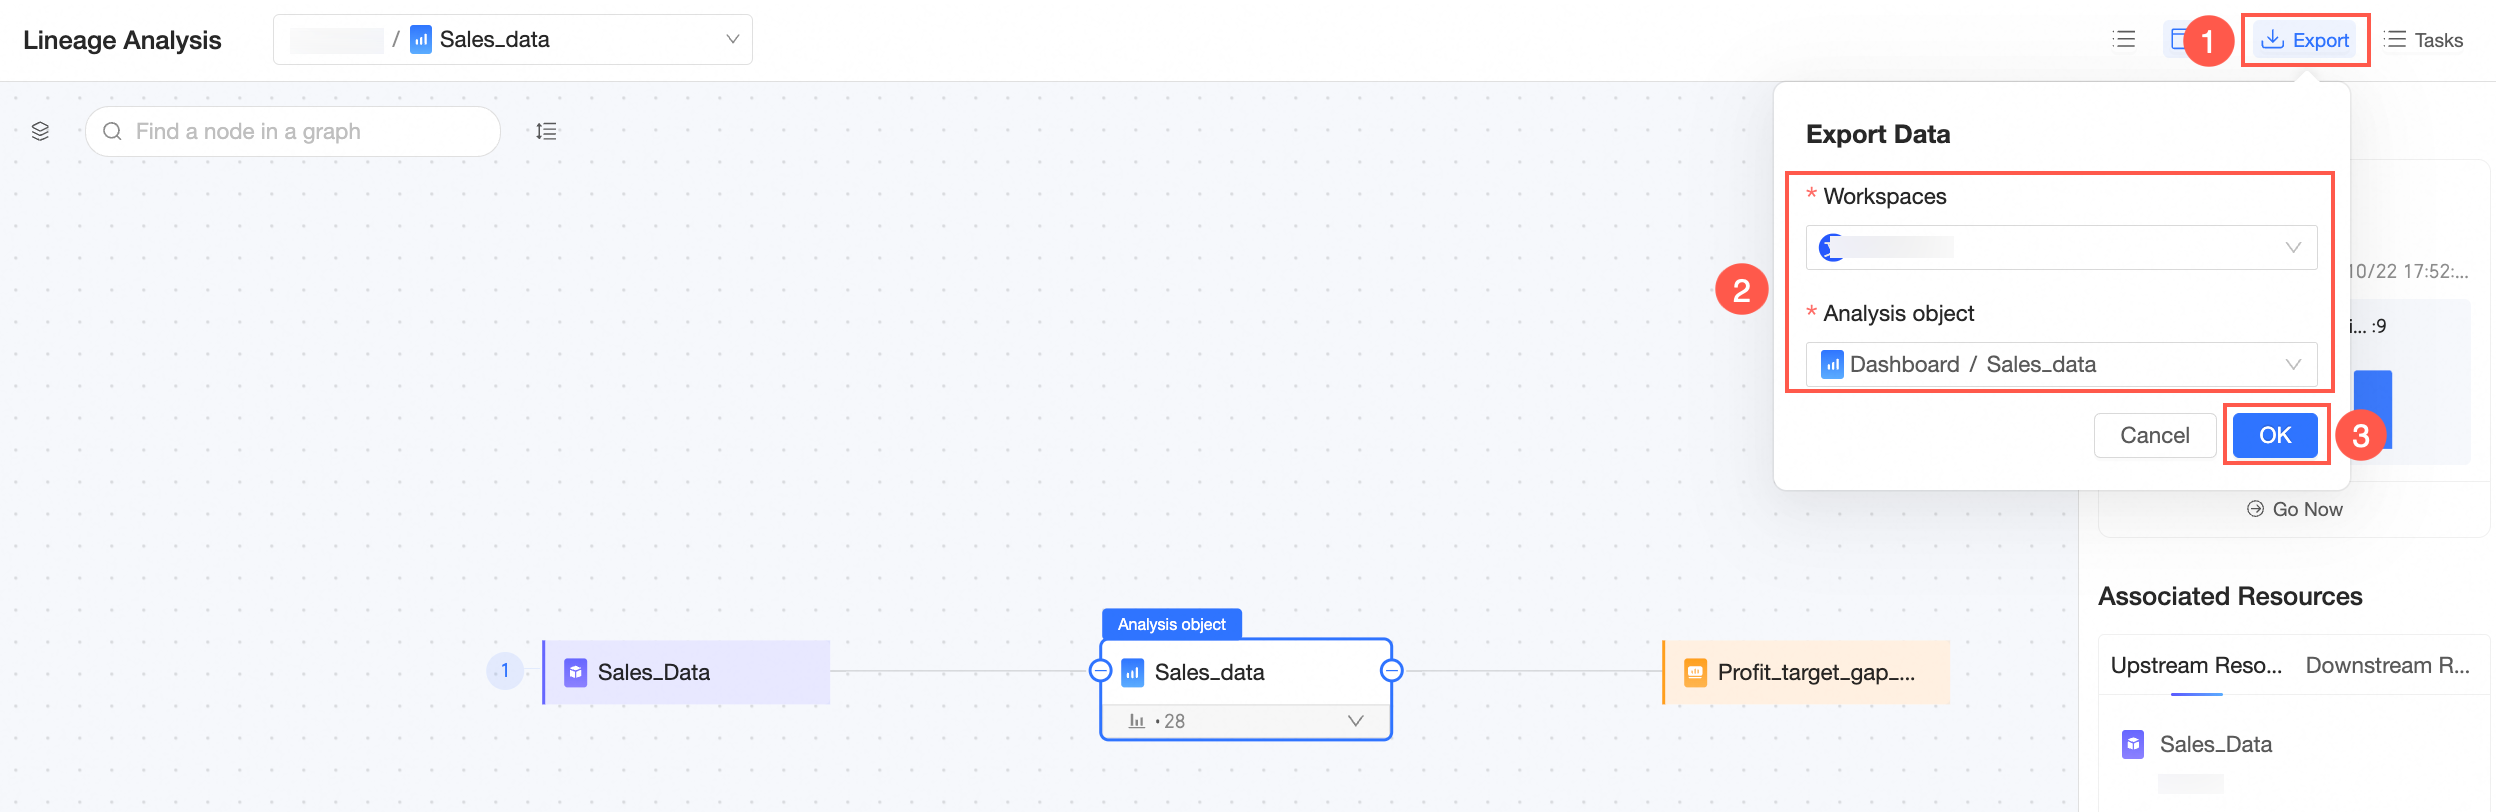
For more information, see kinship analysis.
Workbooks and data dashboards support performance diagnostics.
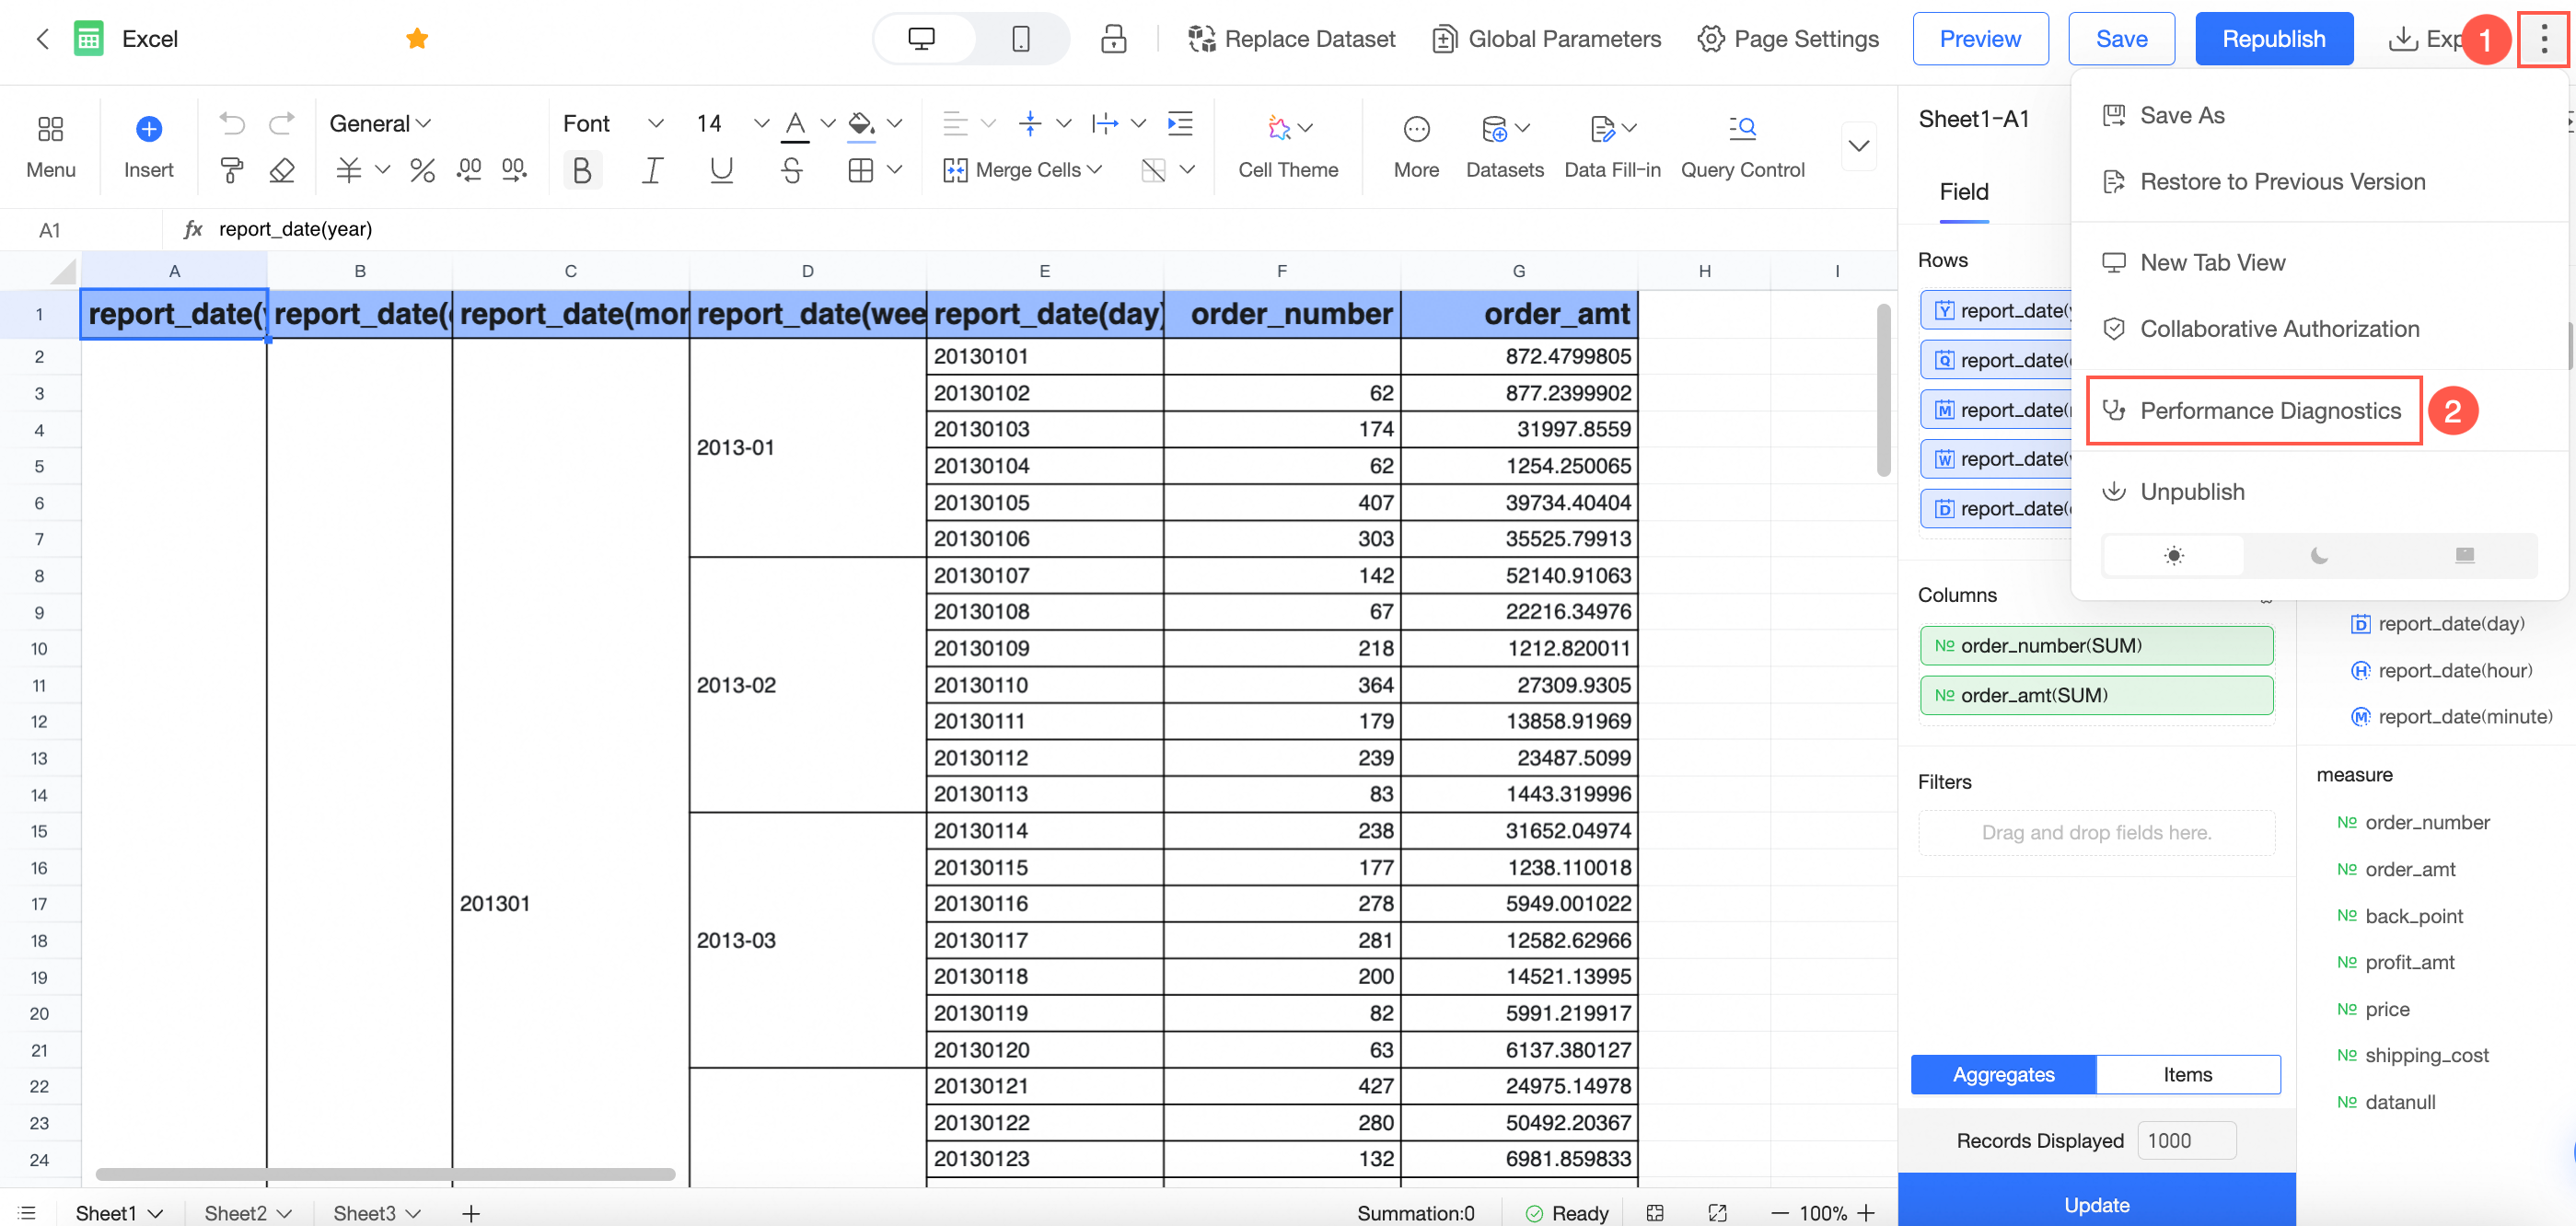
For more information, see performance diagnostics.
To ensure product performance and system stability, some usage specifications have been added.
For more information, see specification details.
Open platform
Support granting specified users API call permissions through Resource Access Management.
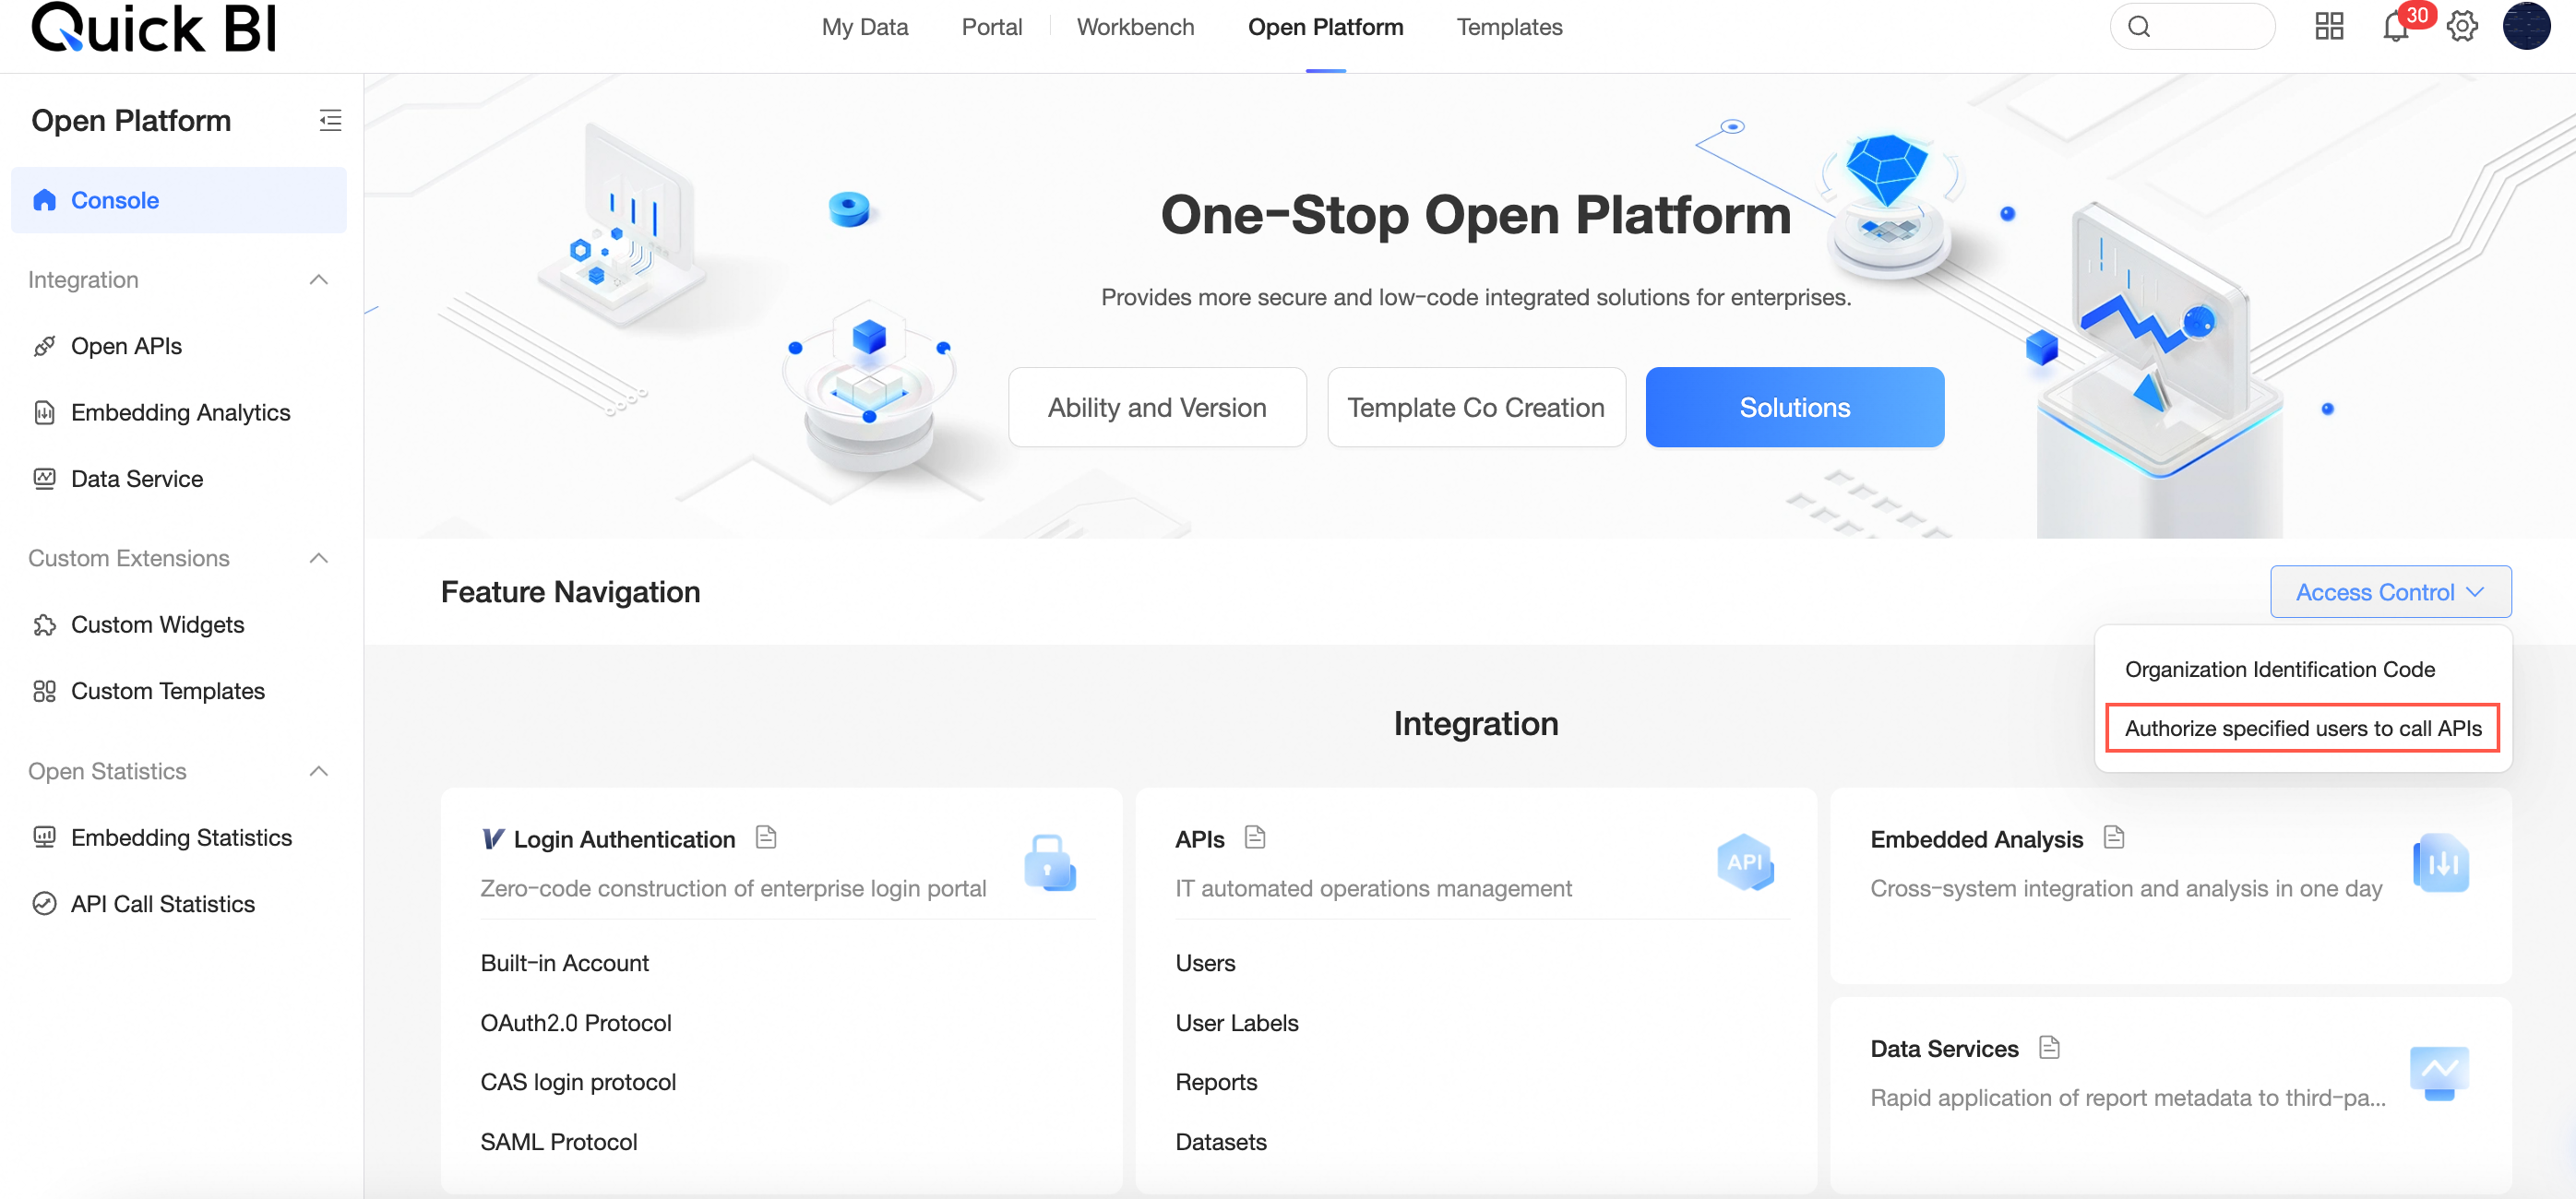
For more information, see Resource Access Management.
Separate the report embed statistics from the API call statistics pages, and enhance various display and interaction details for an improved experience.
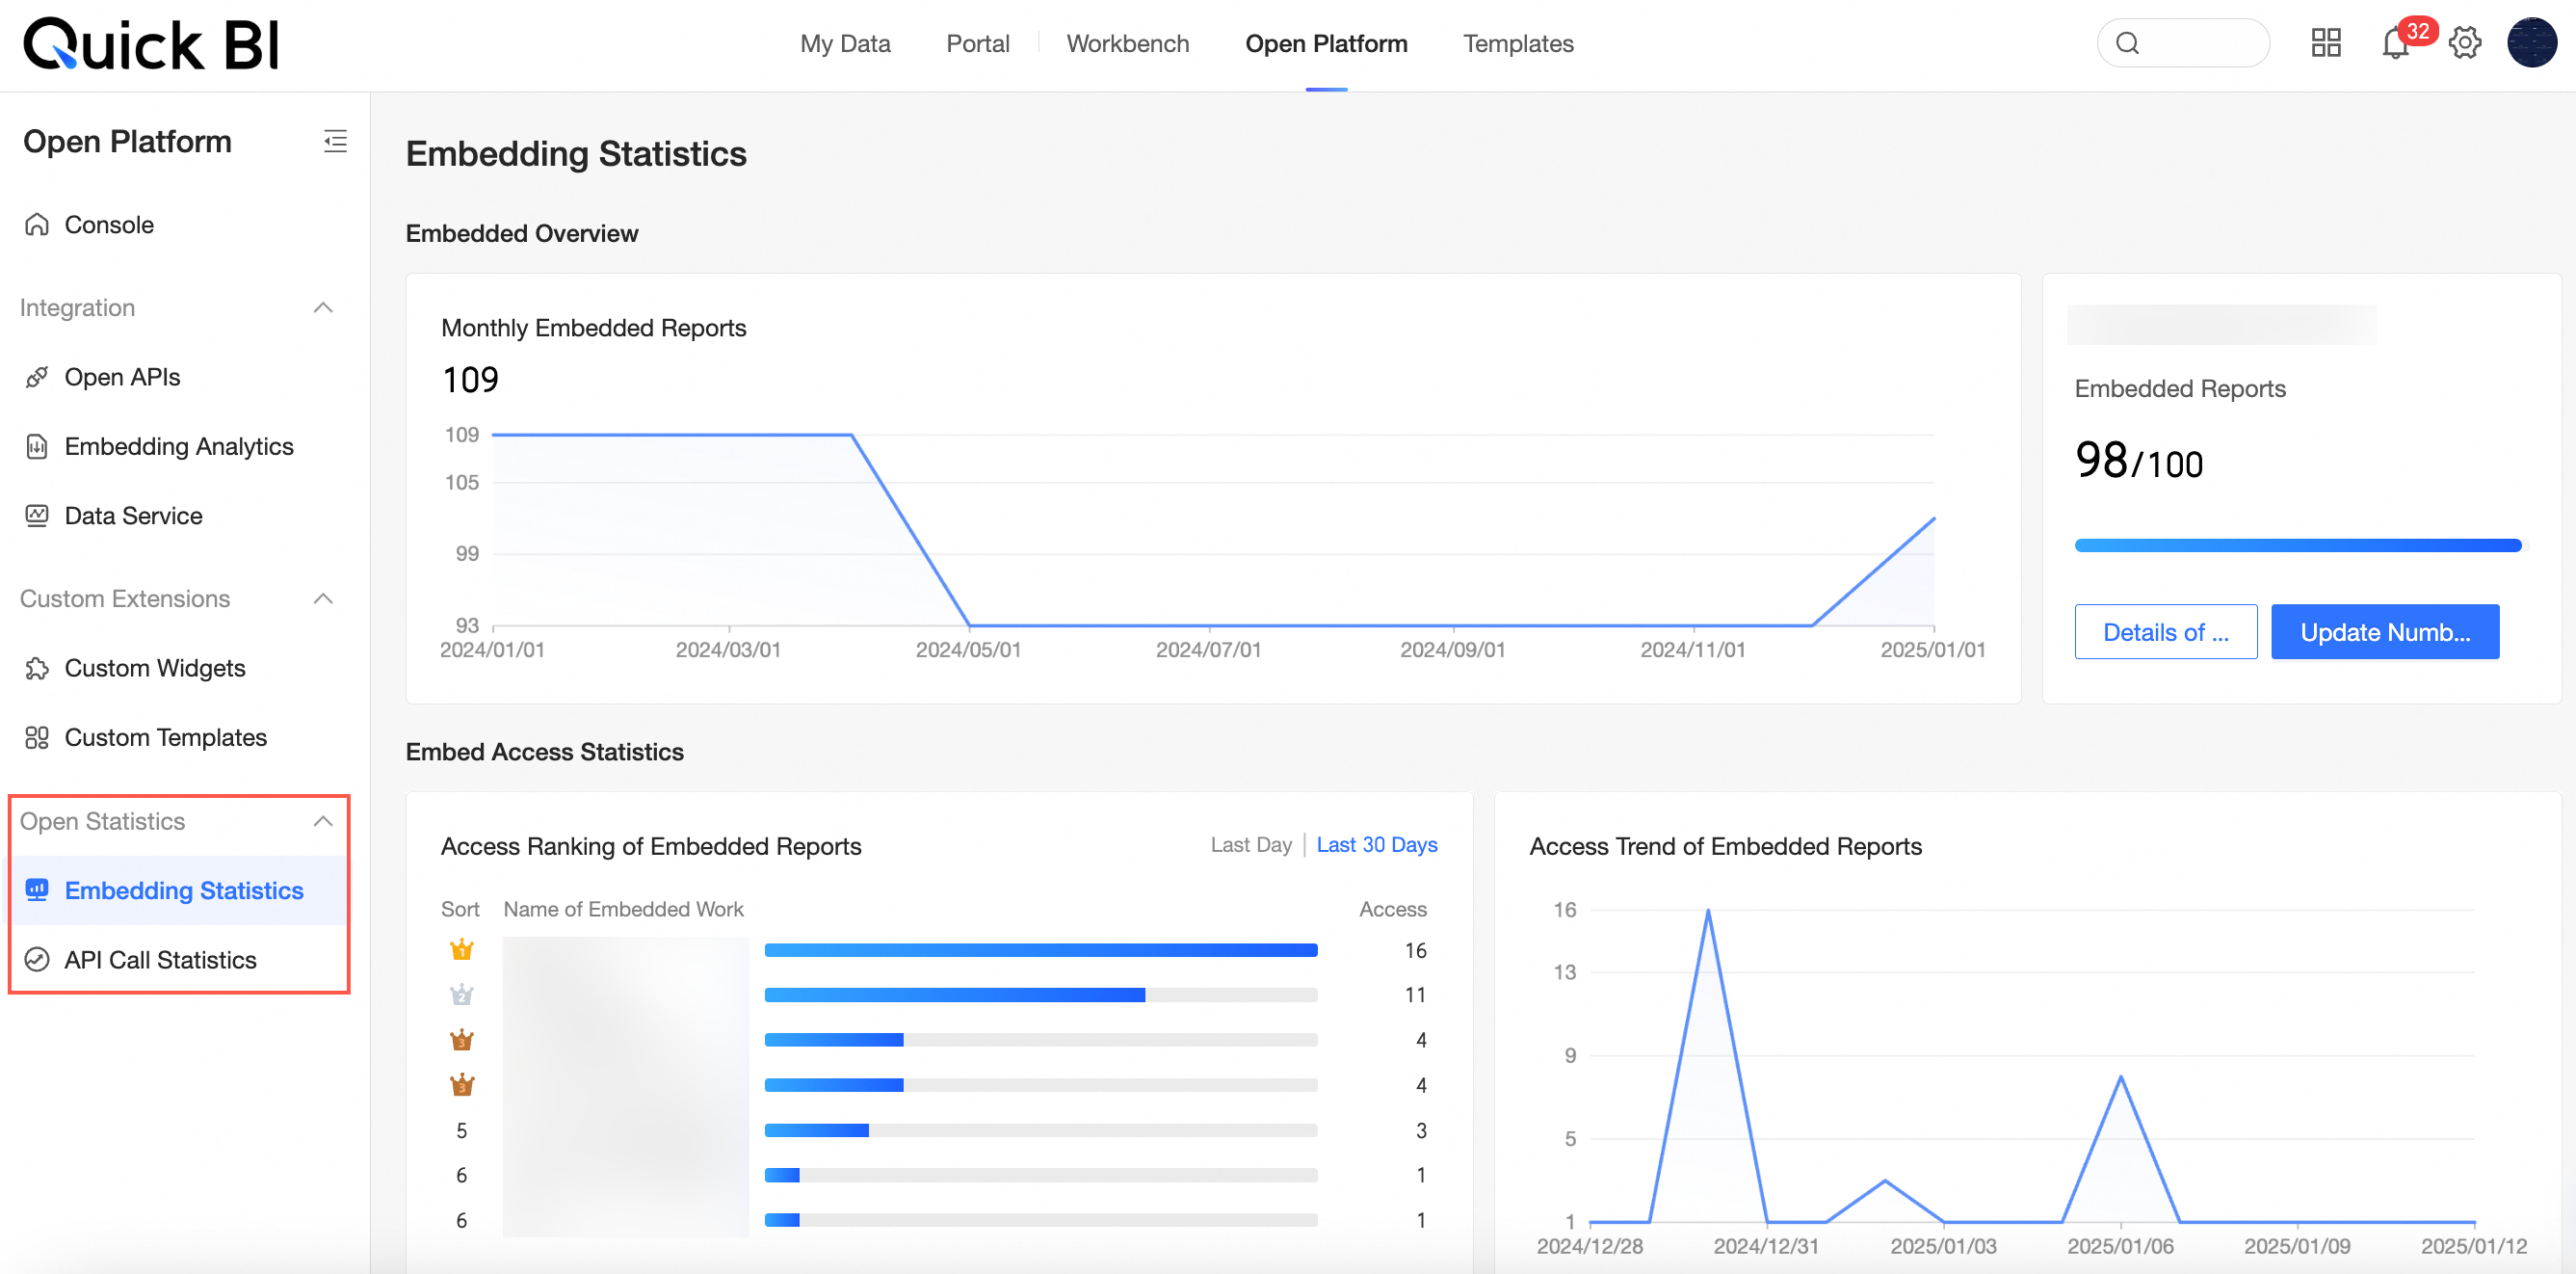
For additional details, refer to Report Embed Statistics or API Call Statistics.
Optimize the demo component flow for adding custom widgets. The demo component can be debugged online.
For more information, see Manage Custom Widgets.
Add specifications limit for the number of custom widgets.
For more information, see Specifications Details.
Optimize the icon for showing/hiding custom widgets.
For more information, see Visibility Status.
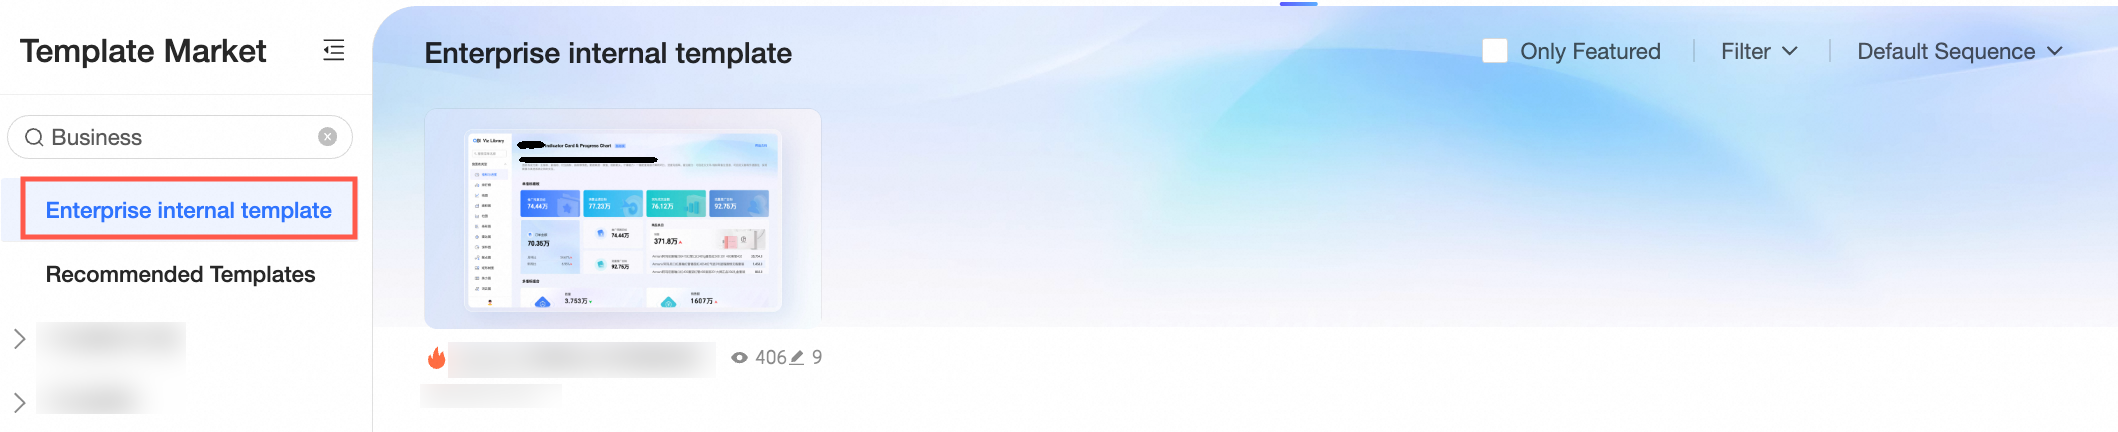
Template market
Due to the impact of the Alibaba Cloud site upgrade, the template market currently only supports sites in Malaysia (Kuala Lumpur) and Indonesia.
Internal enterprise templates can be displayed in the template market, facilitating self-operation of reports within the enterprise.
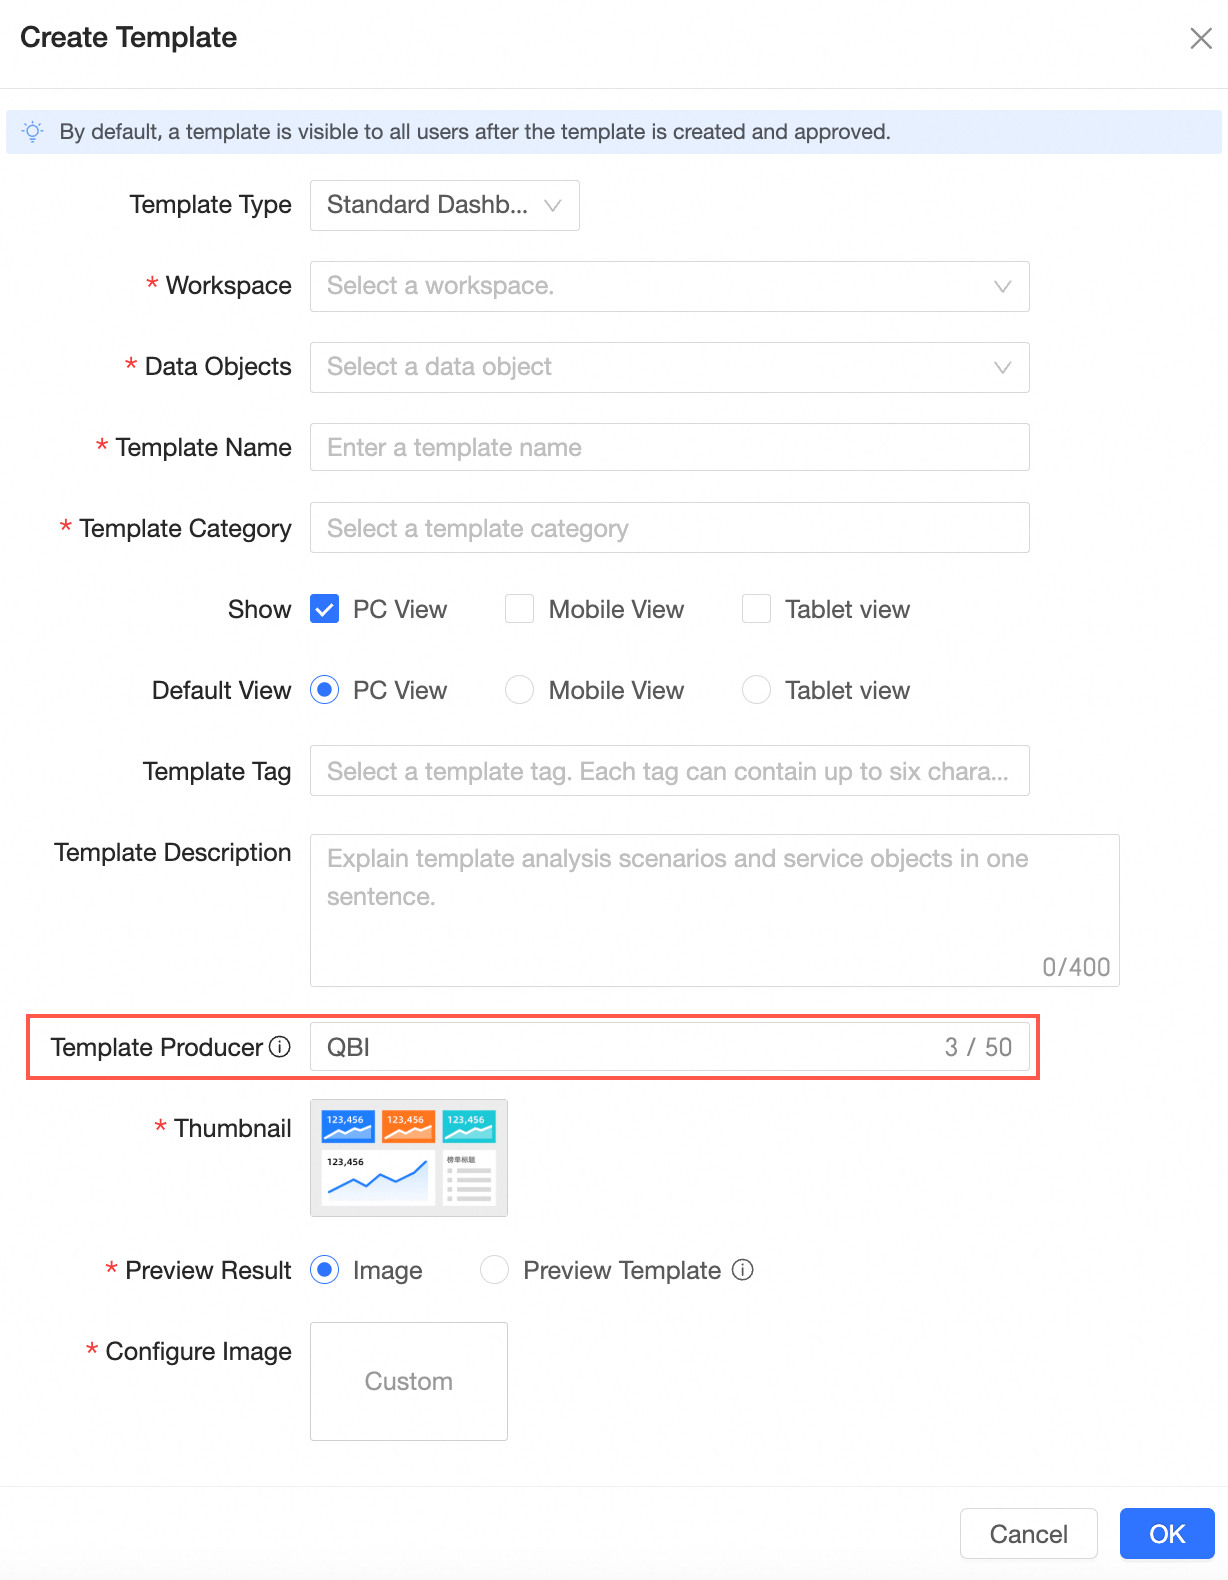
When creating a new custom template, you can add the "Template Producer" configuration item, and eventually display the producer information in the template market.
The official template market has added a BI portal template type and supports installation guidance.
For more information, see Template Market.
Data entry
A new layout lock feature is added to the mobile end. In the locked status, the mobile end will automatically synchronize the widget layout of the PC end. In the unlocked status, you can personalize the mobile end layout.

For more information, see building mobile reports and mobile layout configuration.
The mobile terminal supports one-click purge of filter interaction settings.
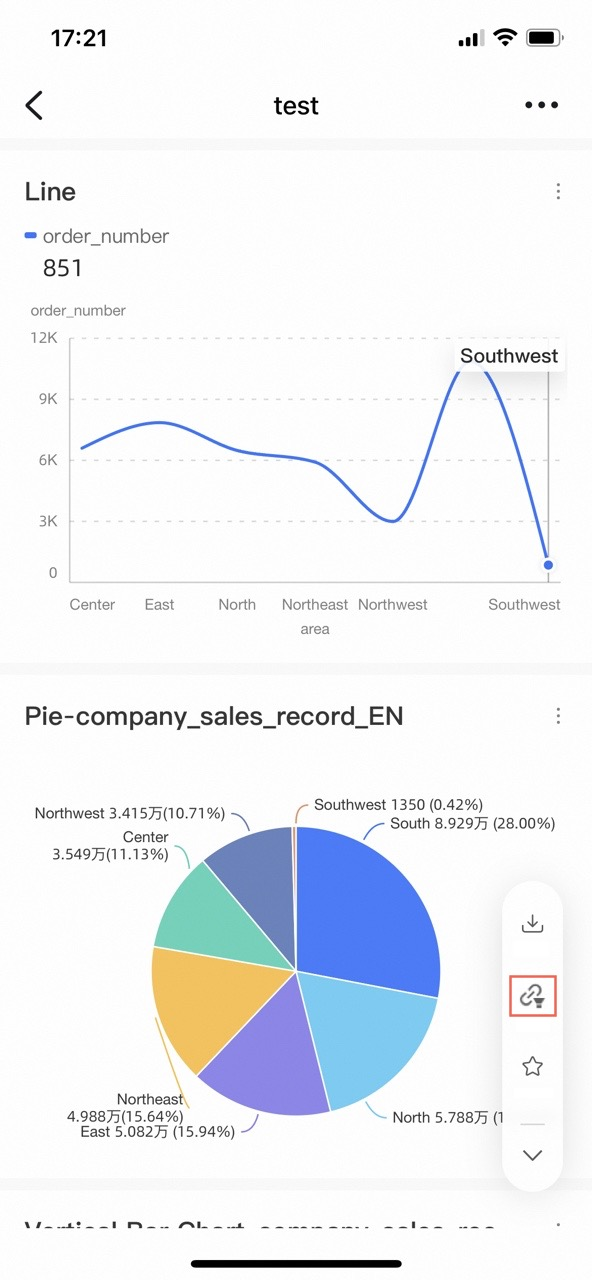
For more information, see filter interaction.
The mobile BI portal has been completely upgraded. It has refactored the interaction display style of multi-level menus in a tile layout and provides richer and more granular navigation frames and other customizable configuration items.
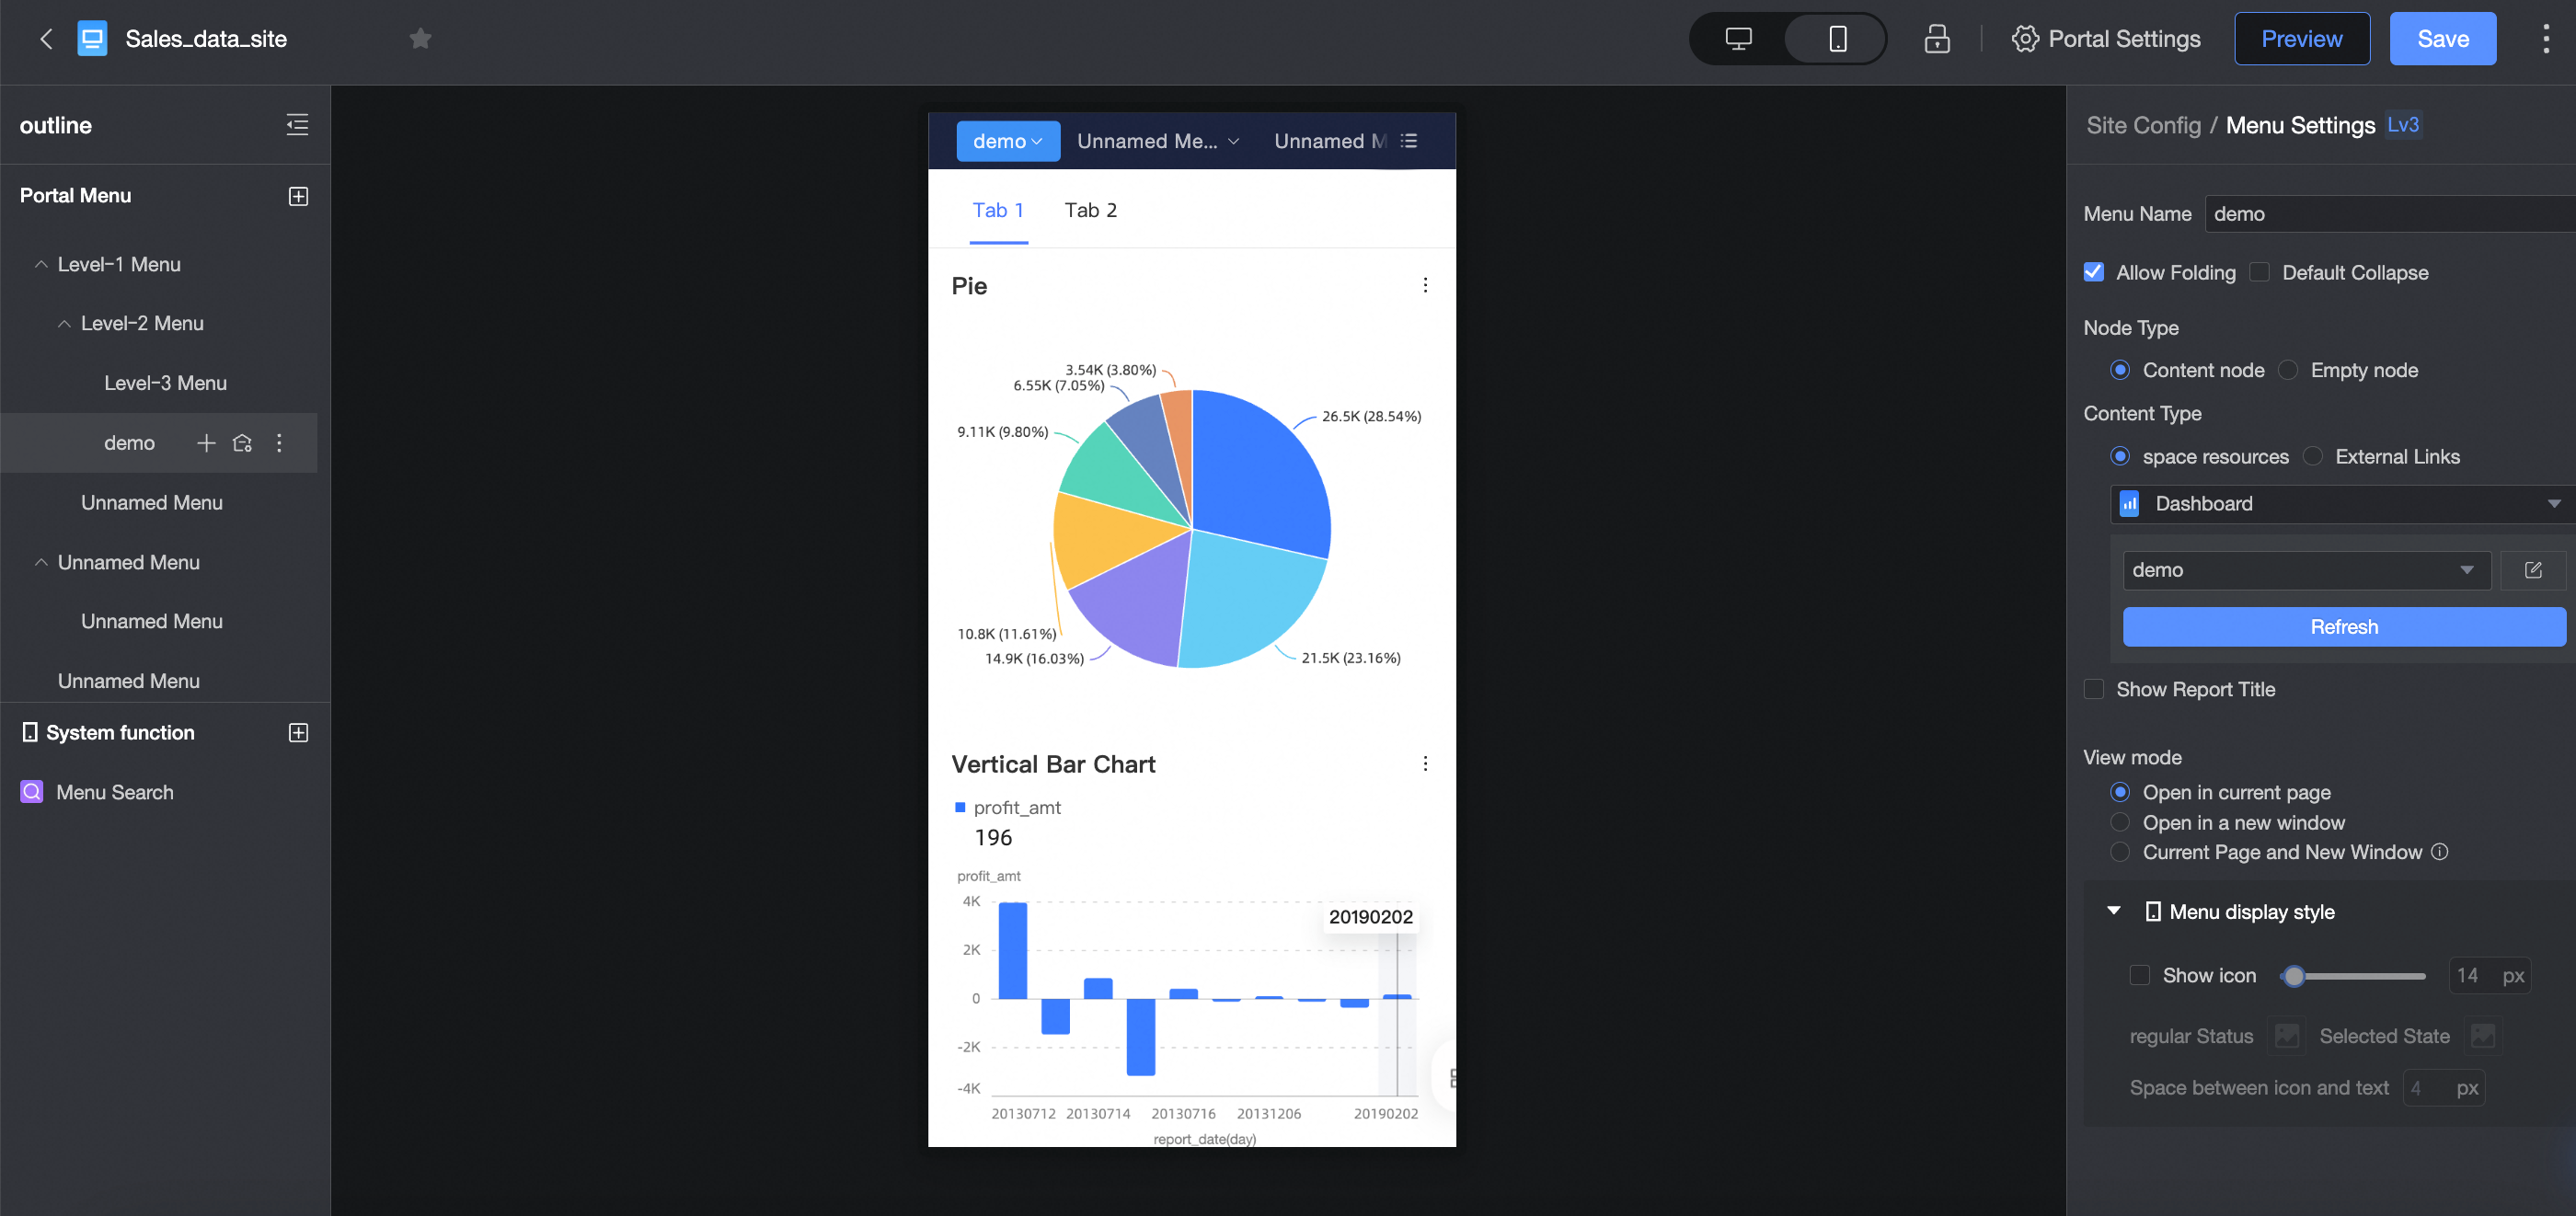
For more information, see create a mobile BI portal.
When viewing the BI portal menu bar on a mobile device, you can quickly locate the target through the global search feature inmulti-level menus and submenus.
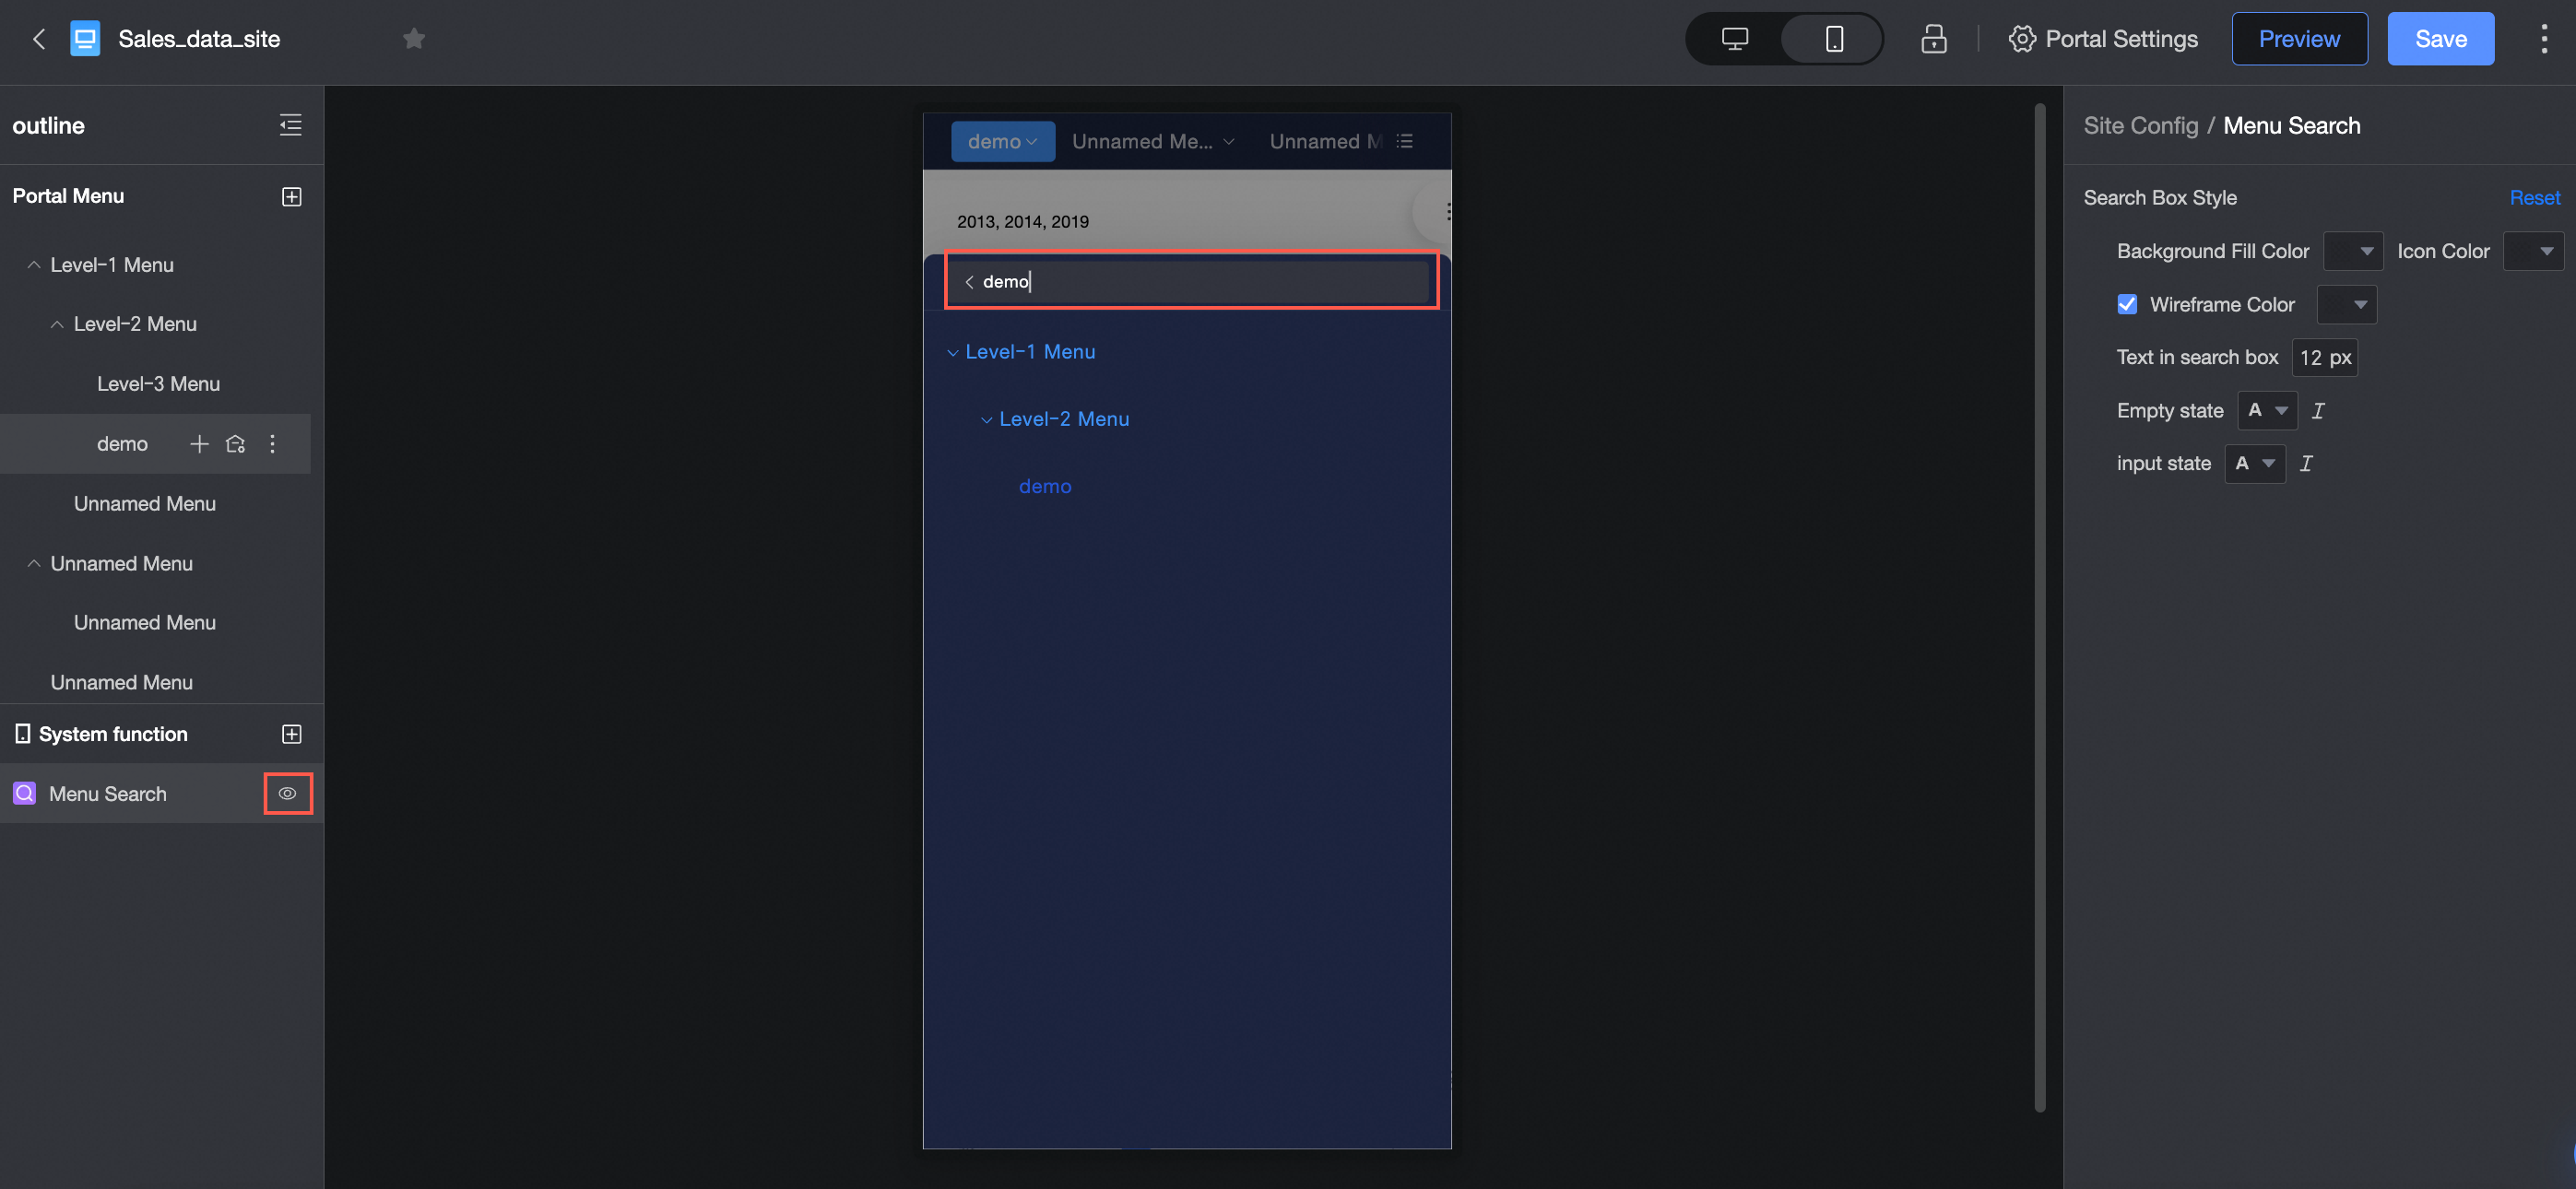
For more information, see create a mobile BI portal.
The data entry event for cross tables supports data input on mobile devices.
File uploads now support batch database entry approval.
For more information, see the cross table.
You can independently set the column width of cross tables and detail tables on mobile devices.
For more information, see cross tables and detail tables.
Form filling supports data entry on mobile devices.
For more information, see form filling on mobile devices.
Experience optimization
The preview of resources in my dashboard and workspace supports switching between multiple tabs.
For more information, see view dashboards and resource preview.
Filter and sort optimization. When the filter area is hidden, you can view, delete, or clear filter conditions.
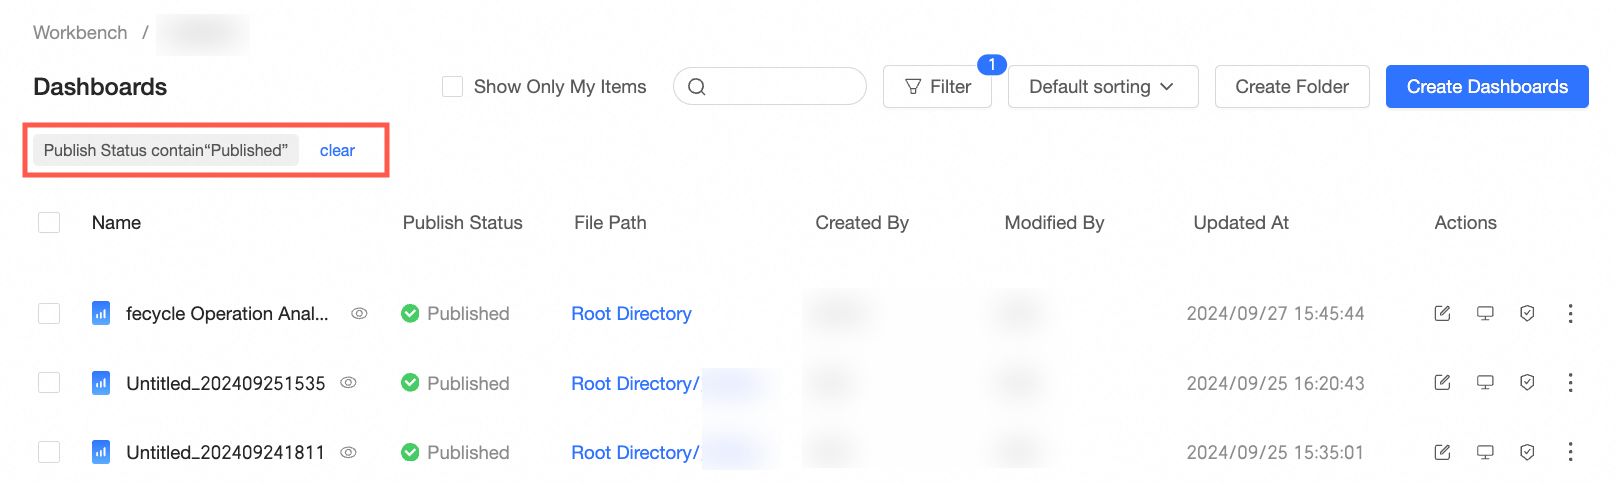
For more information, see manage dashboards.
When the resource list in the workspace is collapsed, you can hover the mouse to expand it.
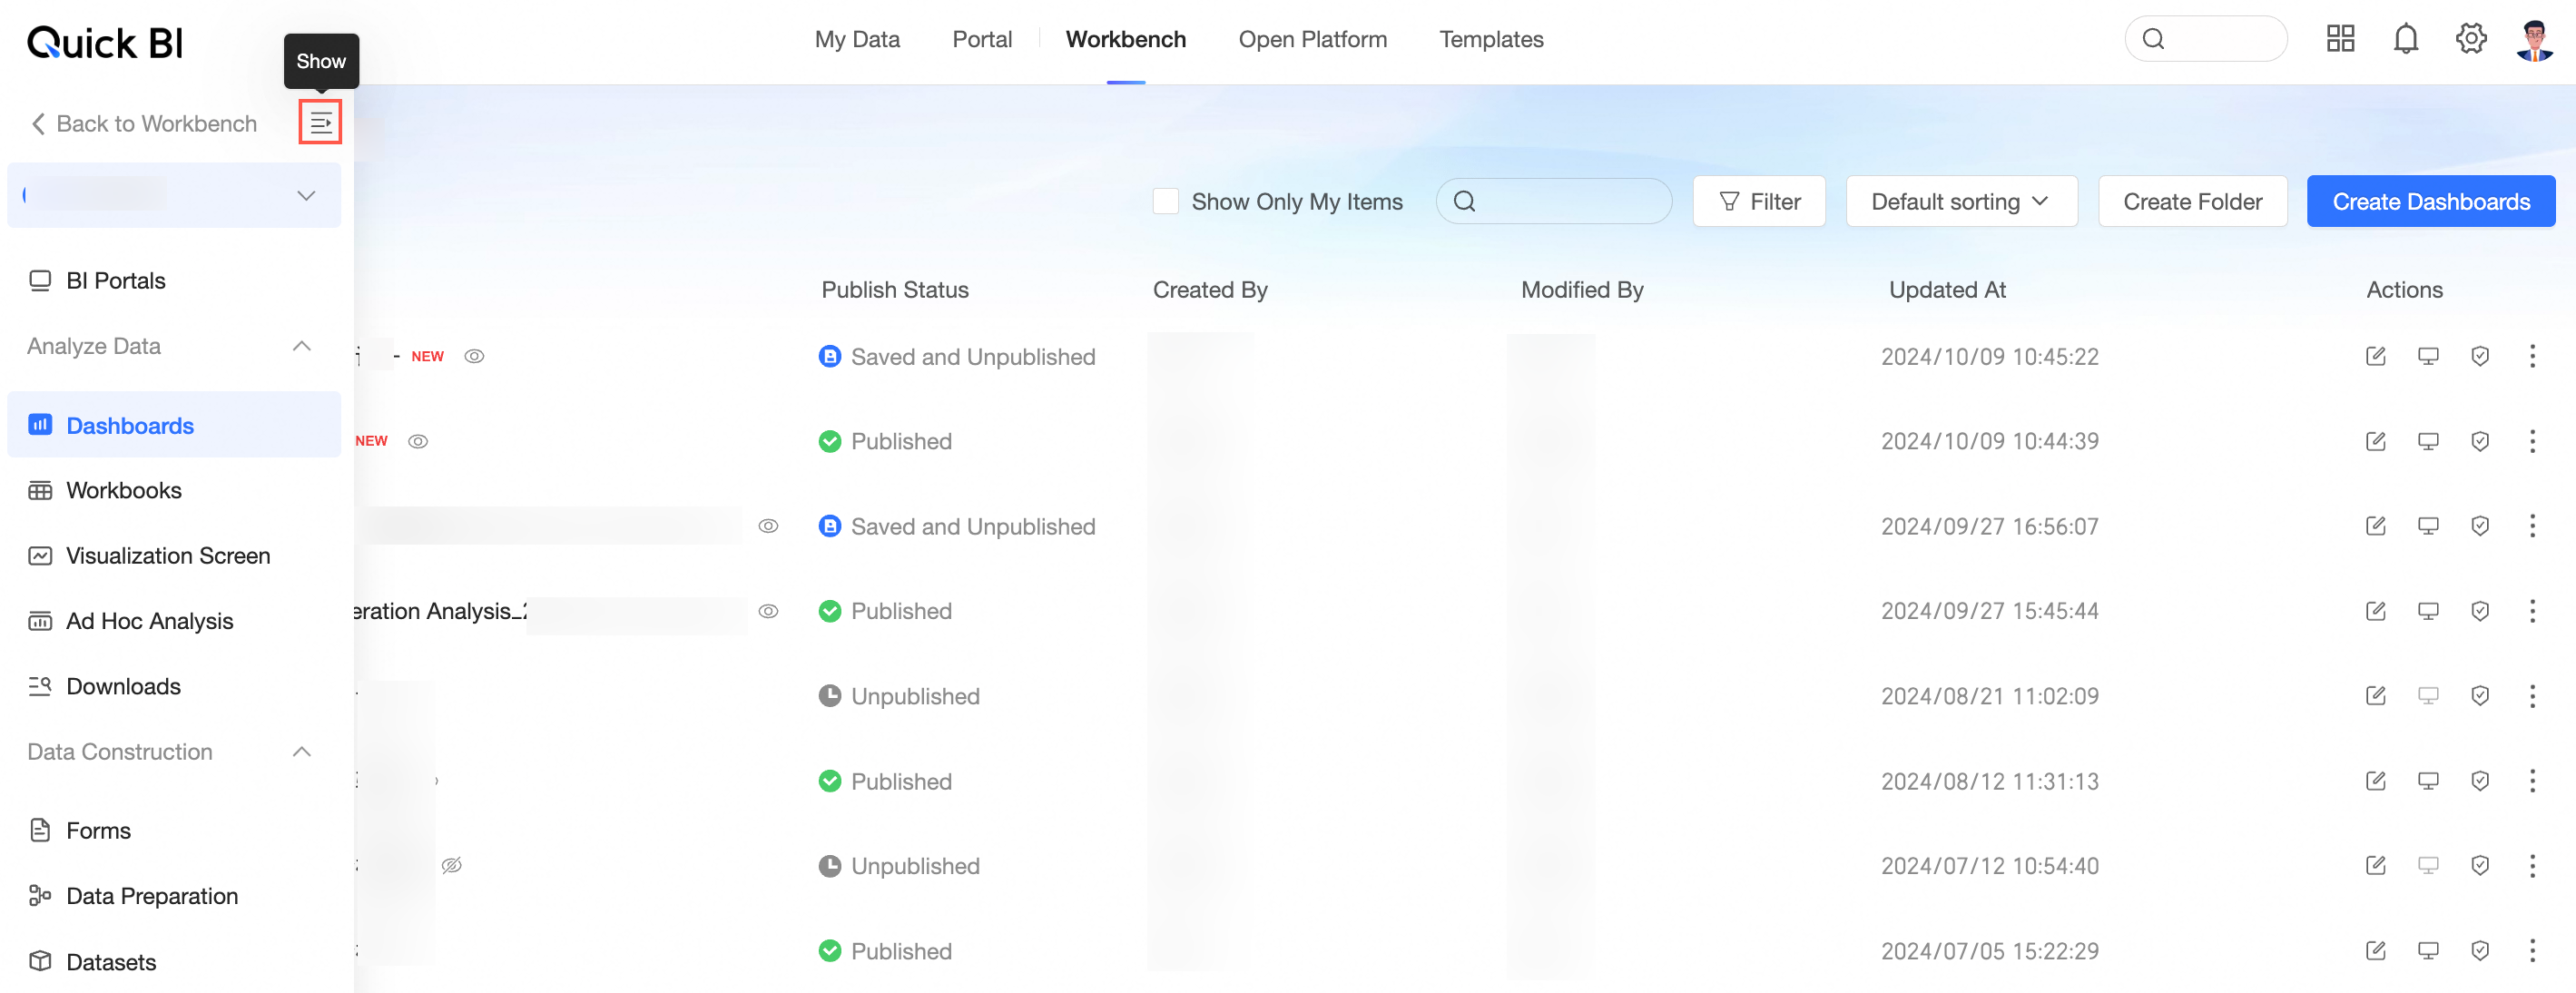
For more information, see GUI elements in the Quick BI console.
Data source and dataset error message optimization. A new FAQ guide is added.
For more information, see data source FAQ and dataset FAQ.
The system language supports following the browser settings.
ImportantNote: If the current account is shared by multiple users, setting it to follow the browser language may cause inconsistent language display. It is recommended to set a fixed system language when sharing an account to avoid obfuscation.