This topic primarily focuses on how to conduct statistical analysis of resource usage within an organization, including viewing the total number of resources, analyzing resource capacity distribution, and examining detailed information about various resources.
Background Information
The resource usage analysis feature is available only in Pro and Professional Edition group spaces.
Only organization administrators and users with custom roles that include artificial intelligence for IT operations permissions can access and use the resource usage analysis feature.
Feature Entry
You can access the resource usage analysis page by the following methods.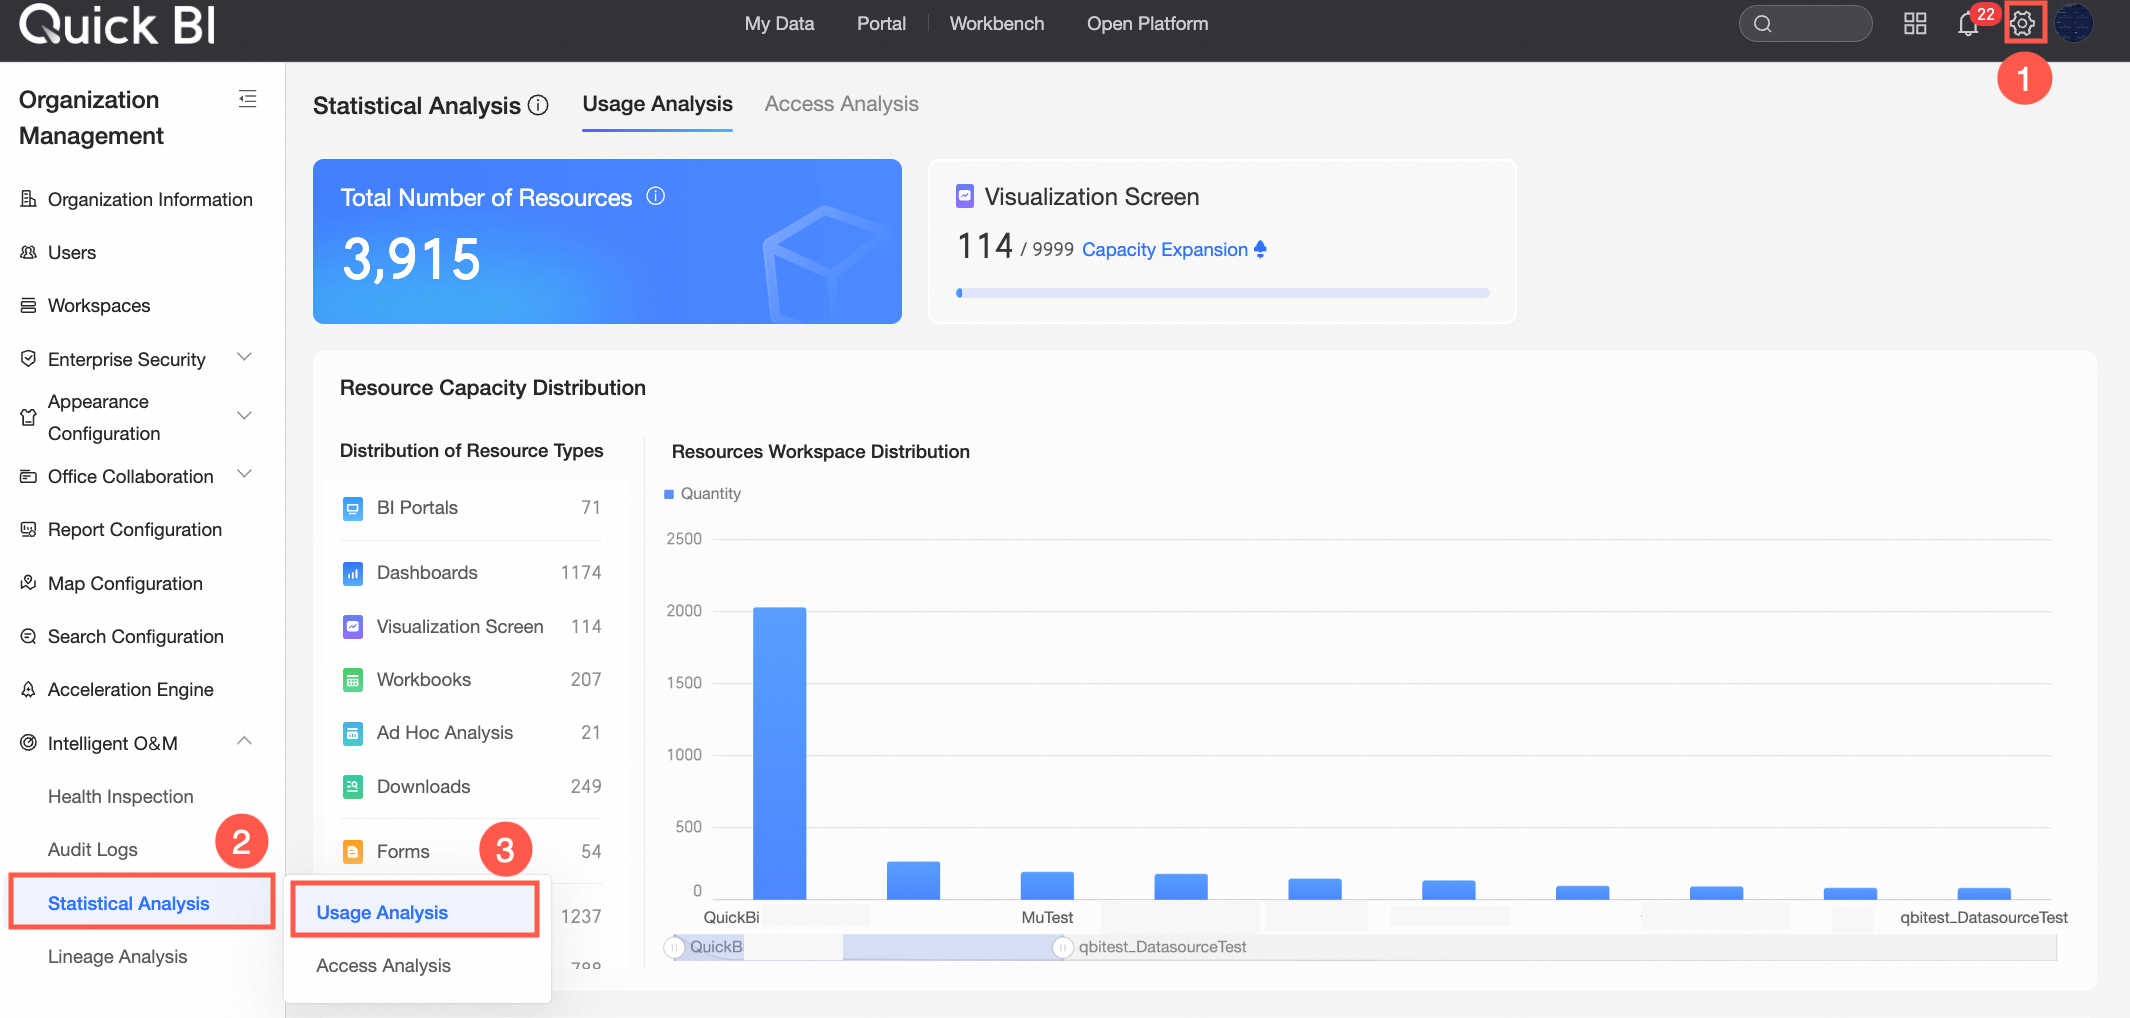
Panel Content Introduction
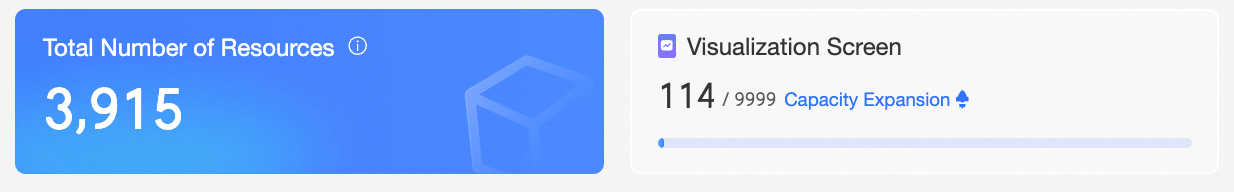
Resource Overview
This section displays the total number of resources within the organization and the used versus total capacity of the data dashboard.
NoteIf the data dashboard has not been purchased, you can click "Purchase Now" to navigate to the purchase page.
For extensive resources, you can click "Scale Out" to increase capacity.
Resource Capacity Distribution
This displays how various resources are distributed across workspaces within the organization, categorized in the left sidebar and visualized in the right column chart. By default, the chart shows the distribution of all resources.
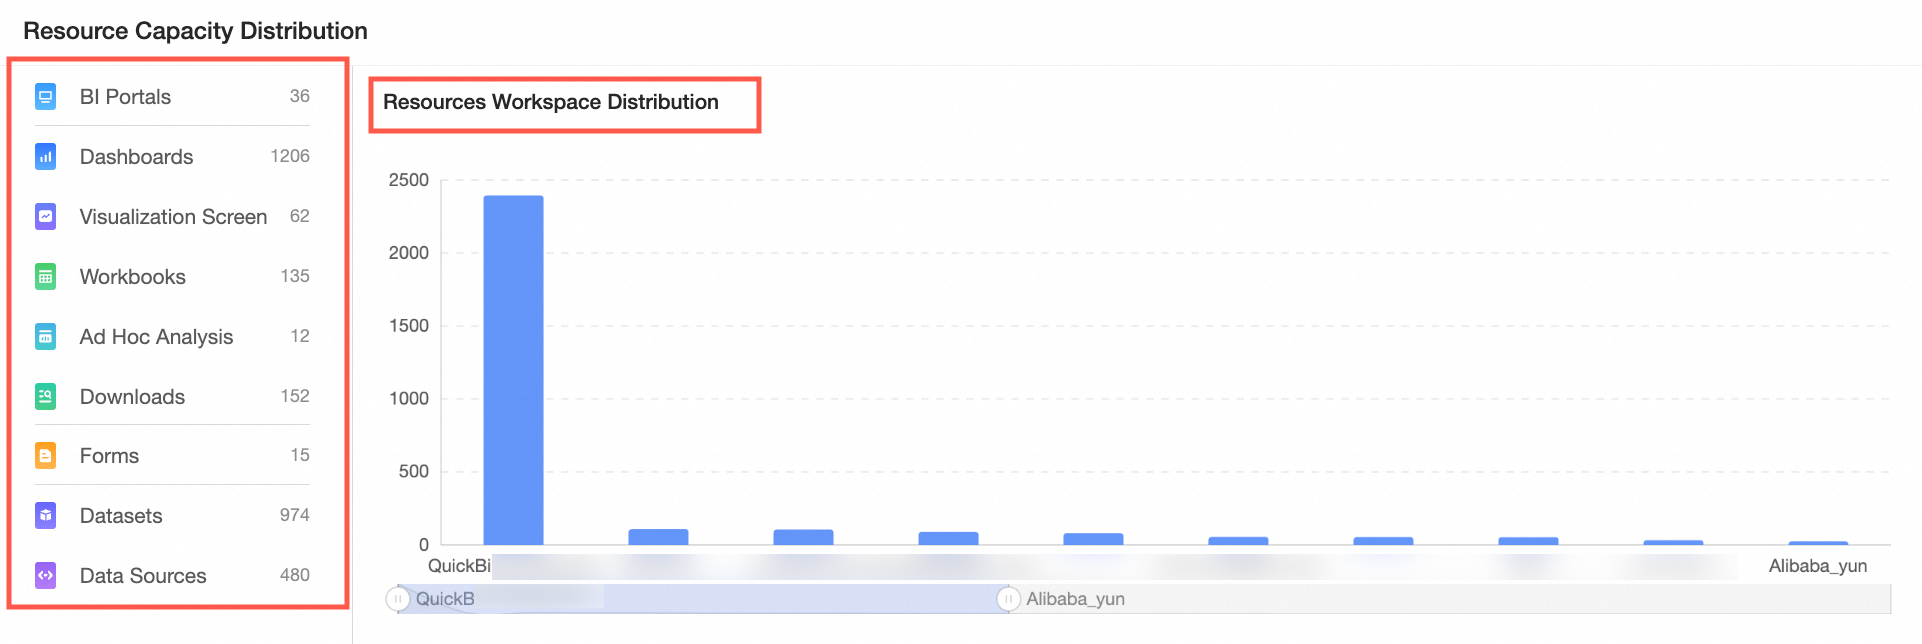
Interactive Filter Effect: Clicking on any report resource in the left category filters and updates the corresponding space distribution column chart on the right.
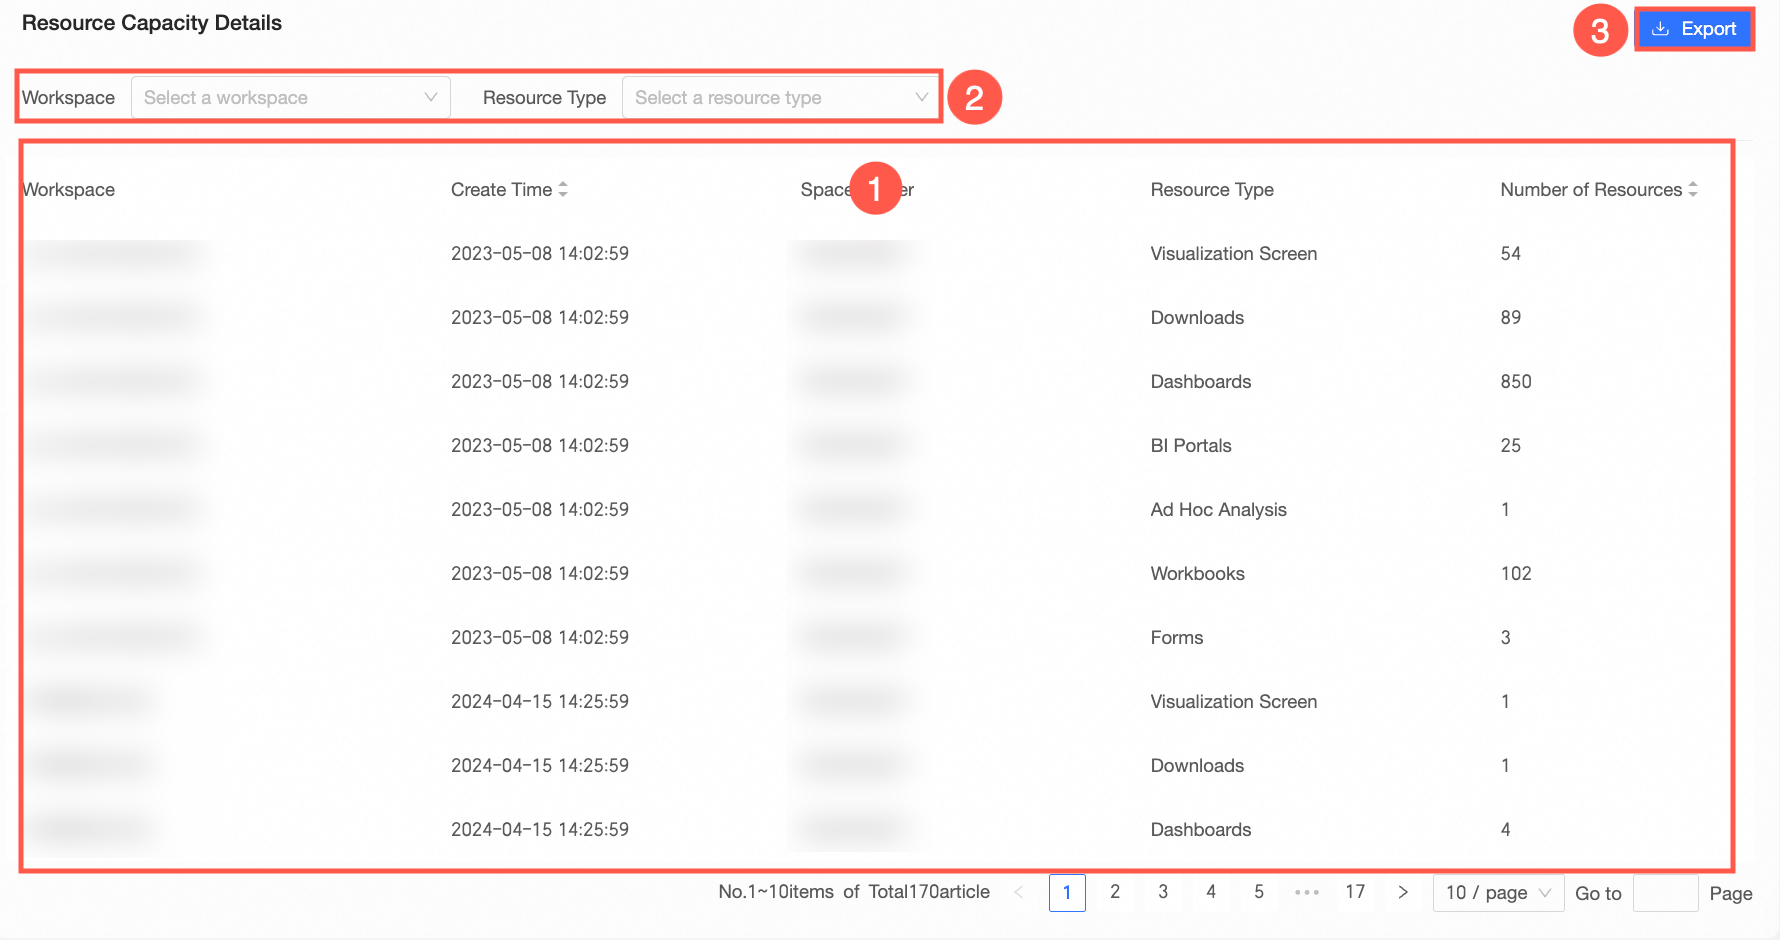
Resource Details
This section provides a detailed view of how various resources are allocated in each workspace (①). It also supports exporting data (③) in Excel format for local use.
NoteYou can also use the filter box (②) to specify conditions for viewing specific resources.
The filter box resource type is pre-selected, displaying specific resource types for selection.
The filter box workspace expands to show all workspace names, allowing for individual selection.