Create a Dataset
A dataset is a collection of business data—numbers, text, and dates—that serves as the foundation for visual analysis in Quick BI. Pull data from one or more tables into a single dataset, then analyze and visualize it. You can build a dataset by dragging tables onto a canvas (visual configuration) or by writing an ad hoc SQL query.
Prerequisites
Before you begin, ensure that you have a data source connection. For more information, see Connect to a data source.
Create a dataset
-
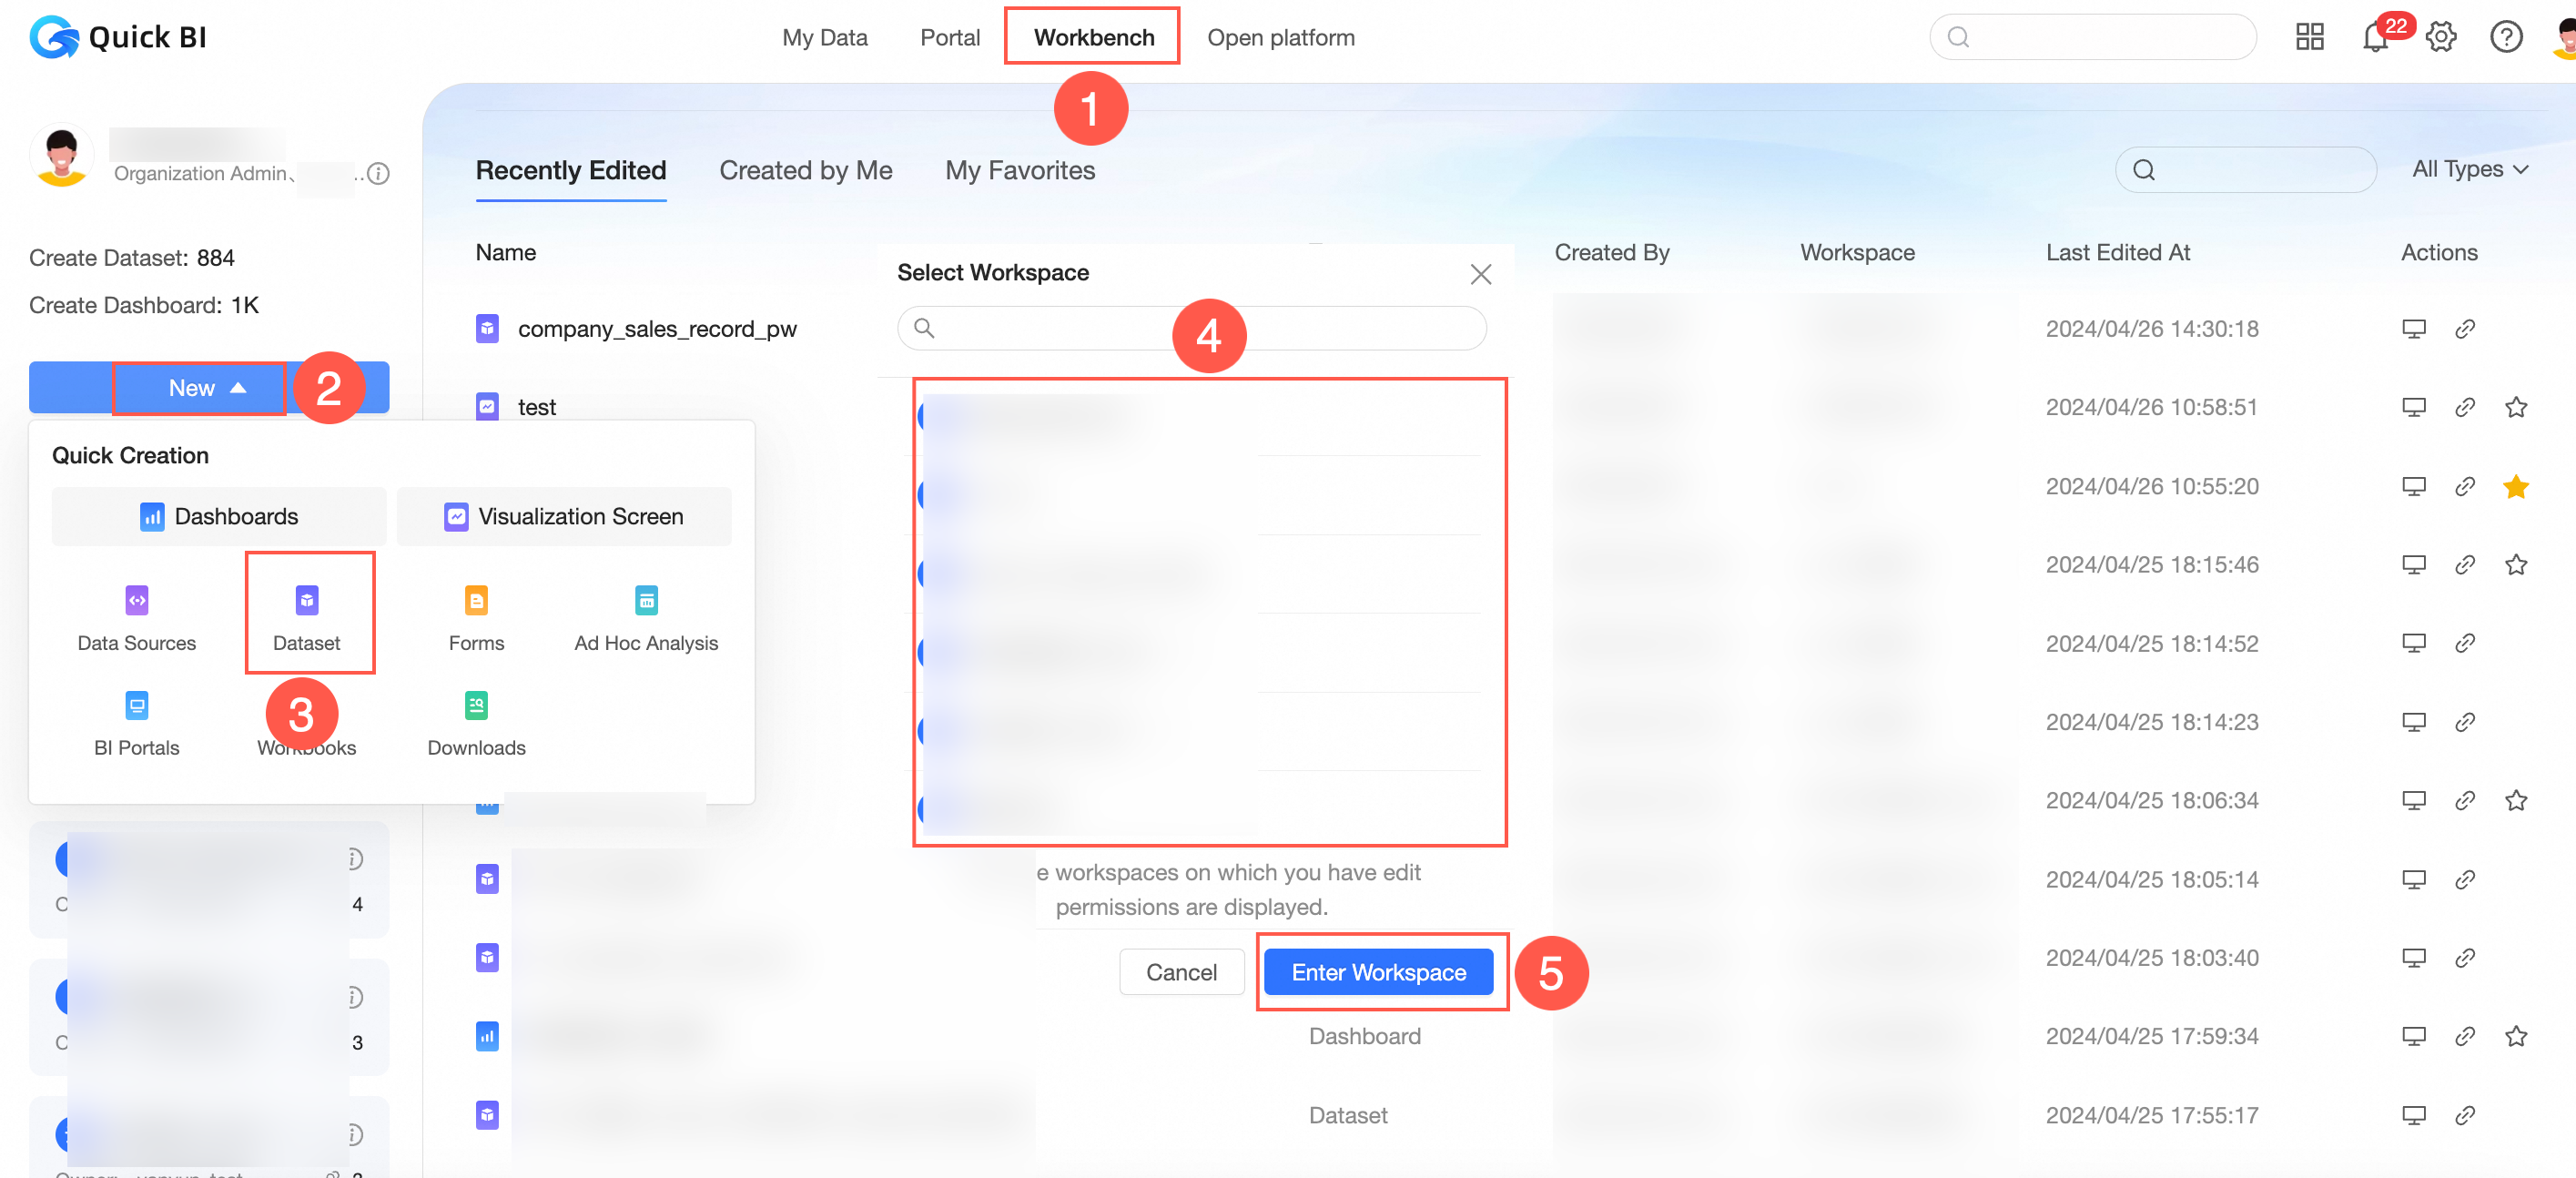
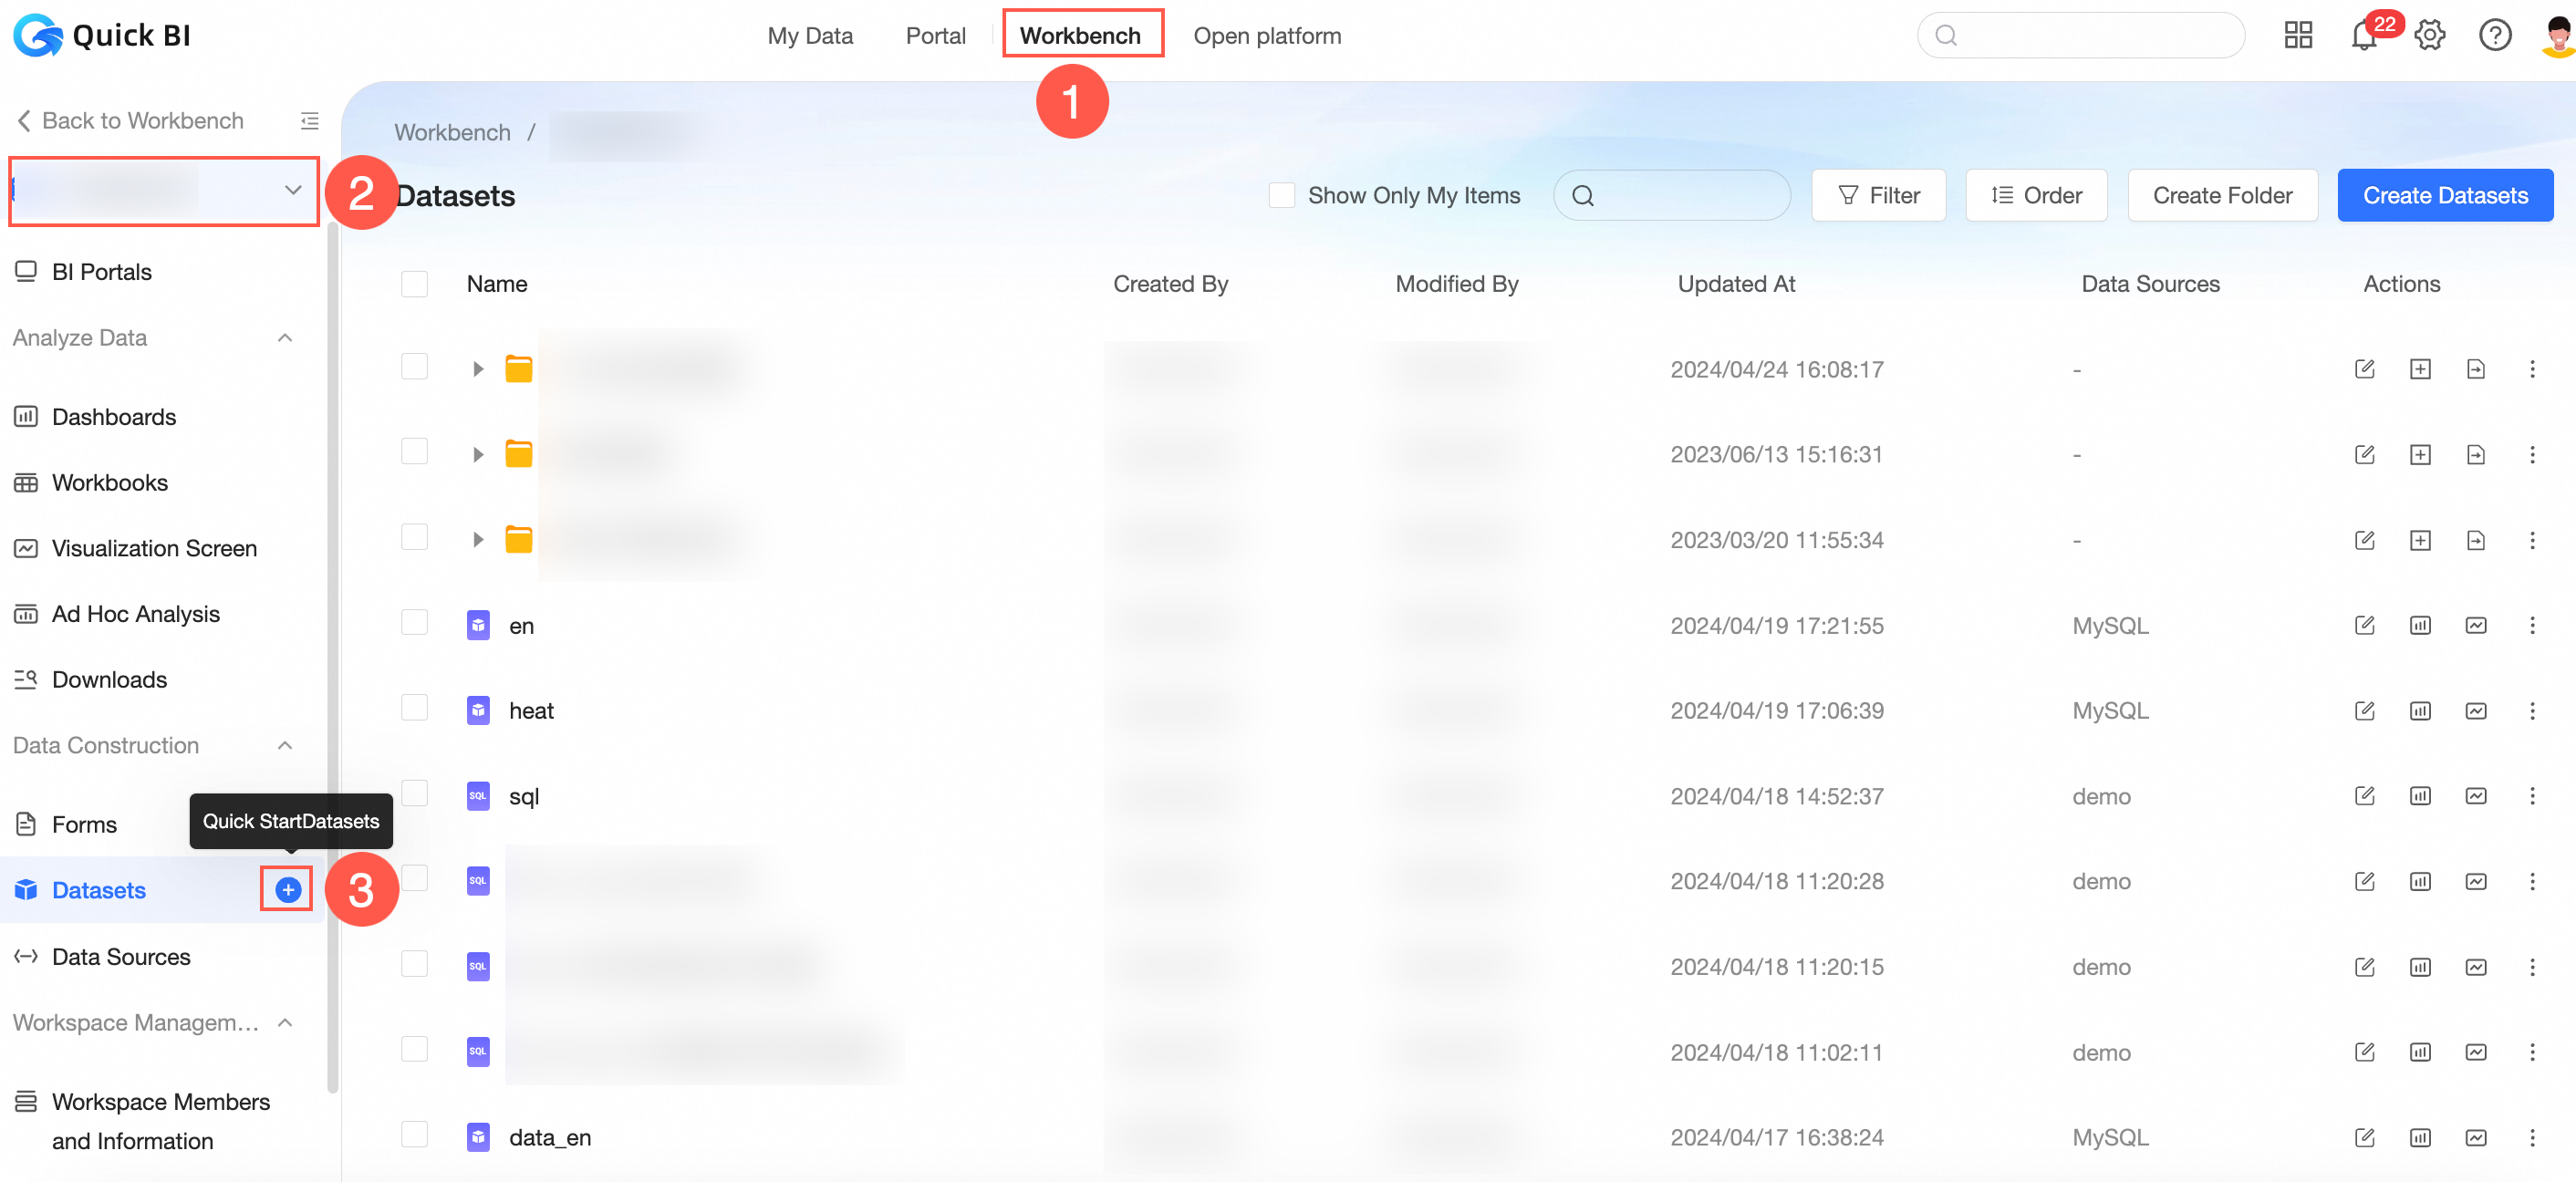
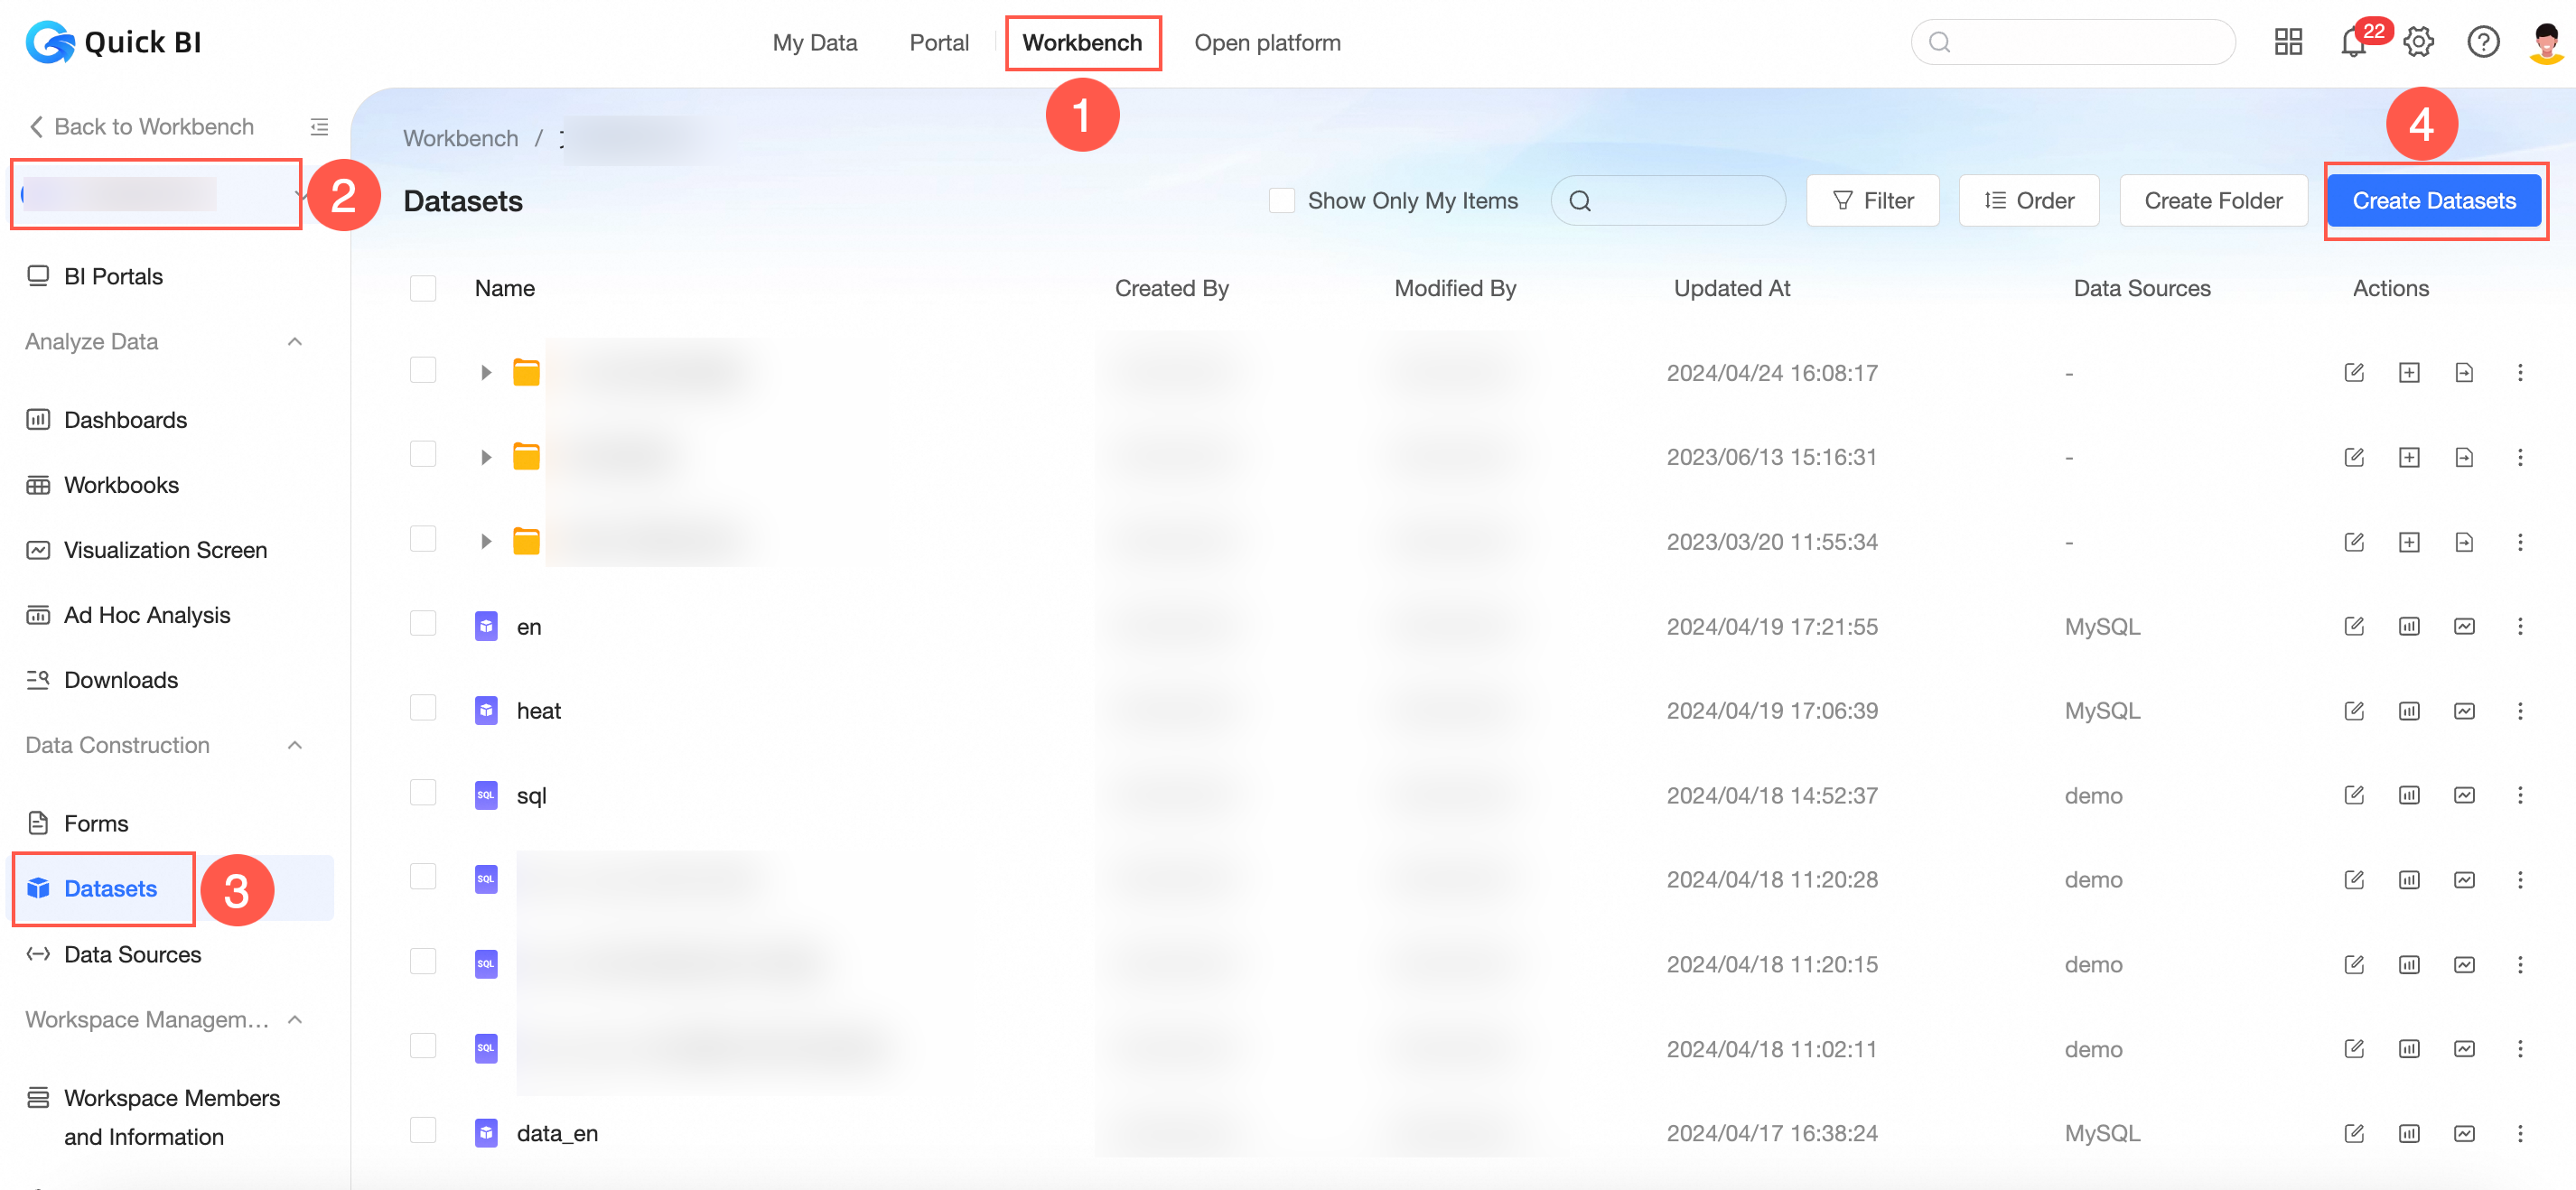
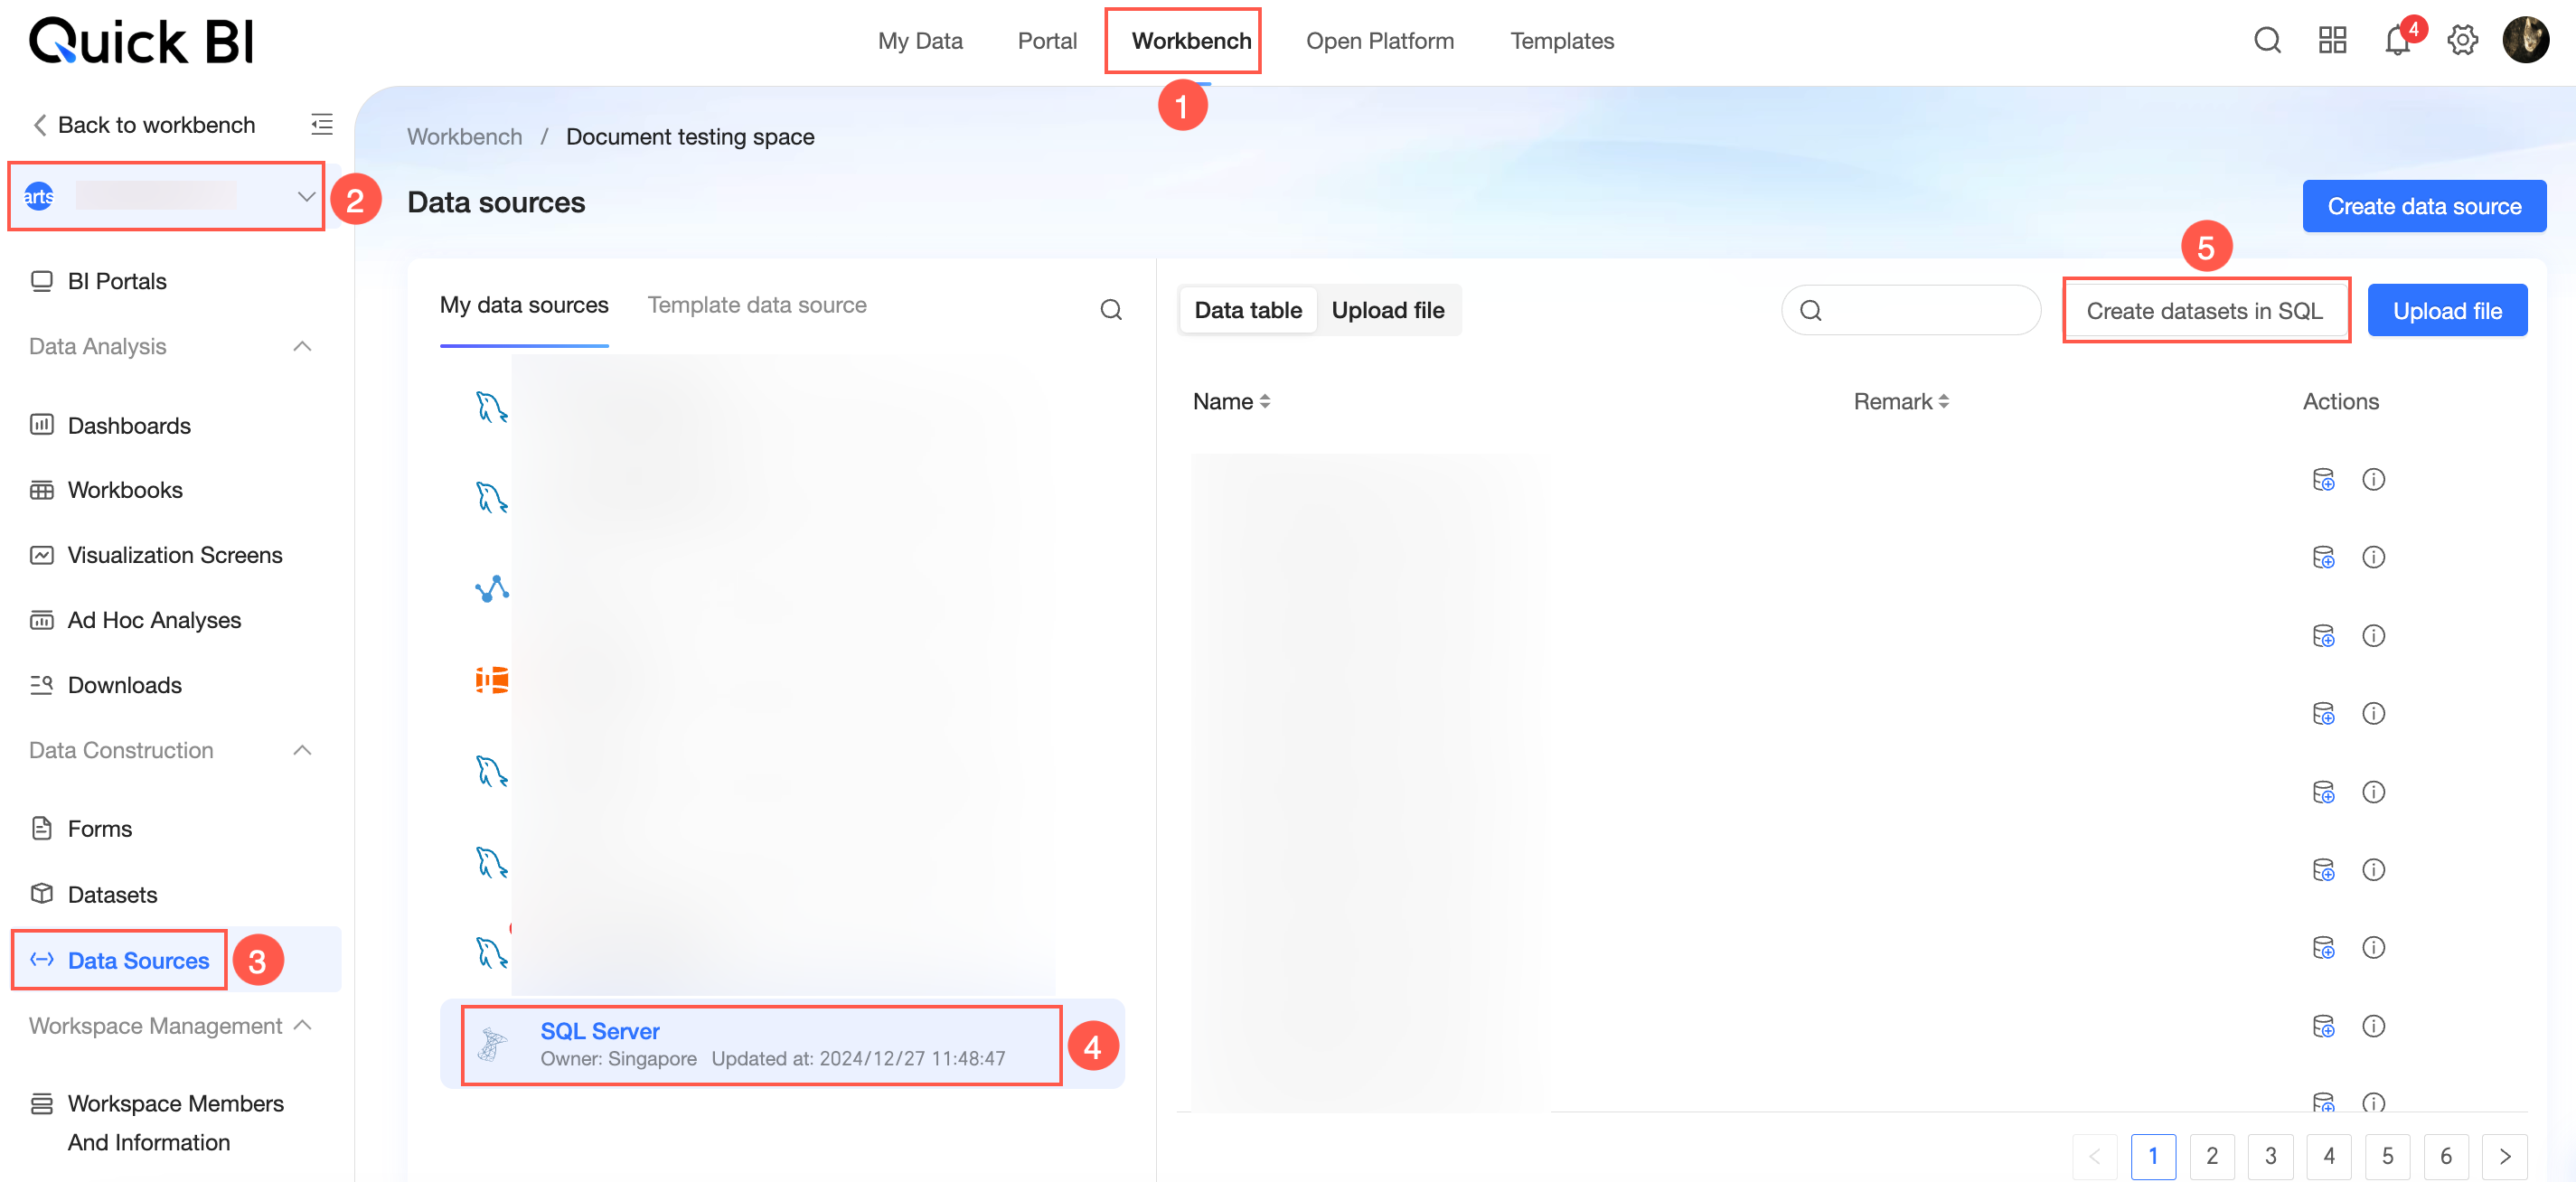
Go to the dataset creation page. Quick BI provides five entry points:
Entry 1: Create a dataset from outside a workspace.
Entry 2: Create a dataset from the resource list in the workspace.
Entry 3: On the Datasets page, click Create Dataset.
Entry 4: On the Data Sources page, click the
 icon next to a table to create a dataset.
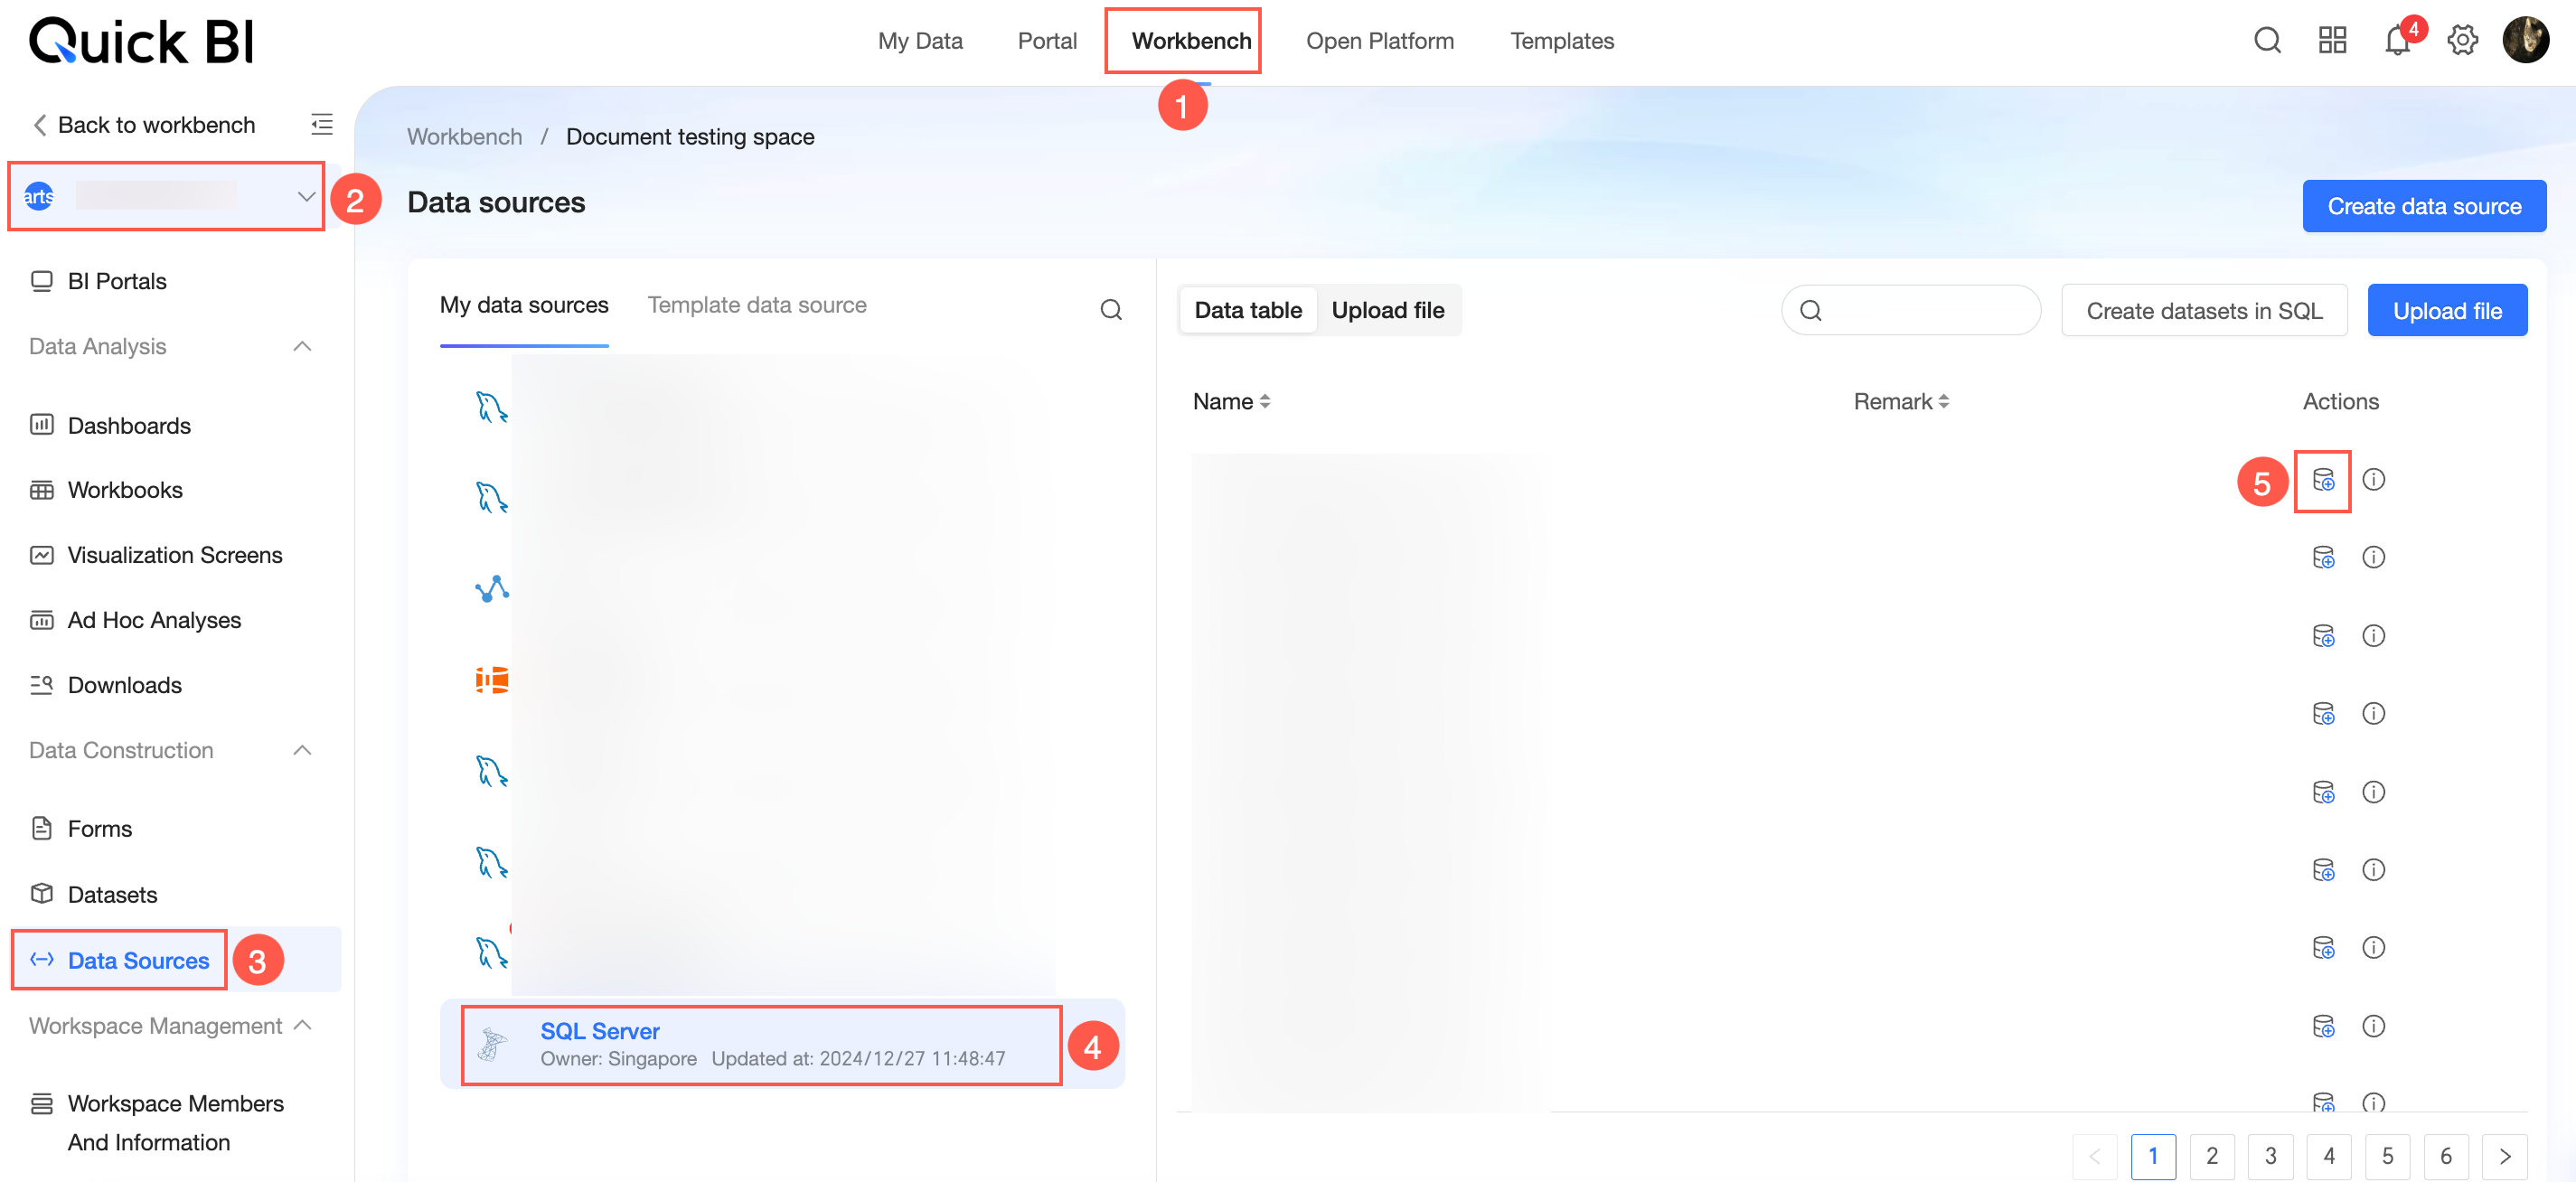 Entry 5: On the Data Sources page, click Create datasets in SQL.
-
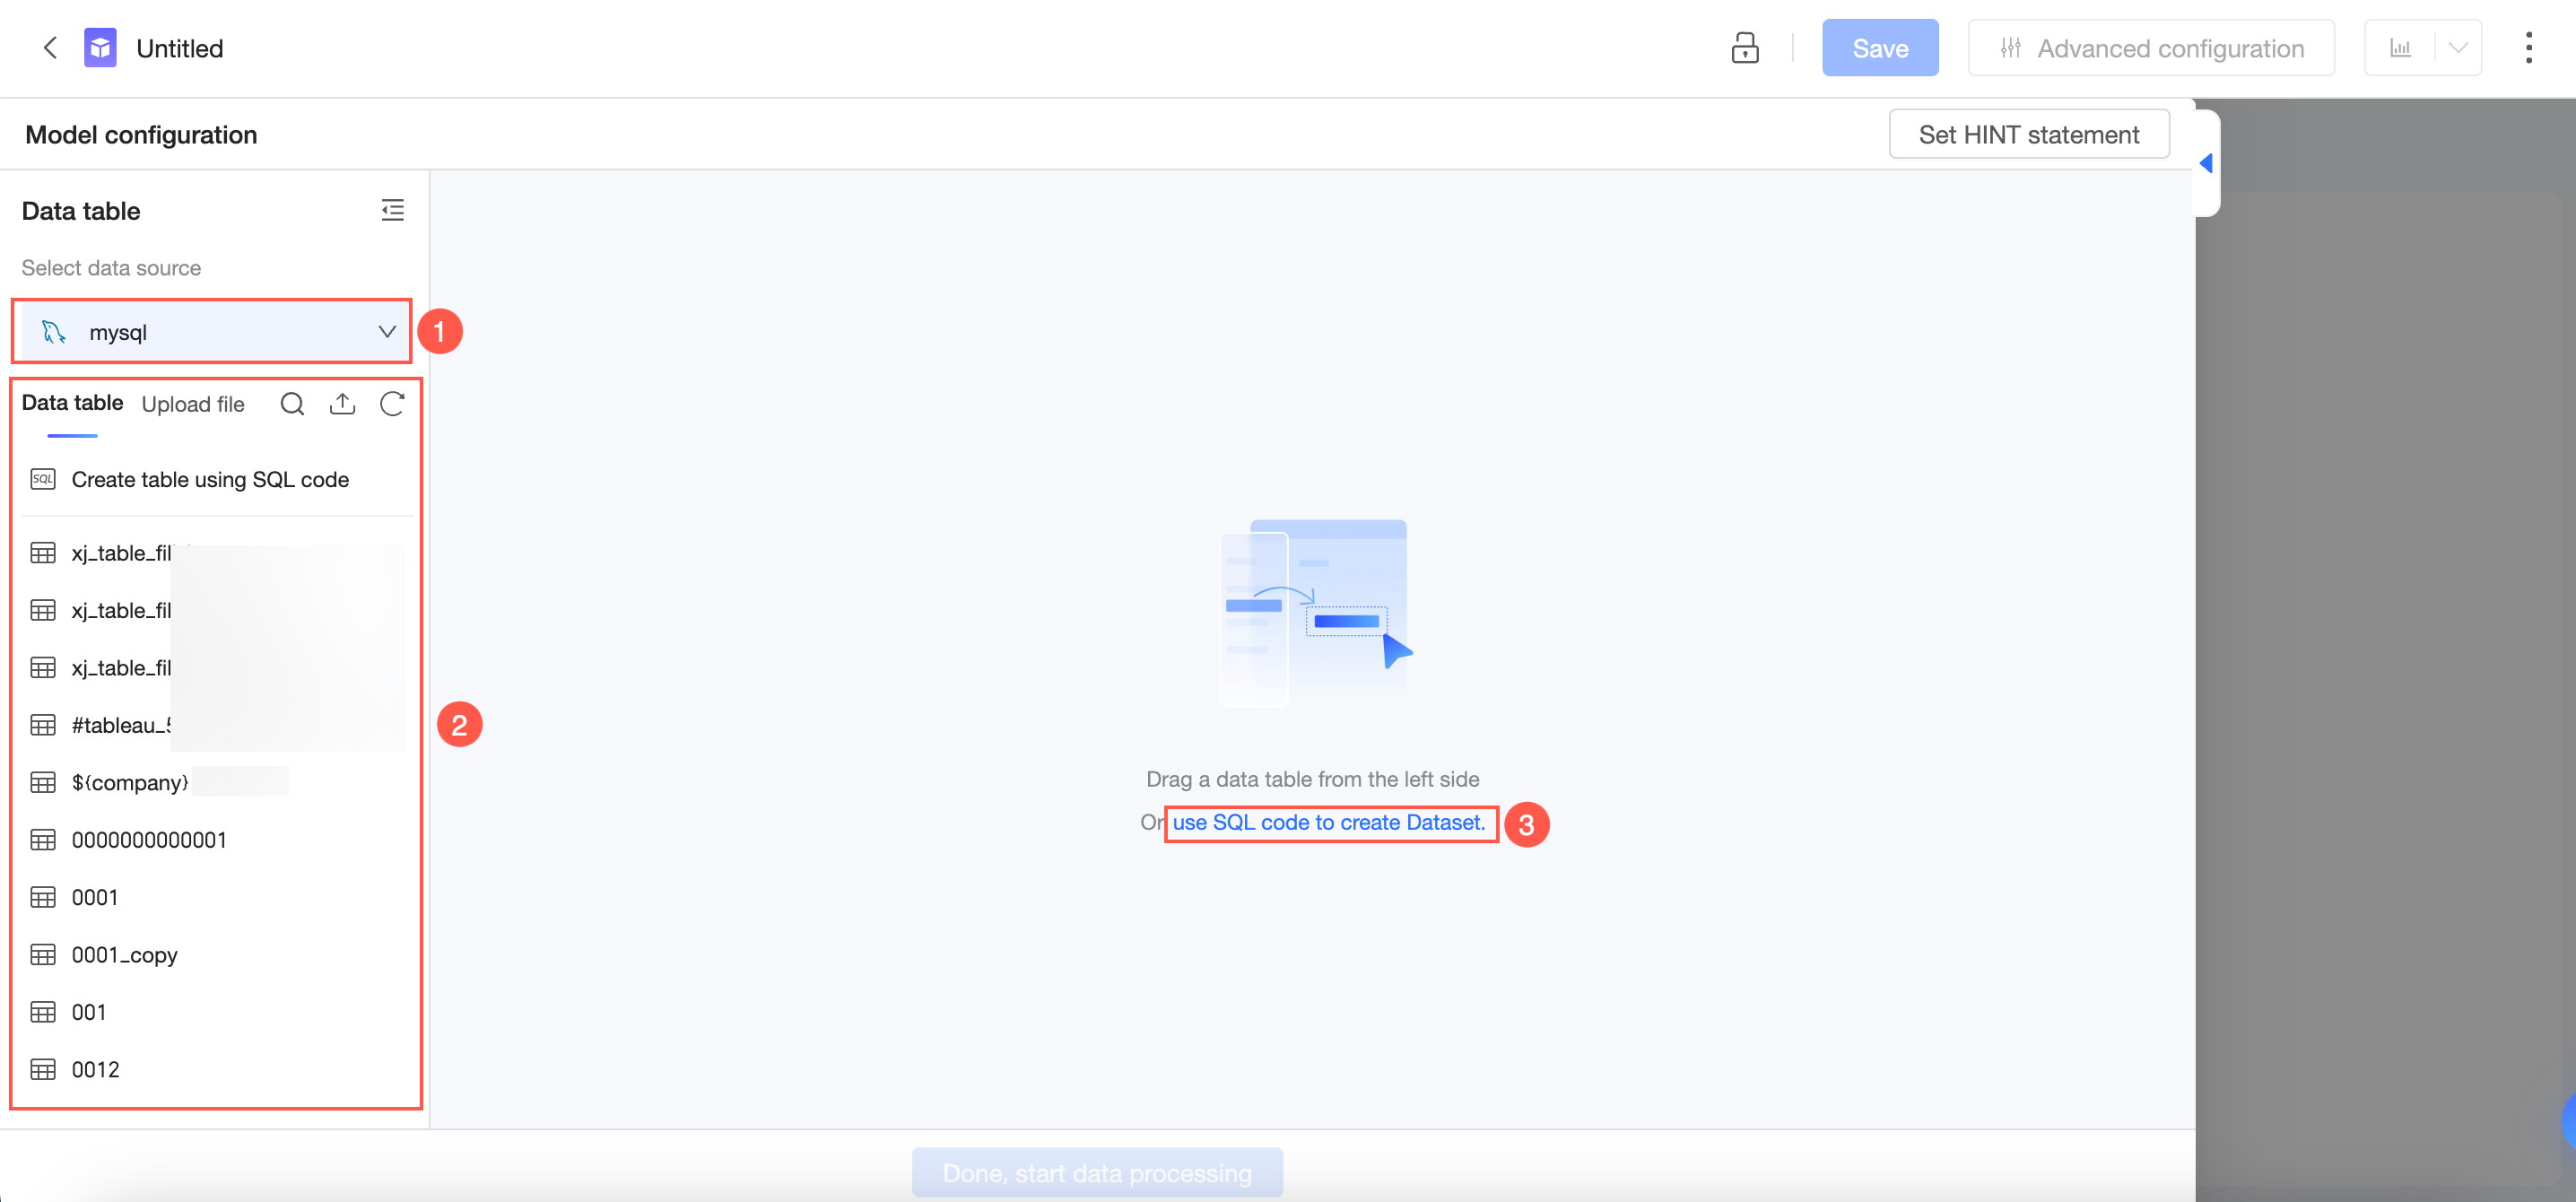
On the dataset creation page, the left panel (①) lists your connected data sources. Drag a table (②) from the left panel onto the canvas to add it to the dataset. To use SQL instead, write an ad hoc query in the query editor (③). For details on writing ad hoc queries, see Custom SQL.
NoteA dataset can contain up to 100 tables and ad hoc queries.
Next steps
Build a relational model by joining or unioning source tables. For more information, see Build a model.
Add calculated fields, dimension groups, and other data transformations. For more information, see Data processing.
Configure Quick Engine and permission control to improve dataset performance. For more information, see advanced settings.
Manage your datasets. For more information, see dataset management.
Combine multiple datasets. For more information, see Dataset combination.
Find answers to common questions. For more information, see Dataset FAQ.