This topic explains how to add a user-created MariaDB data source to Quick BI.
Prerequisites
You have created a user-created MariaDB database.
You have obtained the username and password for the MariaDB database.
Limits
Only version 10.3 is supported.
Procedure
Add the IP address of Quick BI to the whitelist.
Before connecting to the user-created MariaDB data source, you need to add the IP address of Quick BI to the whitelist of the MariaDB database.
Log on to the or the international Quick BI console.
Access the data source creation interface via the data source creation entry.
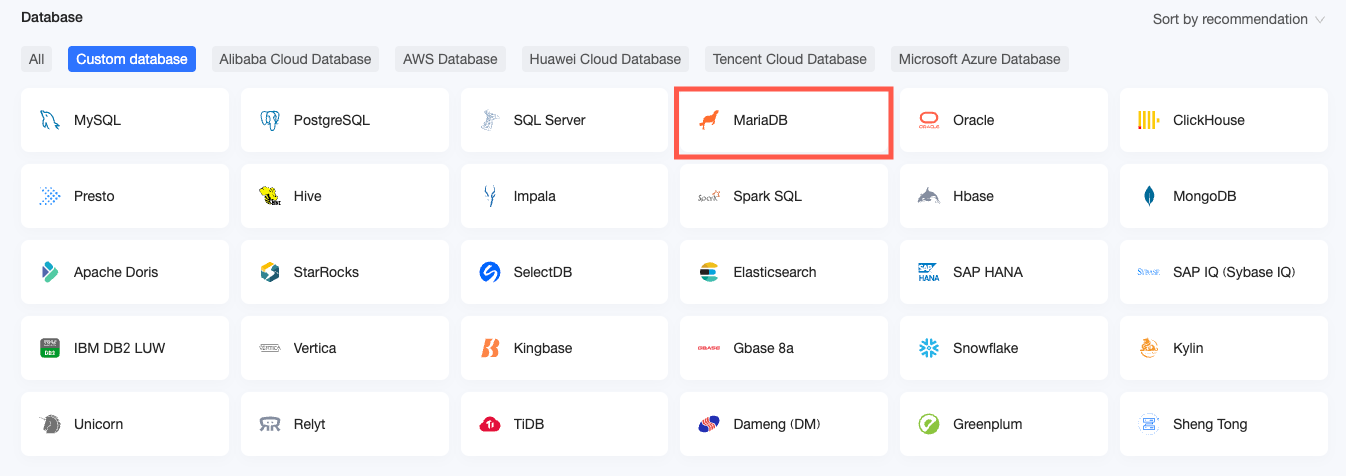
On the User-created Data Source tab, select MariaDB as the data source type.
In the Configure Connection dialog box, configure the connection settings according to your business needs.
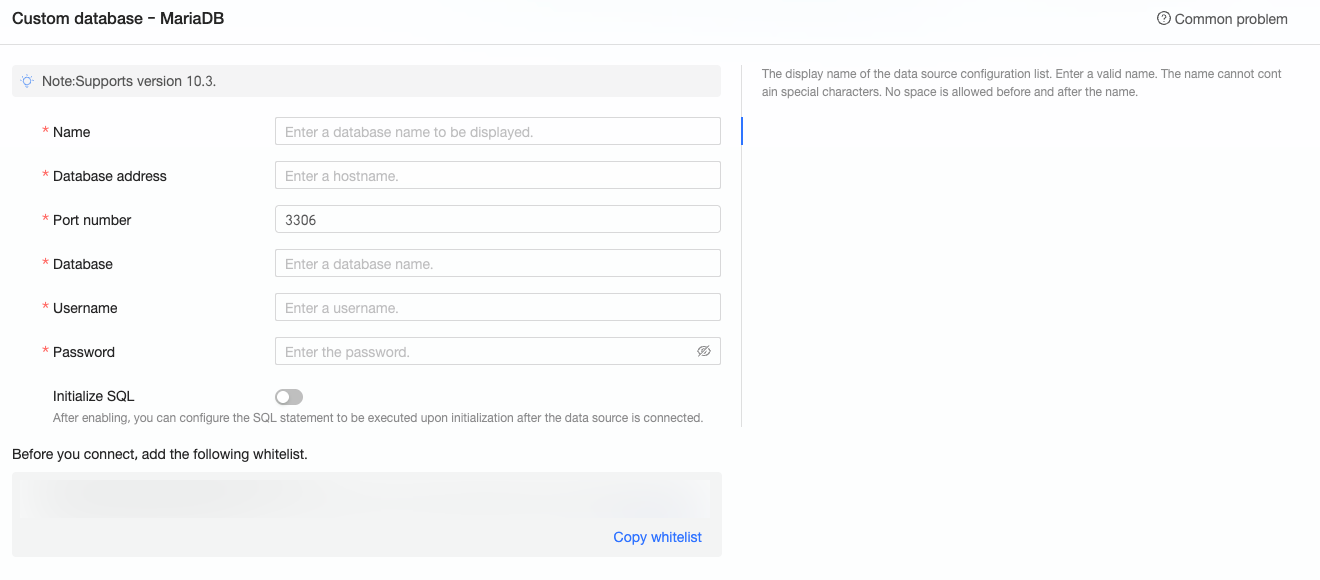
Name
Description
Display name
The name displayed in the datasource config list.
Please enter a standard name. Do not use special characters or start or end with spaces.
Database address
The address where the MariaDB database is deployed, including IP or domain name.
Port
The port number corresponding to the database.
Database
The custom database name when the MariaDB database is deployed.
Username and Password
The username and password that are used to access the database.
Ensure that the username has create, insert, update, and delete permissions on tables in the database.
Initialization SQL
After enabling, you can configure the SQL statement to be executed after the data source connection is initialized.
Only SET statements are allowed for the SQL statement executed after each data source connection initialization. Statements are separated by semicolons.
Click Connection Test to verify the data source connectivity.

Once the test is successful, click OK.
What to Do next
After adding a data source, you can proceed to create datasets and perform data analysis.
For instructions on adding data tables from the MariaDB data source or creating custom SQL queries in Quick BI, see Create Datases.
For adding visualization charts and analyzing data, refer to Create a Bashboard and Overview of Visualization Charts.
To explore detailed data analysis through drilling, see Drill Settings and Display.