Performance diagnosis helps you identify and resolve performance bottlenecks in reports and data analysis operations, improving query speed and overall responsiveness.
Limits
-
The dashboard, workbook, and data dashboard modules support performance diagnostics.
Prerequisites
-
You have created a dashboard, workbook, or data dashboard.
-
You have selected the target dataset and configured the chart fields.
Entry points
-
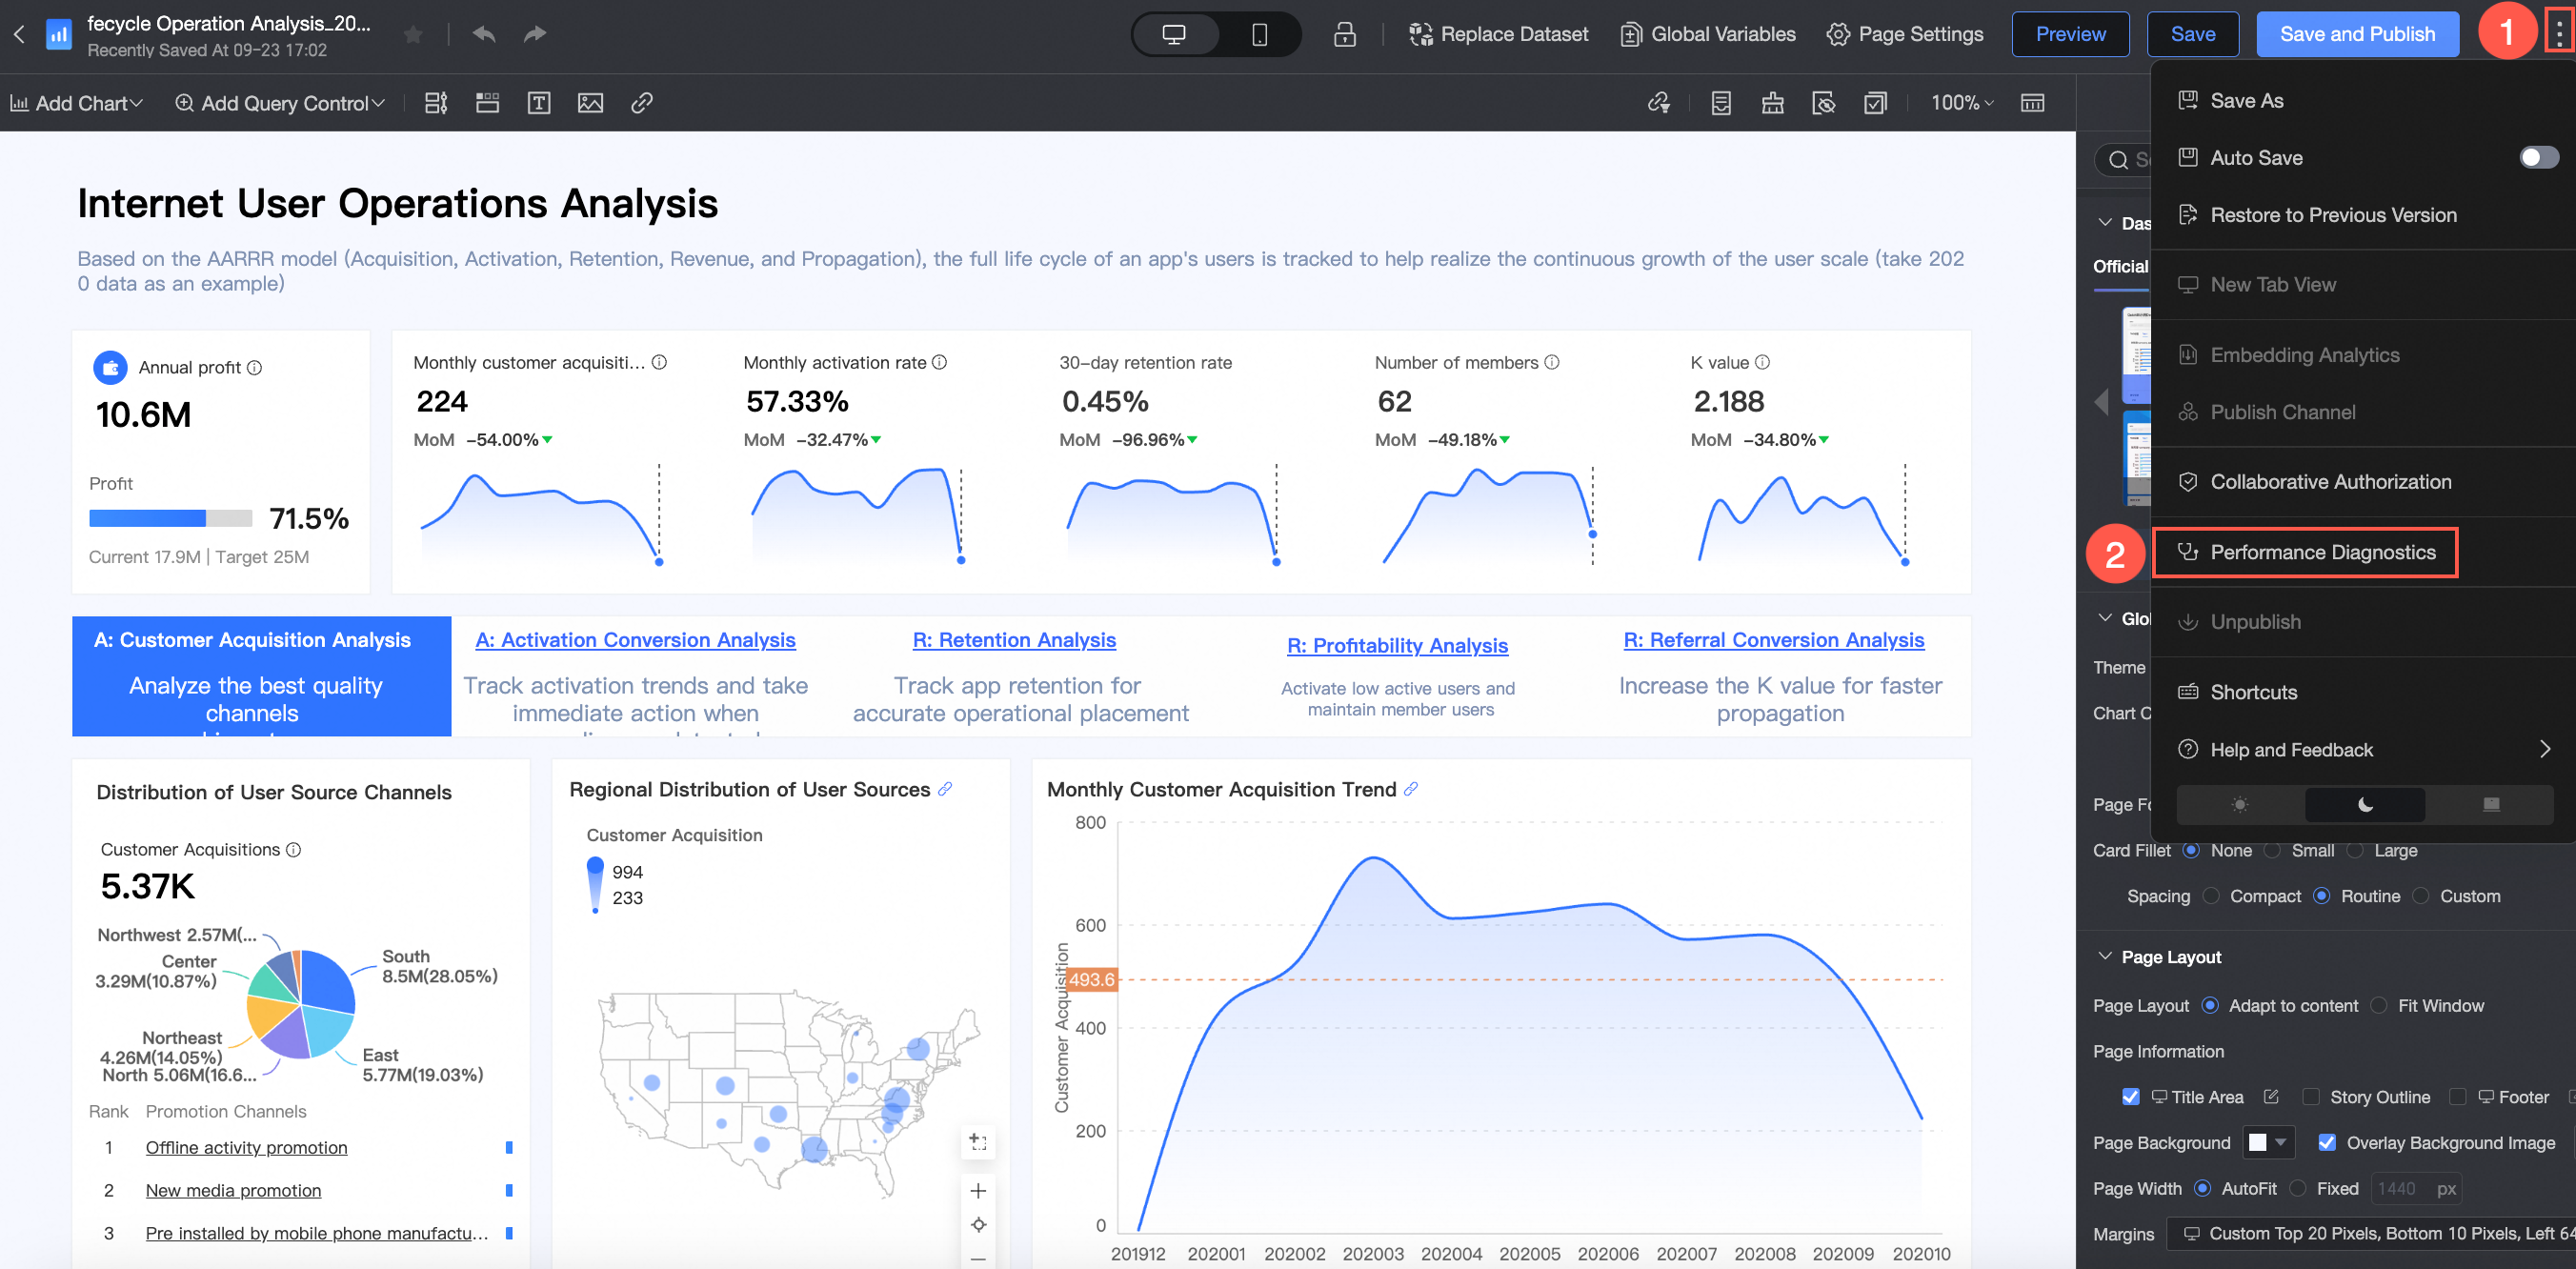
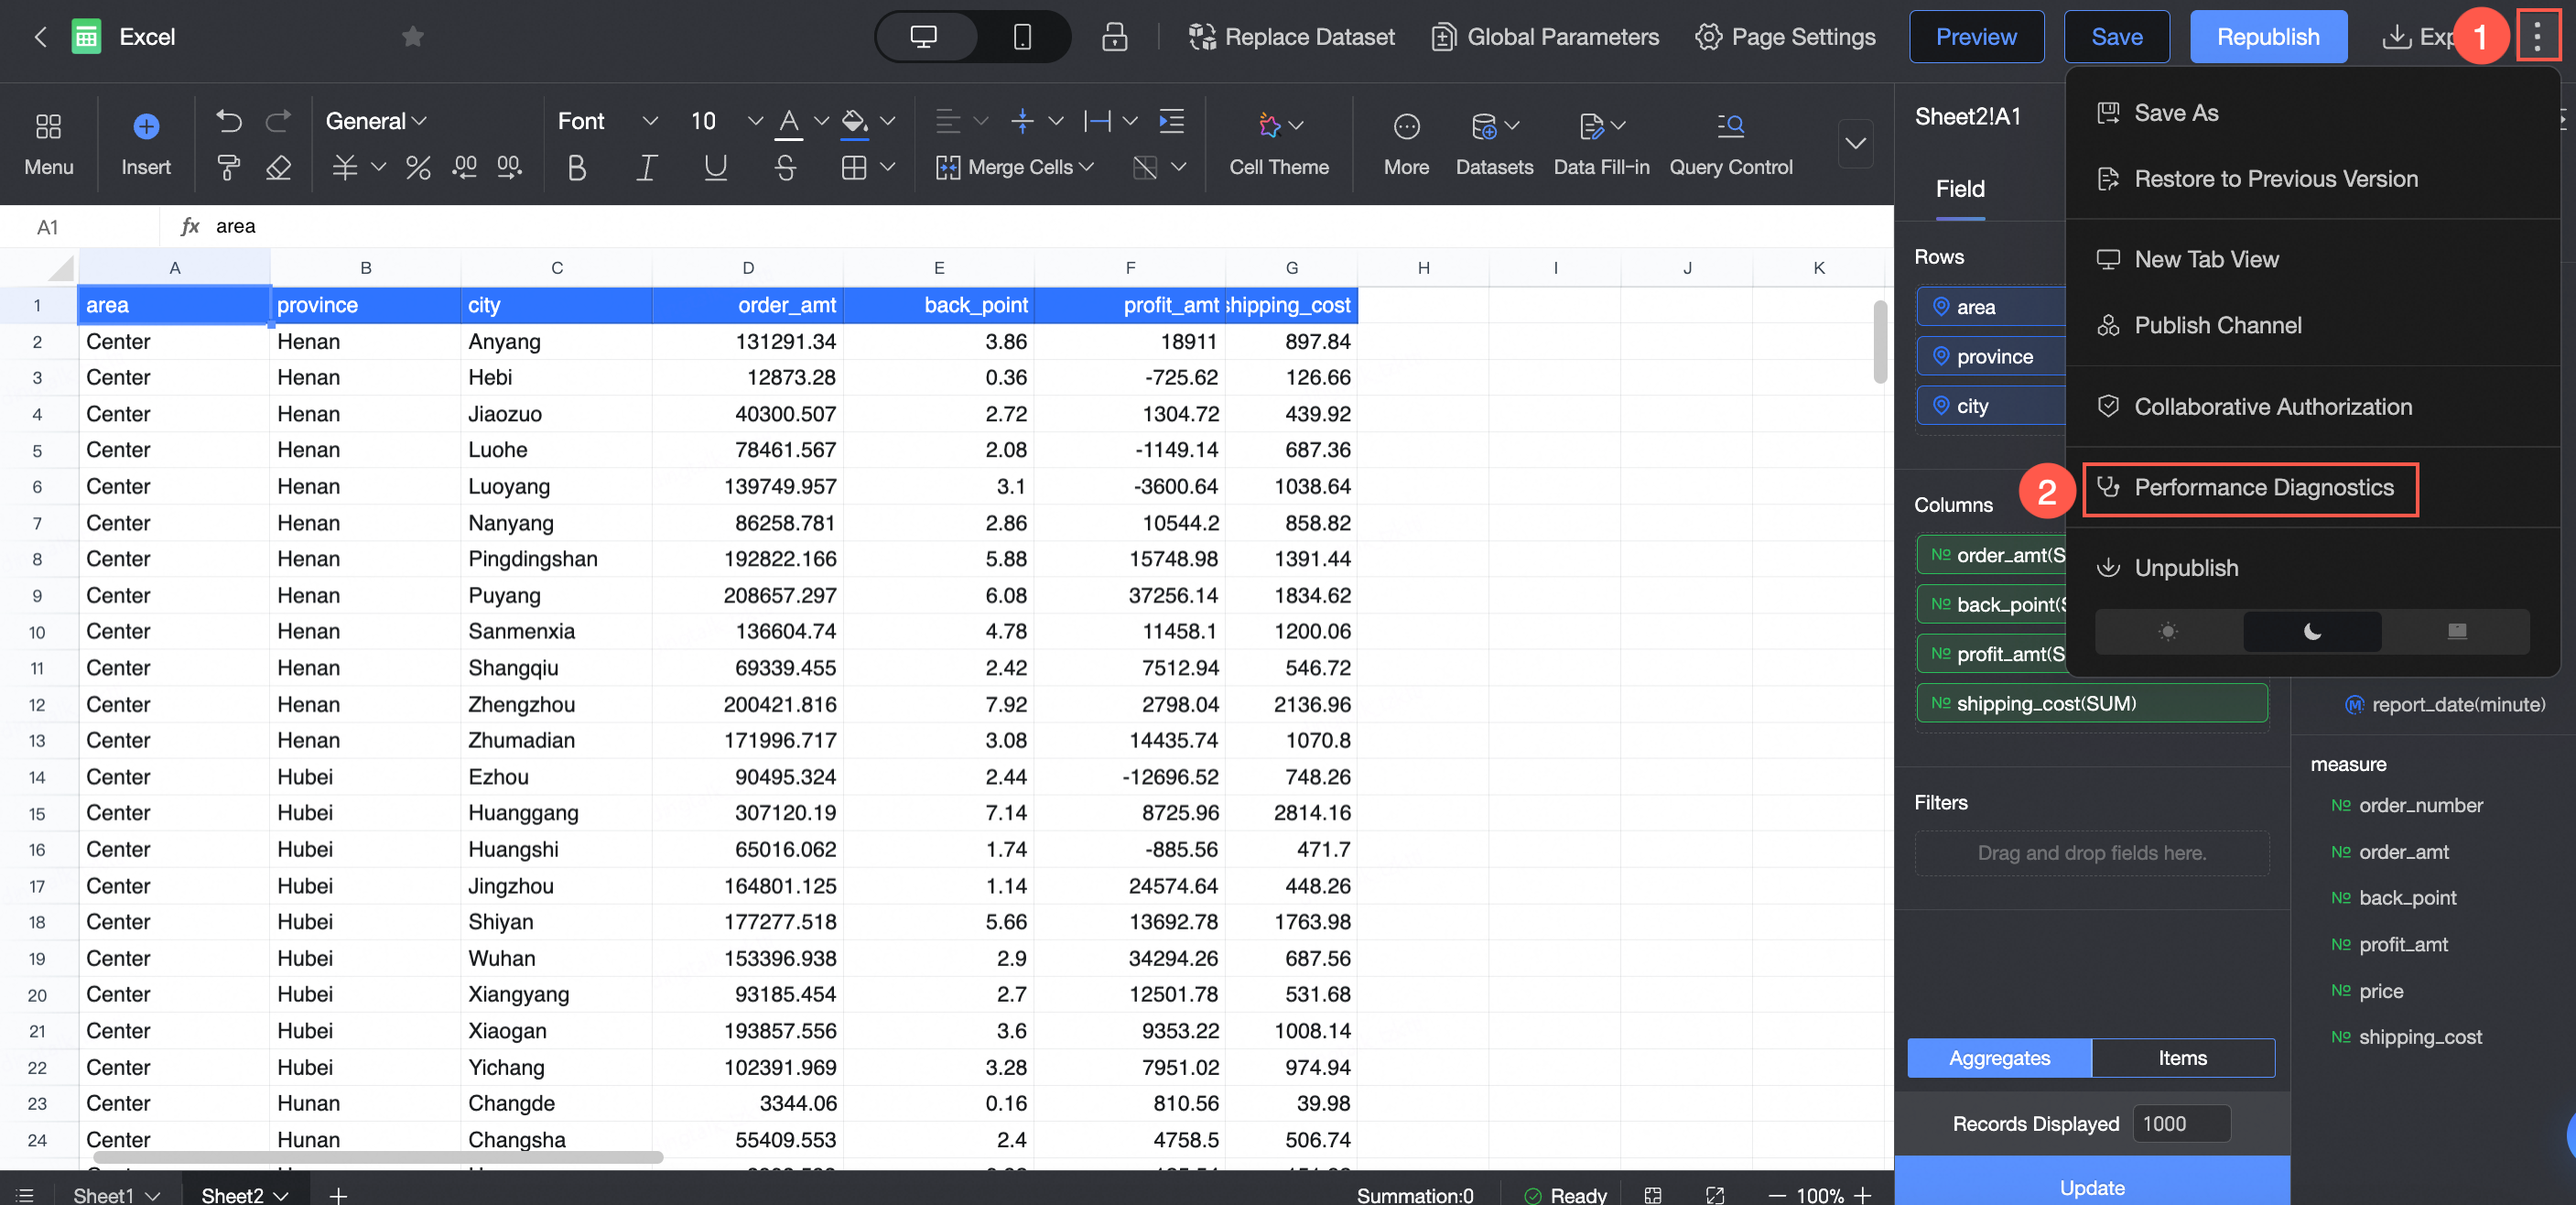
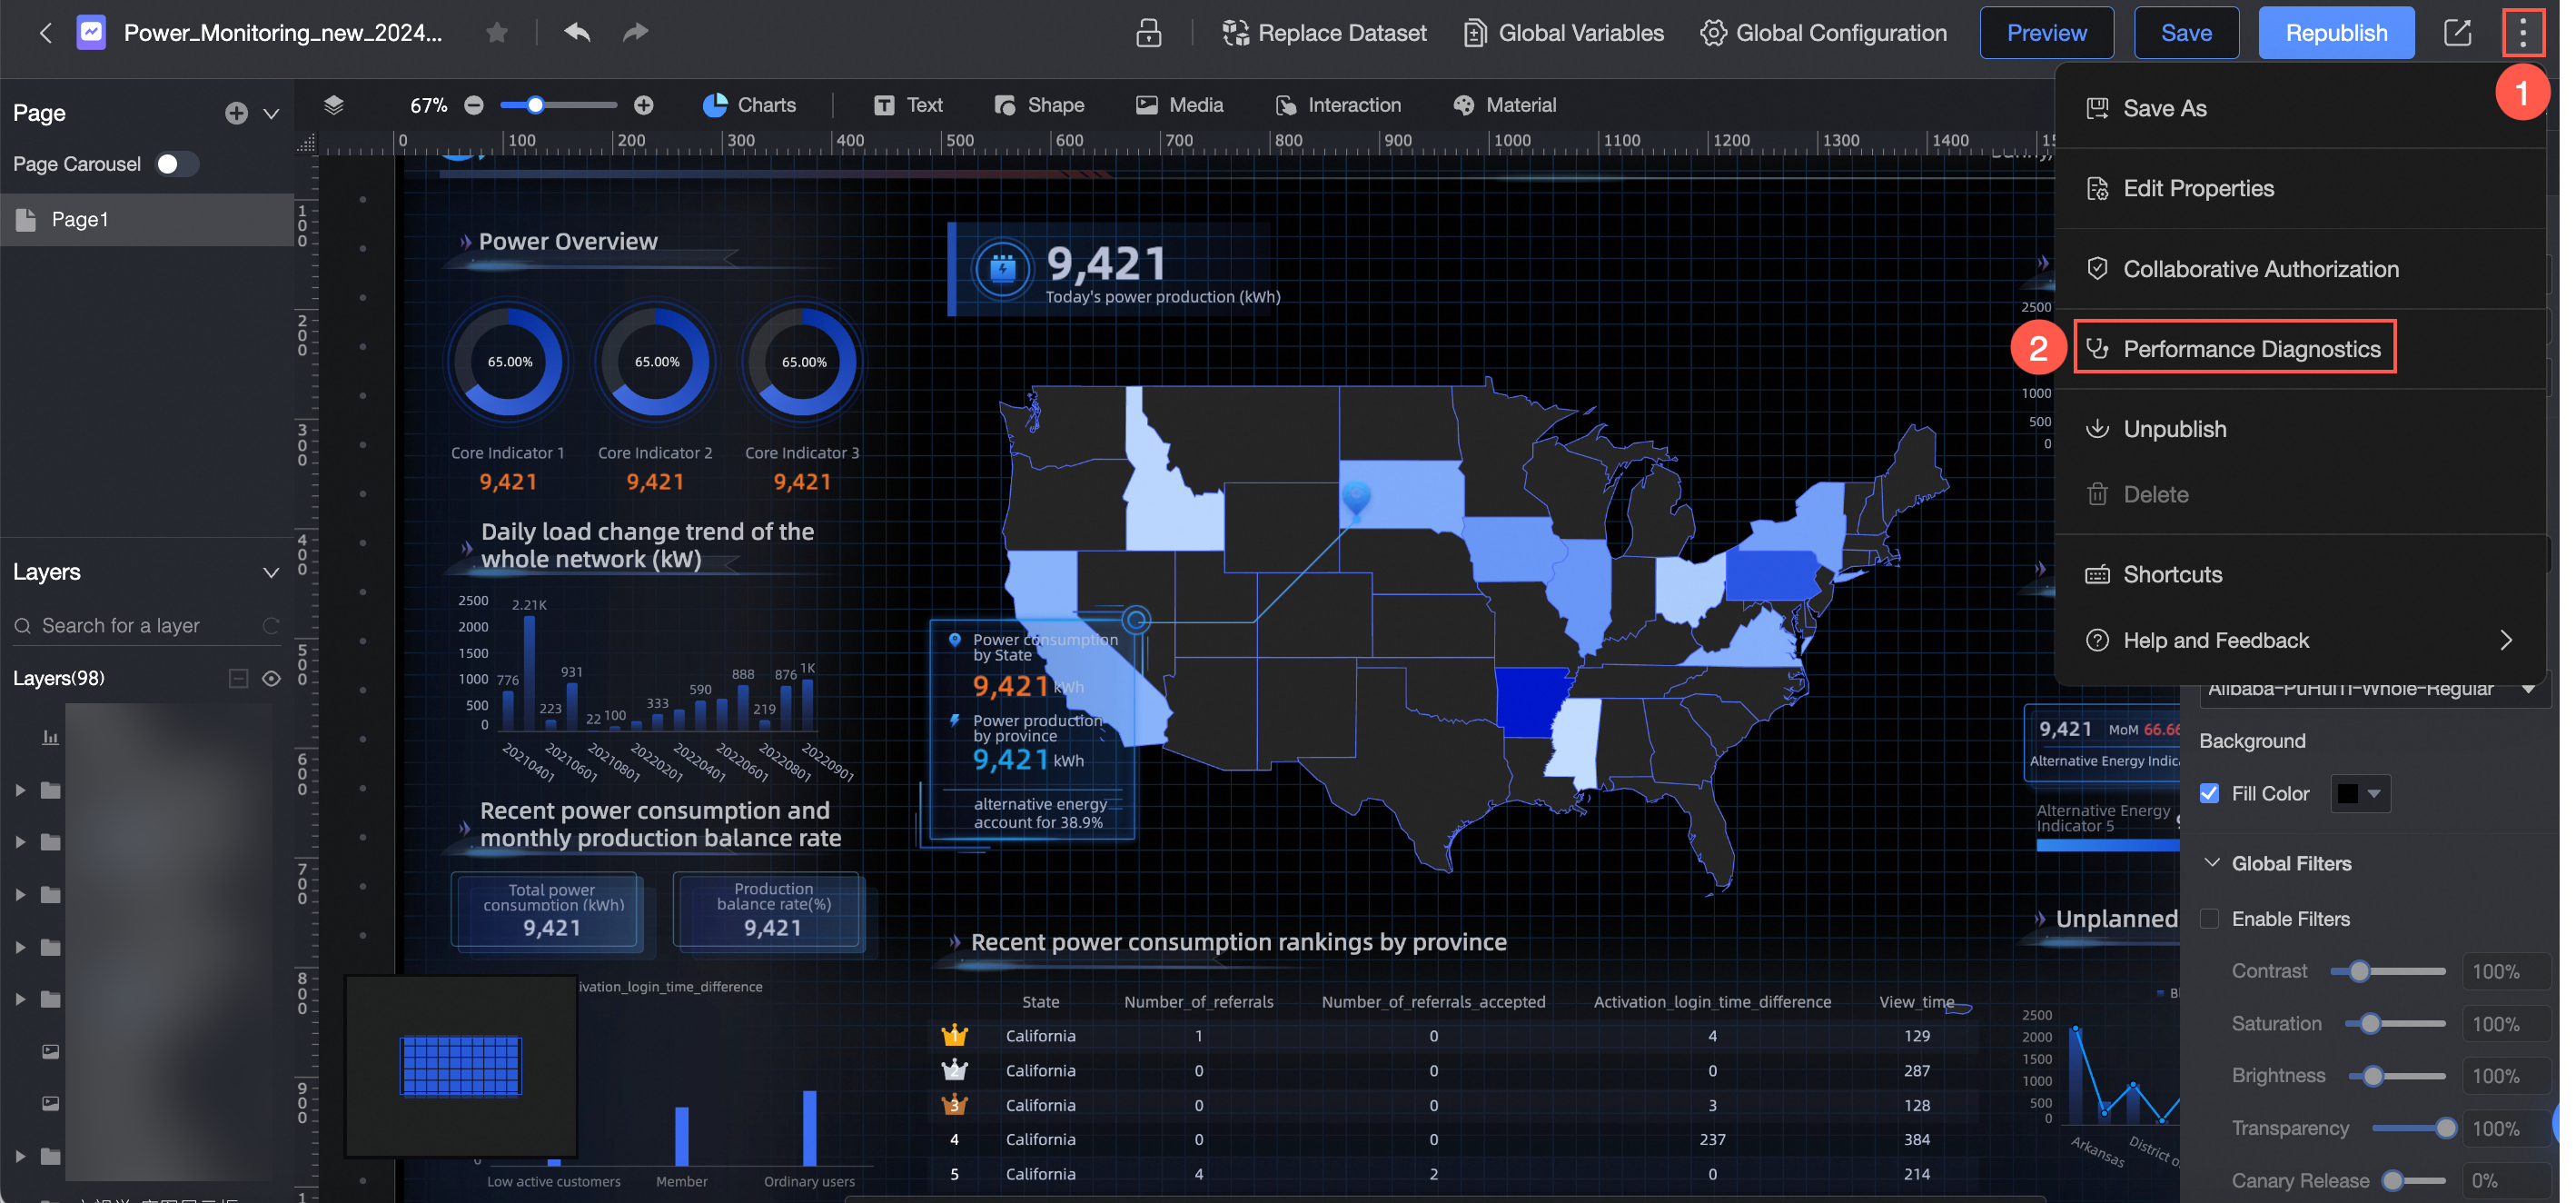
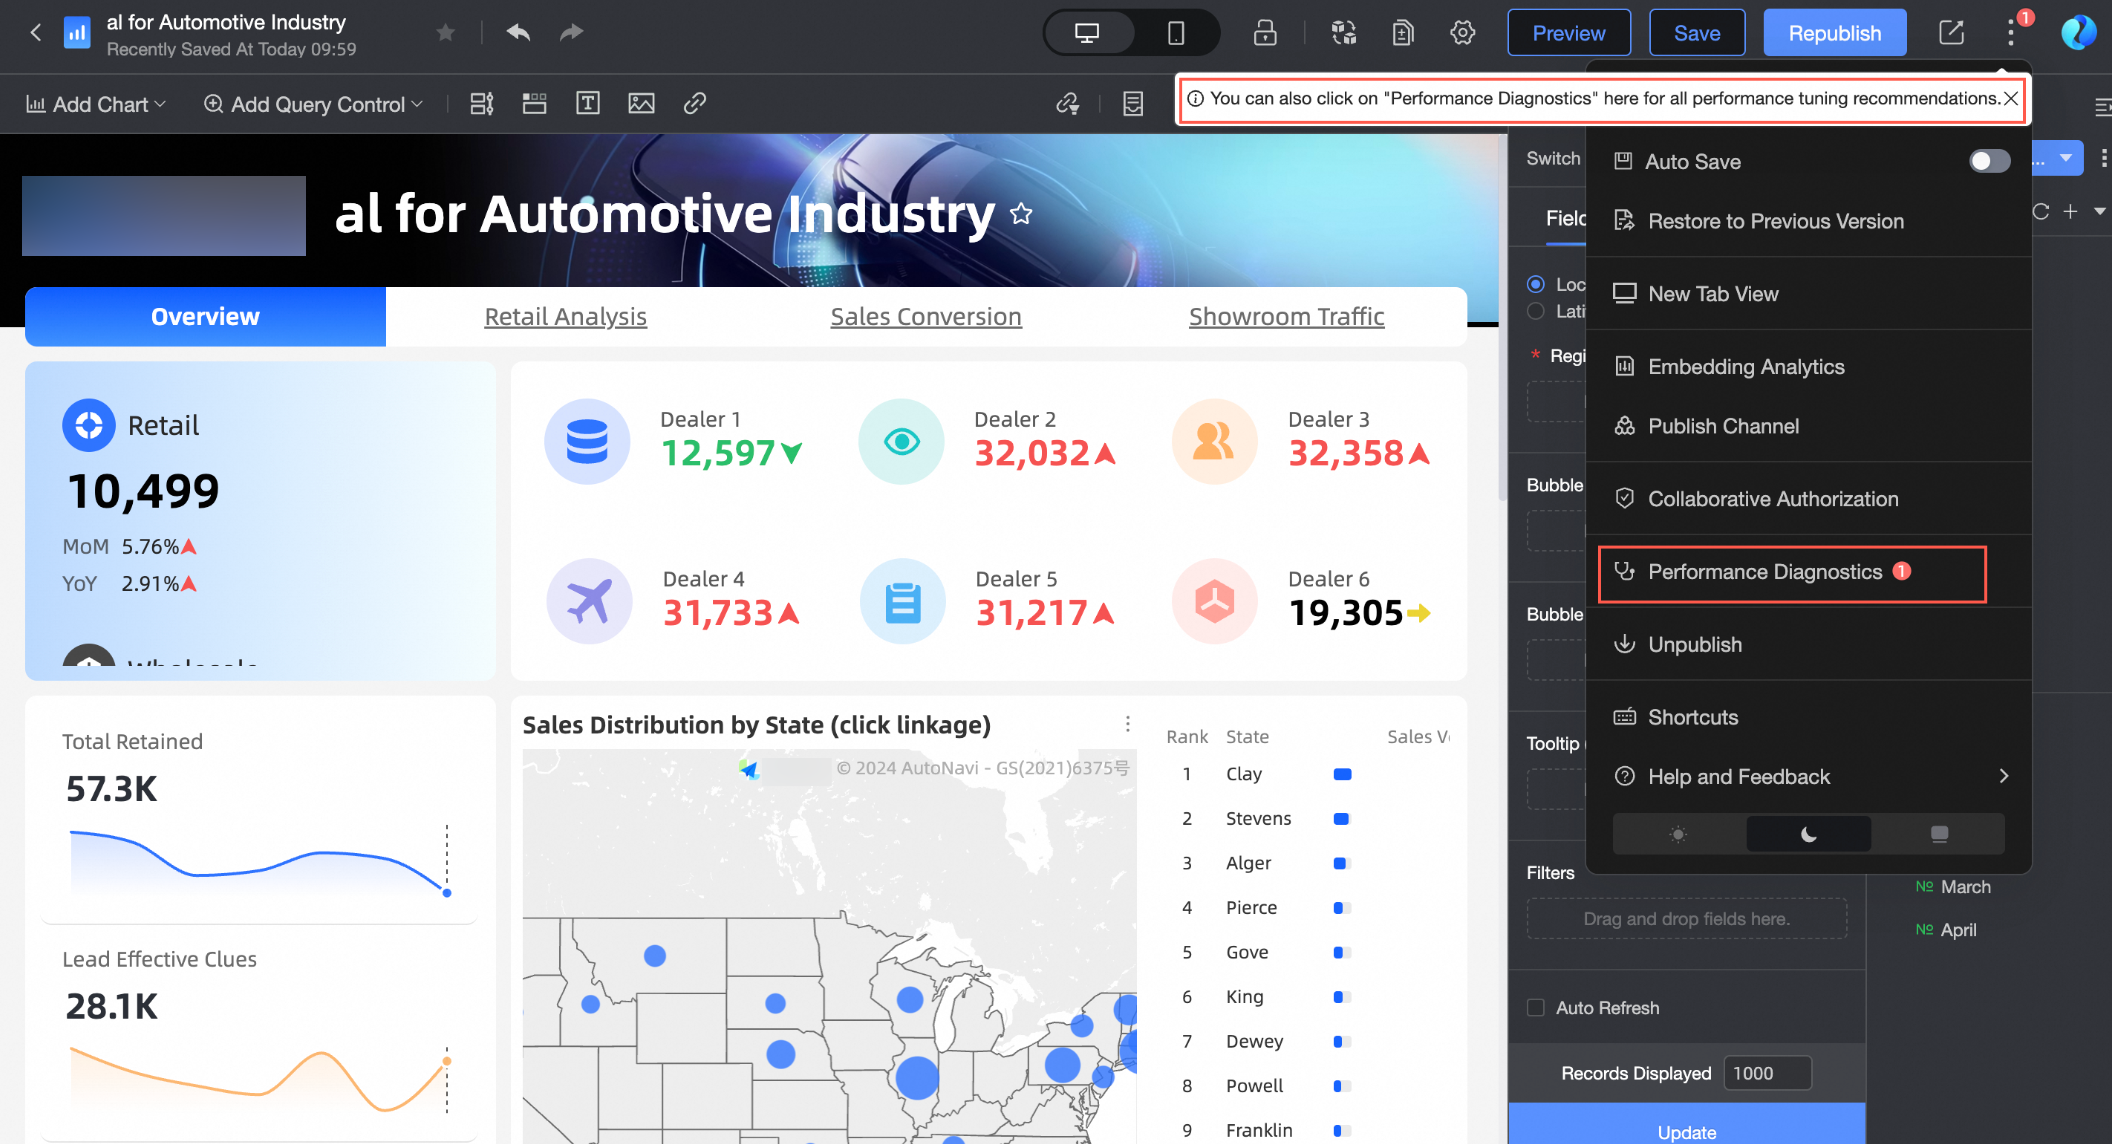
Access the performance diagnostics page for dashboards, workbooks, and data dashboards as shown below.
-
Dashboard performance diagnostics entry.
-
Workbook performance diagnostics entry
-
Data dashboard performance diagnostics entry
-
-
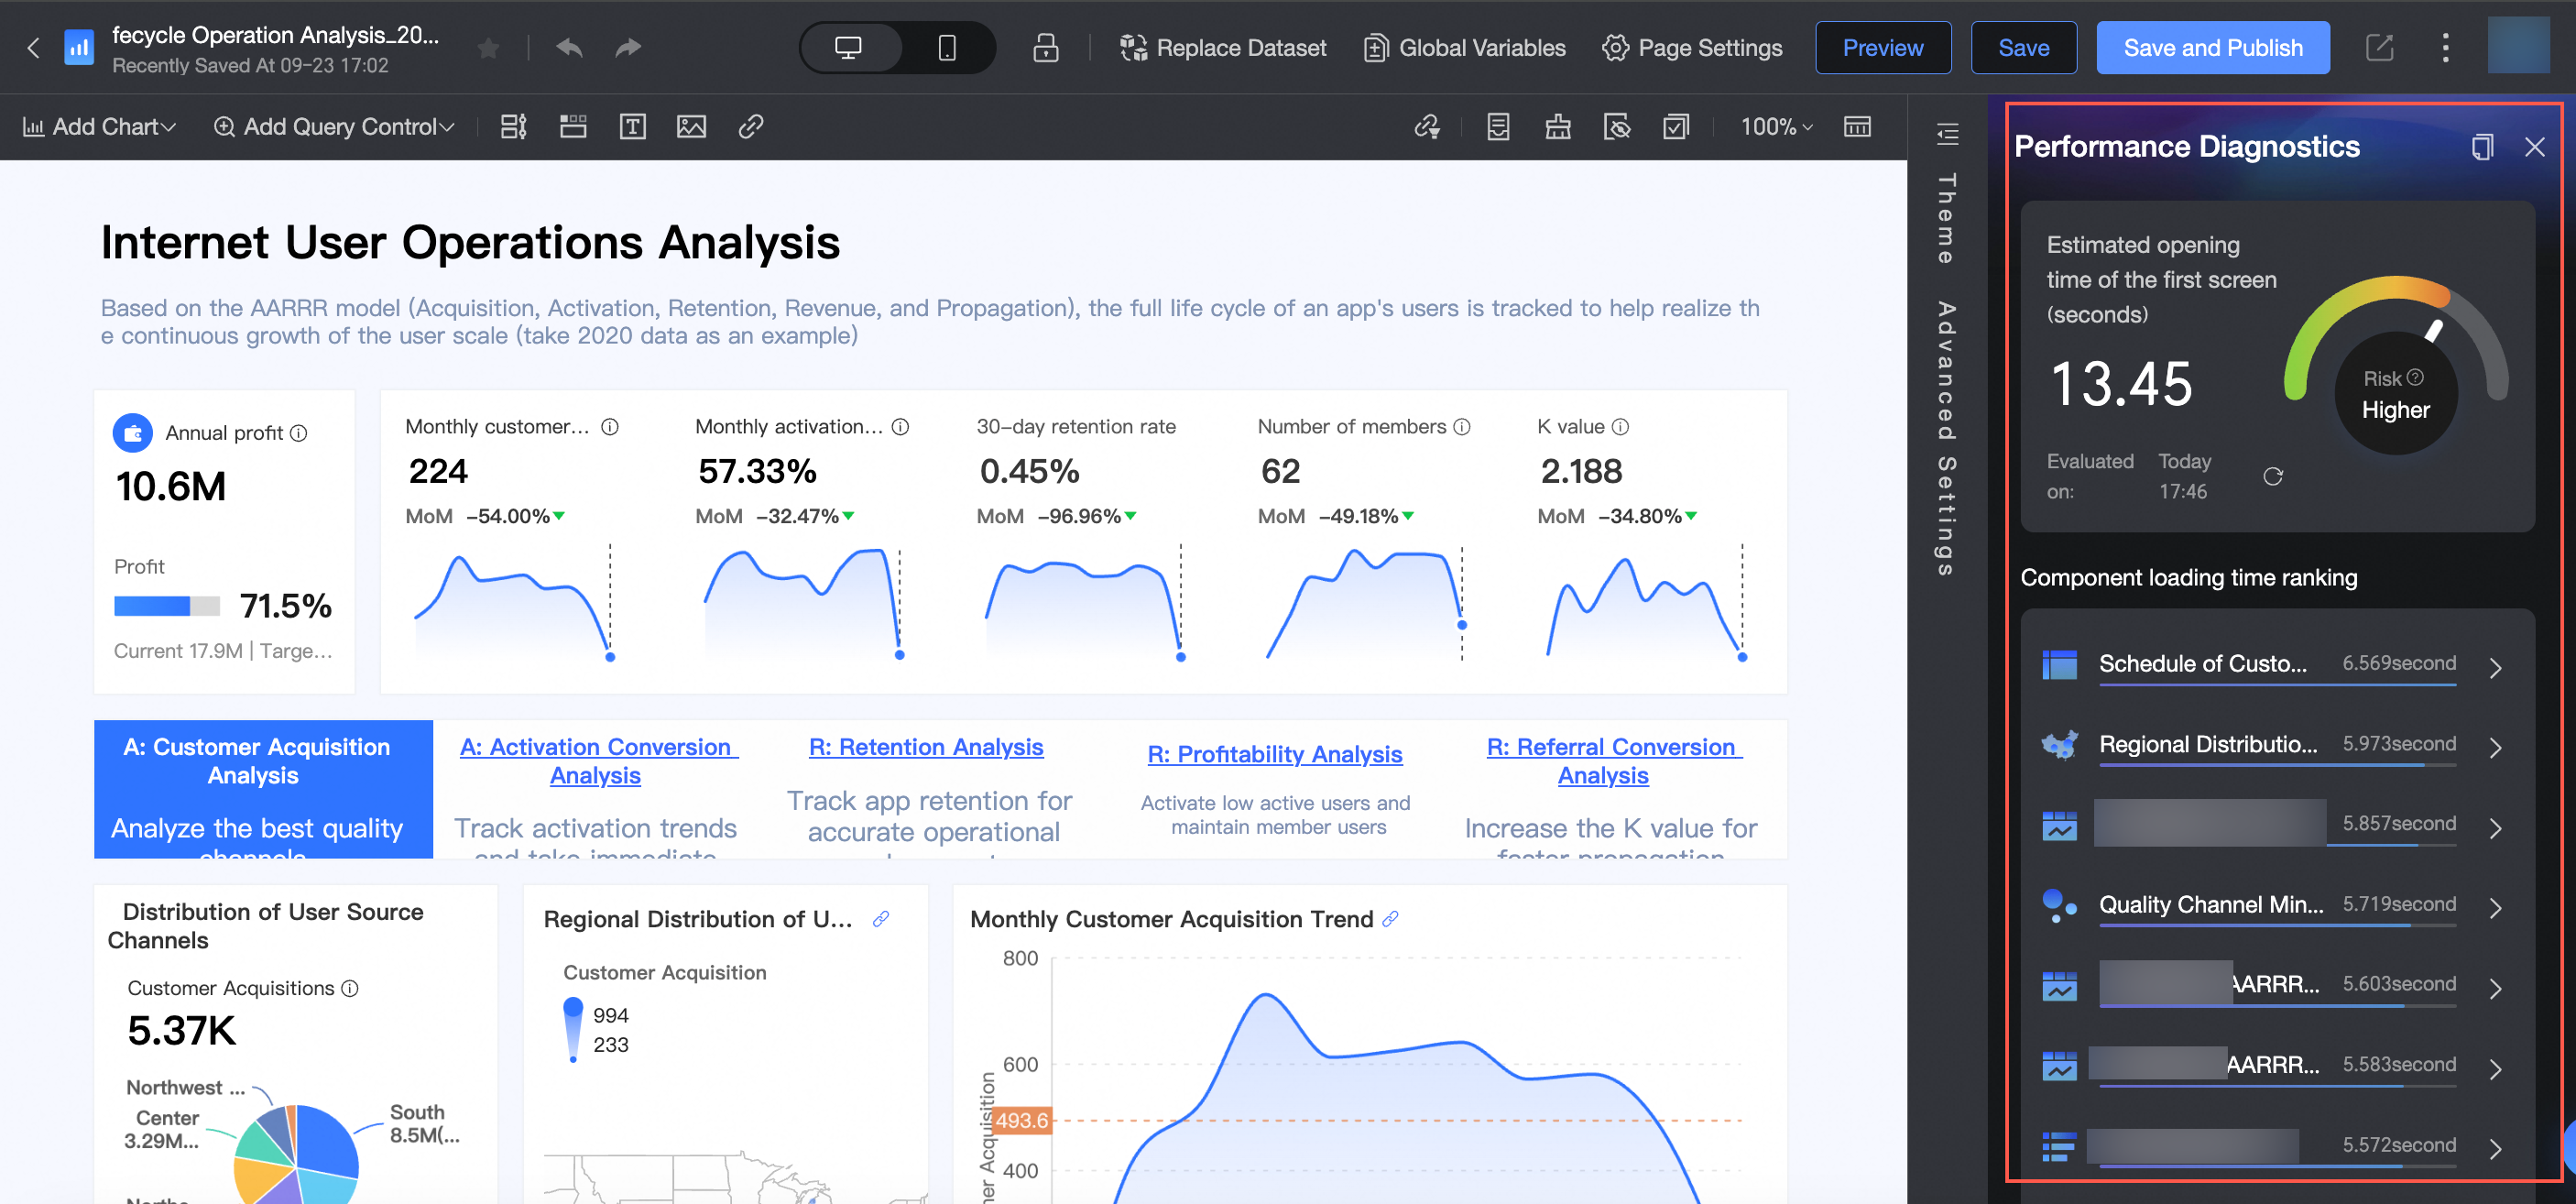
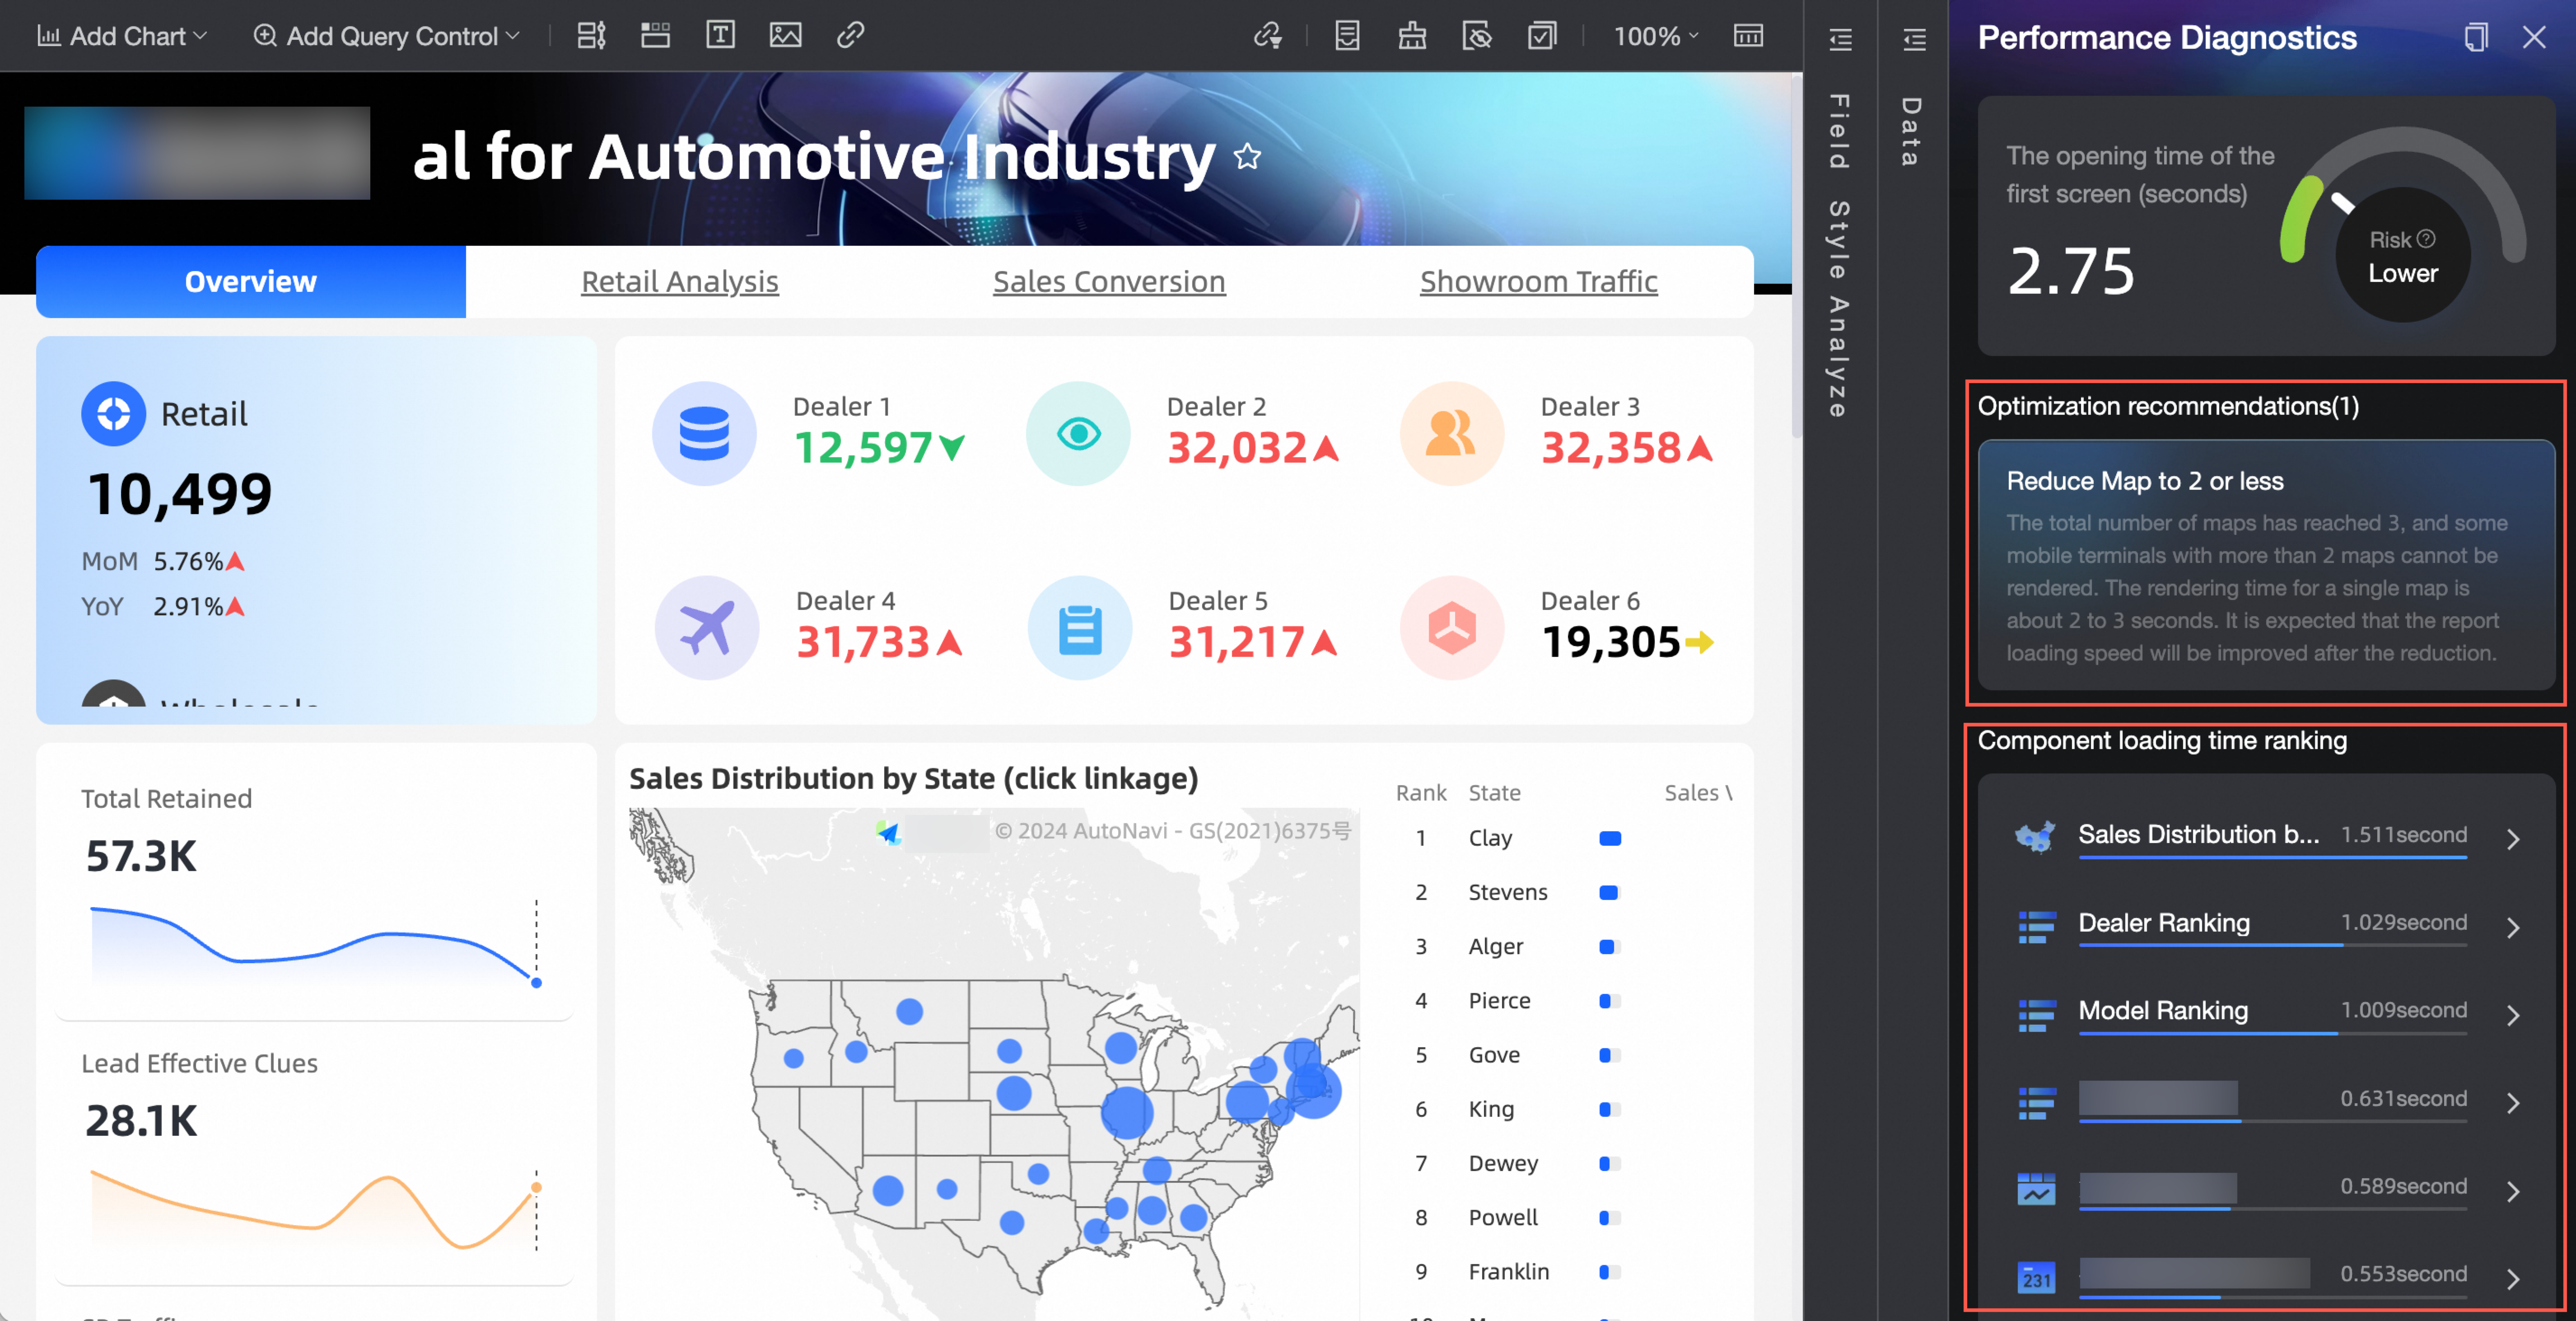
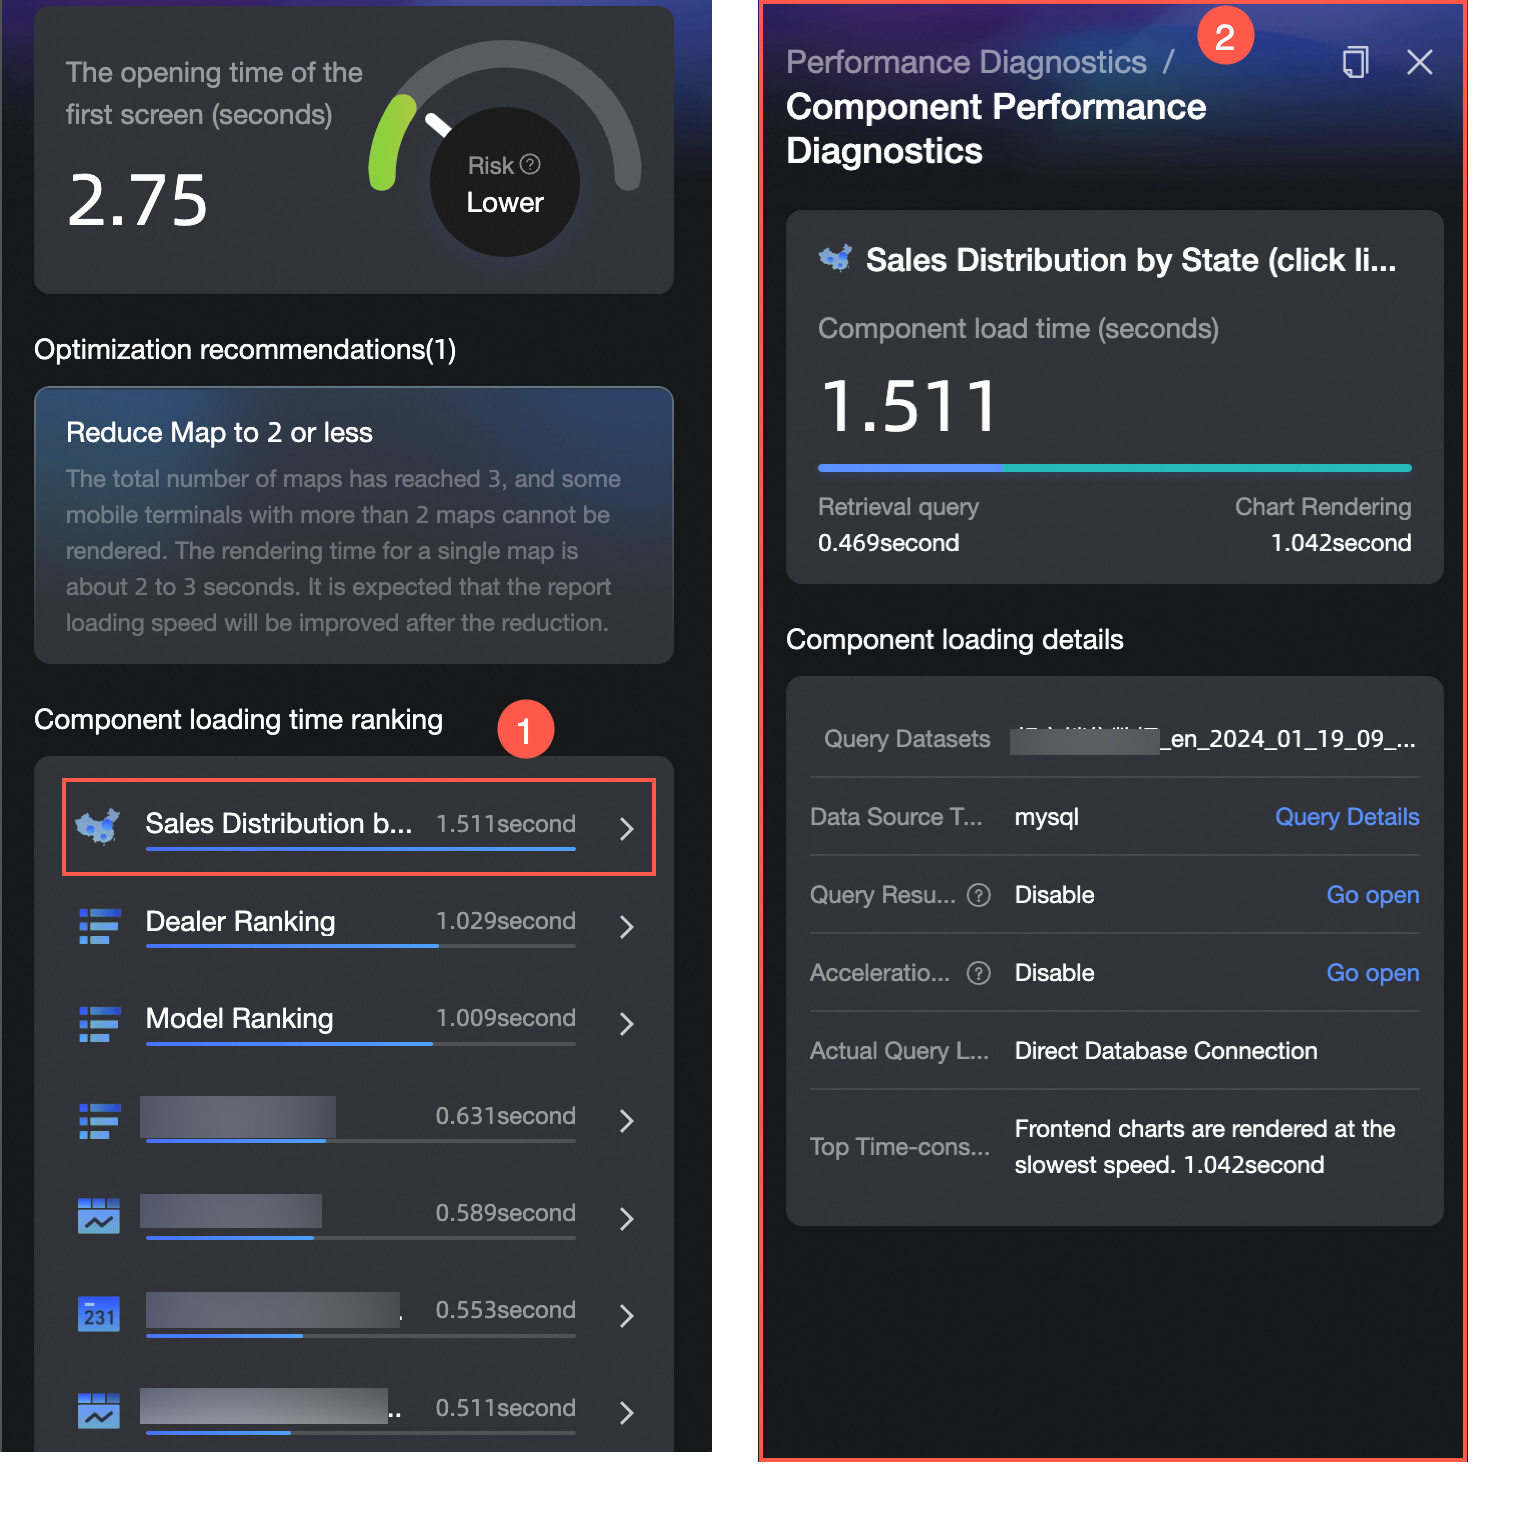
The performance diagnostics page displays the report's estimated first screen opening duration, risk assessment level, and component loading duration ranking.
-
To inspect a specific chart's performance, click it in the component loading duration ranking to open the component performance diagnostics page.
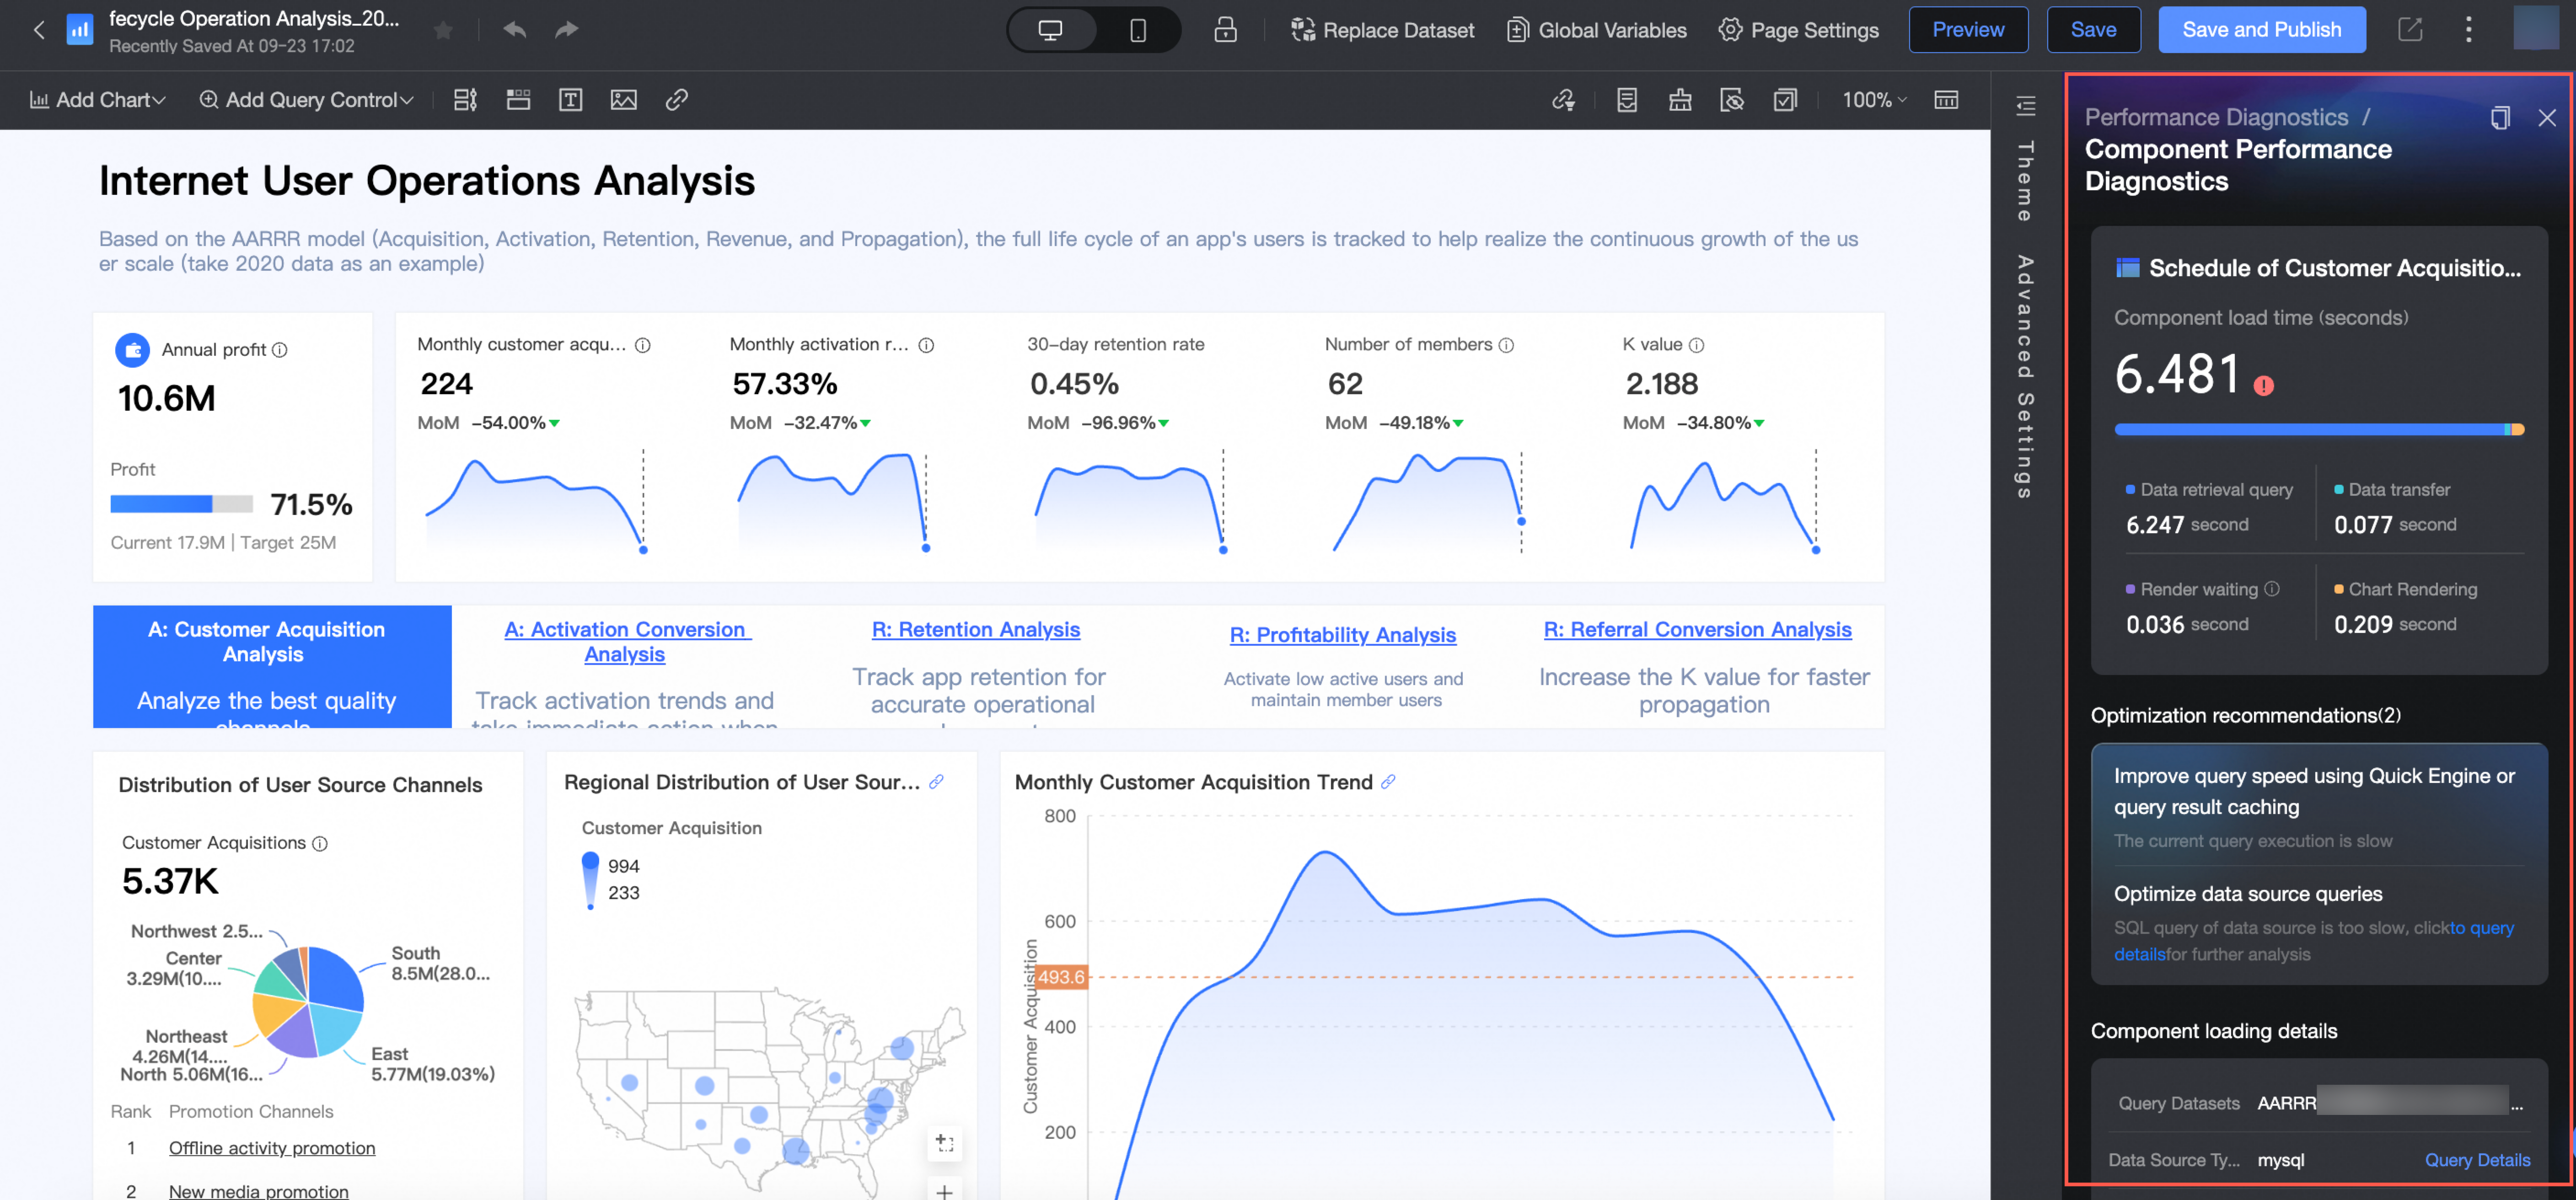
In dashboards, you can also open the component performance diagnostics page for a single component by clicking the
 icon to the right of the chart, as shown below.
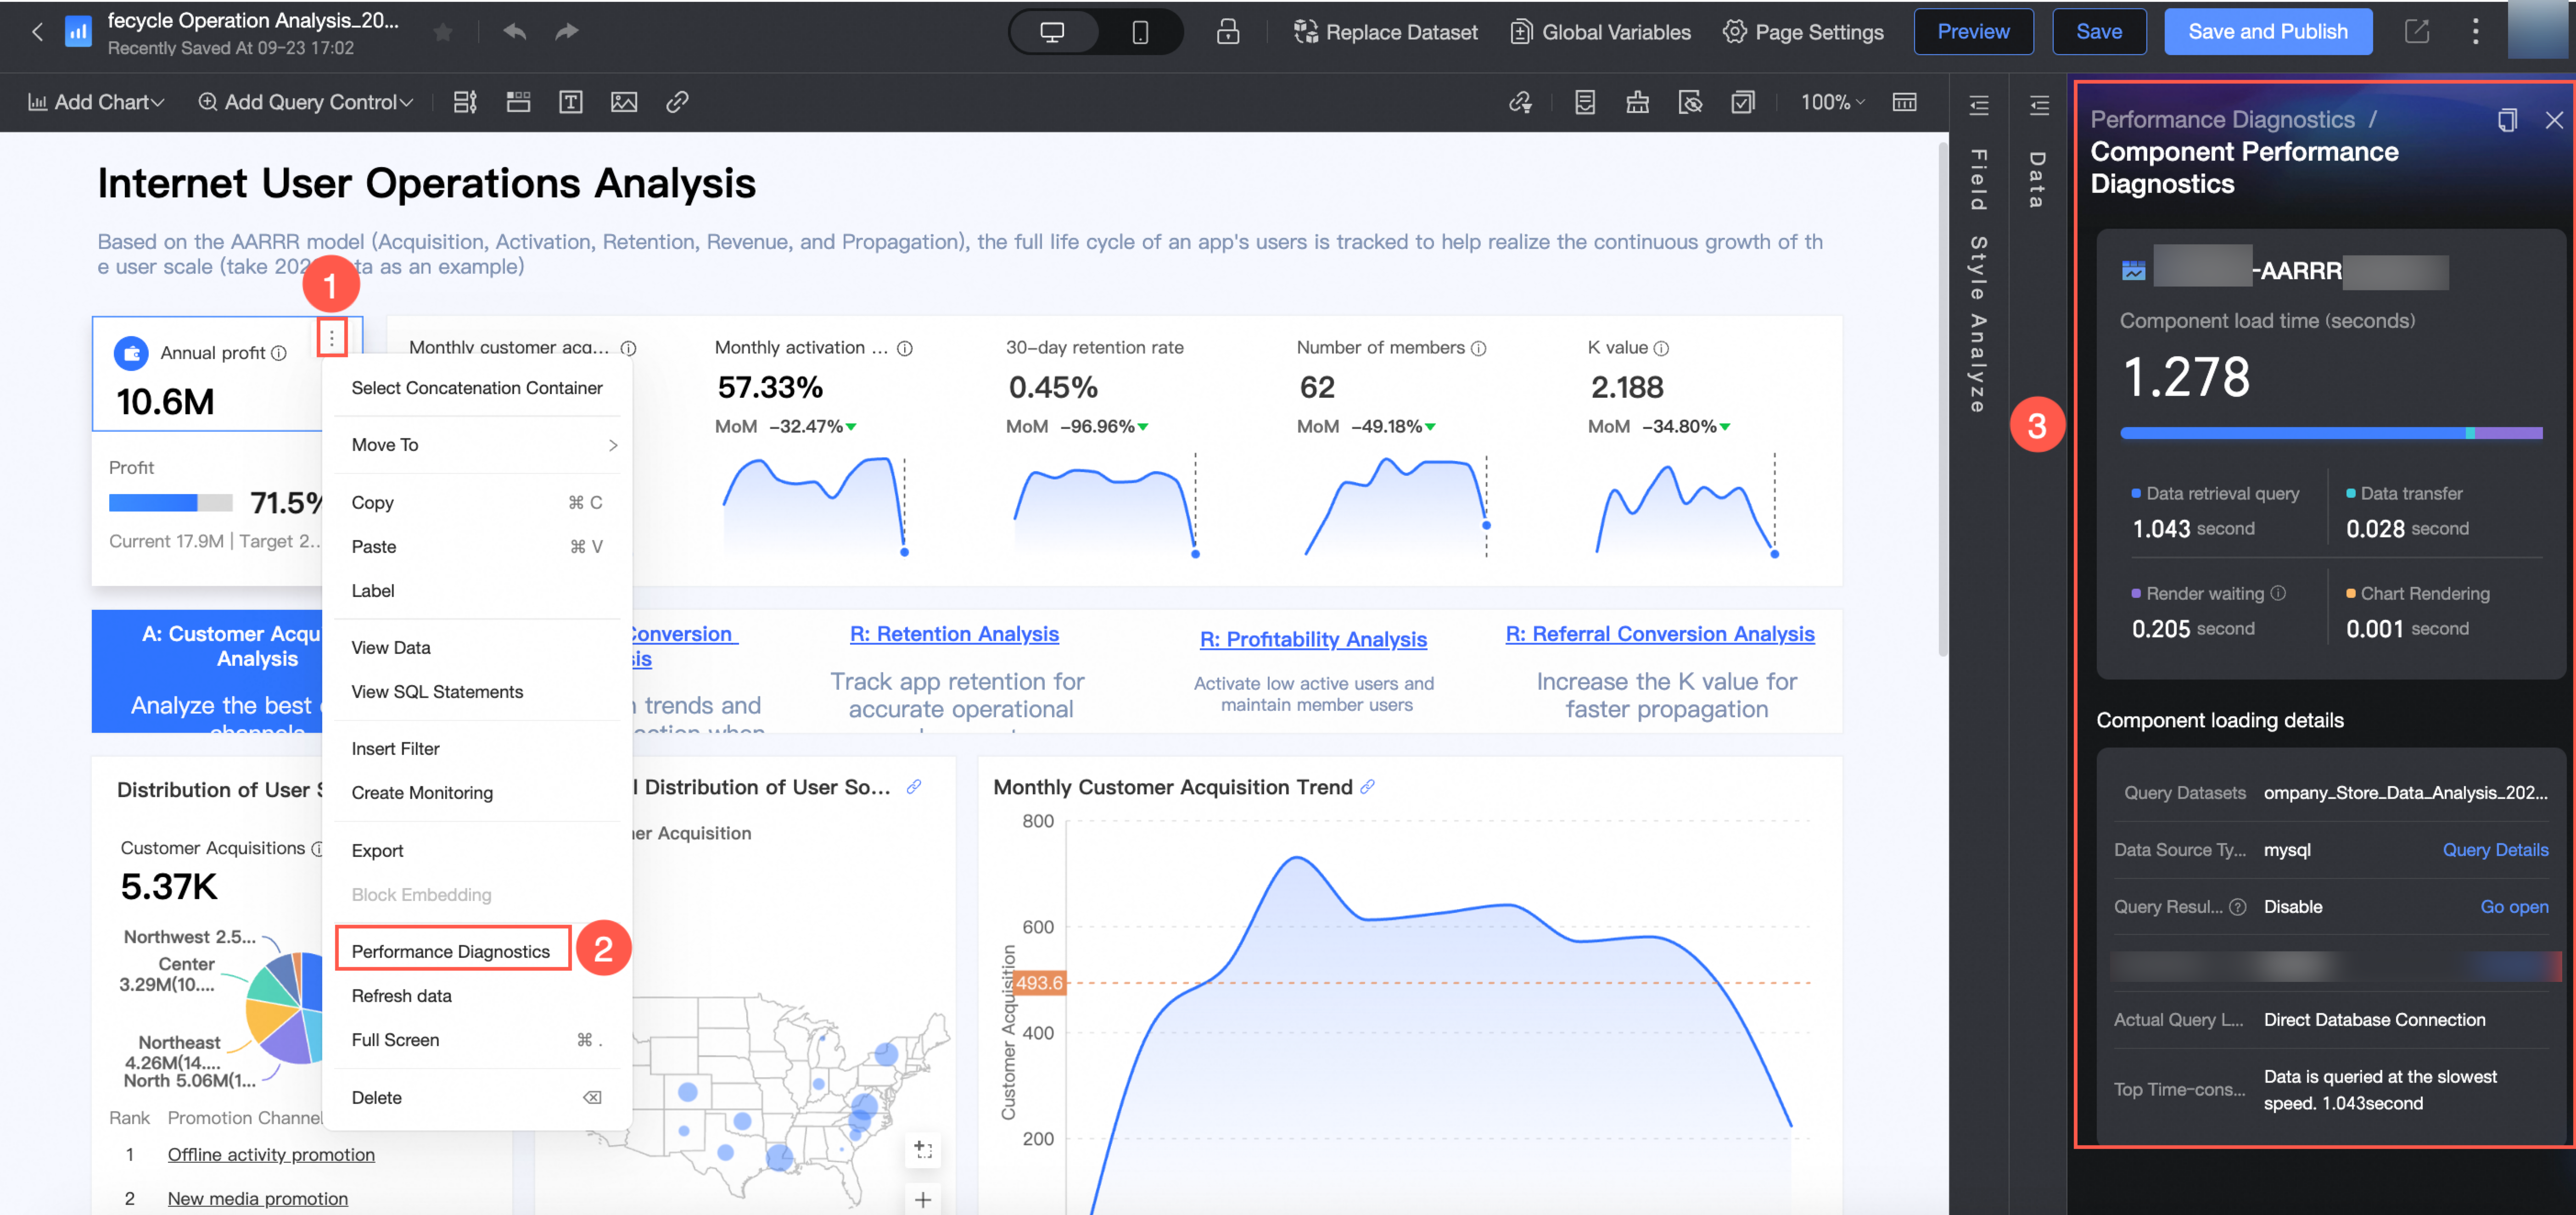
Functionality
-
Estimated first screen opening duration is the time required to load and display the initial view of the report. Compare it with the risk benchmark assessment value to evaluate the report's performance risk.
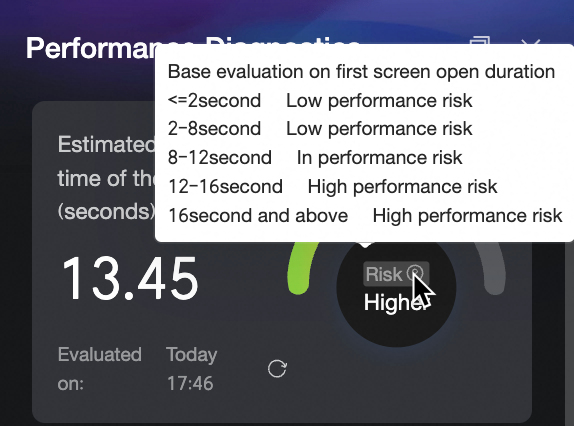
To reassess, click the
 icon next to the assessment time.
 -
If the report contains elements that may affect performance, performance diagnostics provides targeted optimization suggestions. The component loading duration ranking lists load times for each component, helping you prioritize optimization efforts.
-
Click a chart in the component loading duration ranking to view the component loading details page.
Parameter name
Parameter description
Query dataset
The name of the dataset used by the current component.
Data source type

The data source type of the current component, such as MySQL.
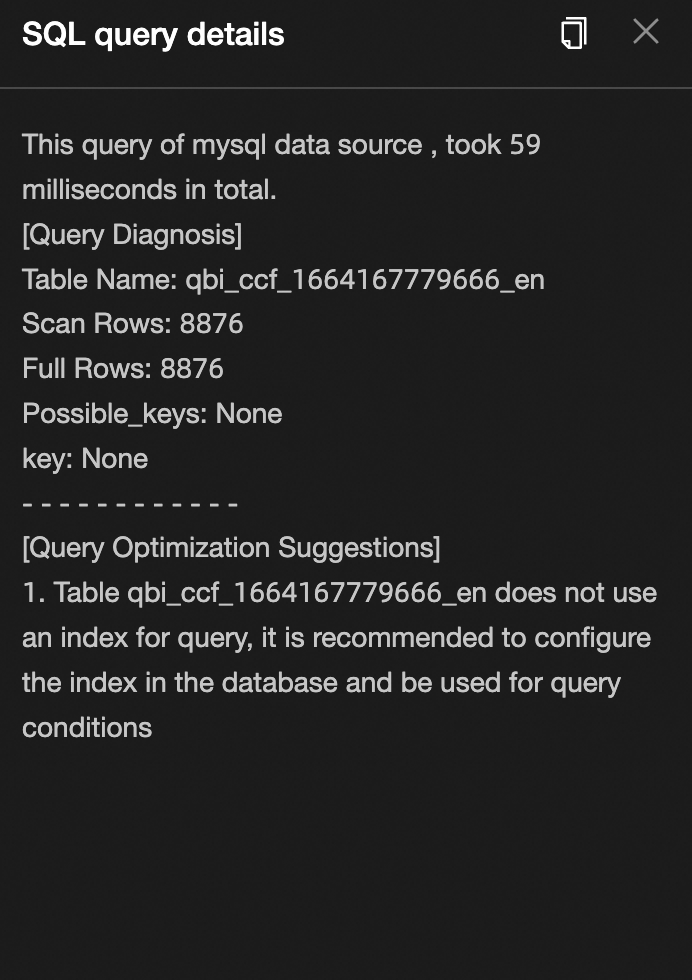
Click query details to view data source time consumption, query diagnosis, and optimization suggestions.
Query result cache
Query cache: Caches dataset query results to speed up report access and reduce database load.
If query cache is not enabled, an Enable option appears as shown below.

For configuration details, see Configure Quick engine.
Quick engine
Quick engine: Periodically extracts data into the Quick engine for high-speed queries.
If Quick engine is not enabled, an Enable option appears as shown below.

For acceleration configuration details, see Configure Quick engine.
Actual query route
-
The actual query route for component data, such as direct connection to the database.

-
If Quick engine is enabled but the actual query route is a direct database connection, you can check the reasons for no acceleration.
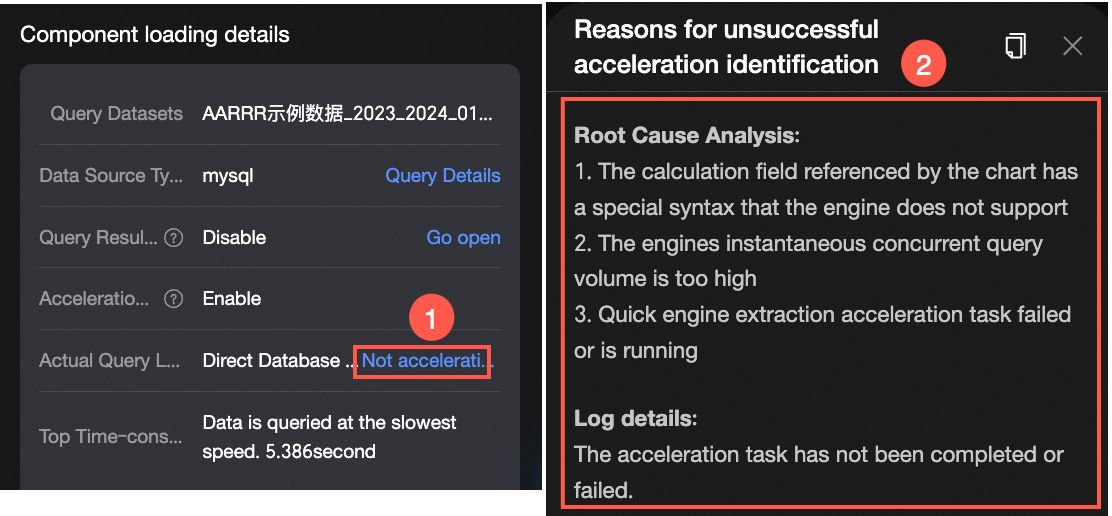
Top time-consuming route
The most time-consuming segment in the data query and processing pipeline and its duration. For example:

-
Specifications suggestions
While editing a dashboard, if you perform actions that could degrade report performance, such as adding too many charts or tab components, performance diagnosis displays a warning with the number of risk items.
-
An error message appears if a module contains too many components, as shown below:
 Additionally, optimization suggestions will be provided in the performance diagnostics list.
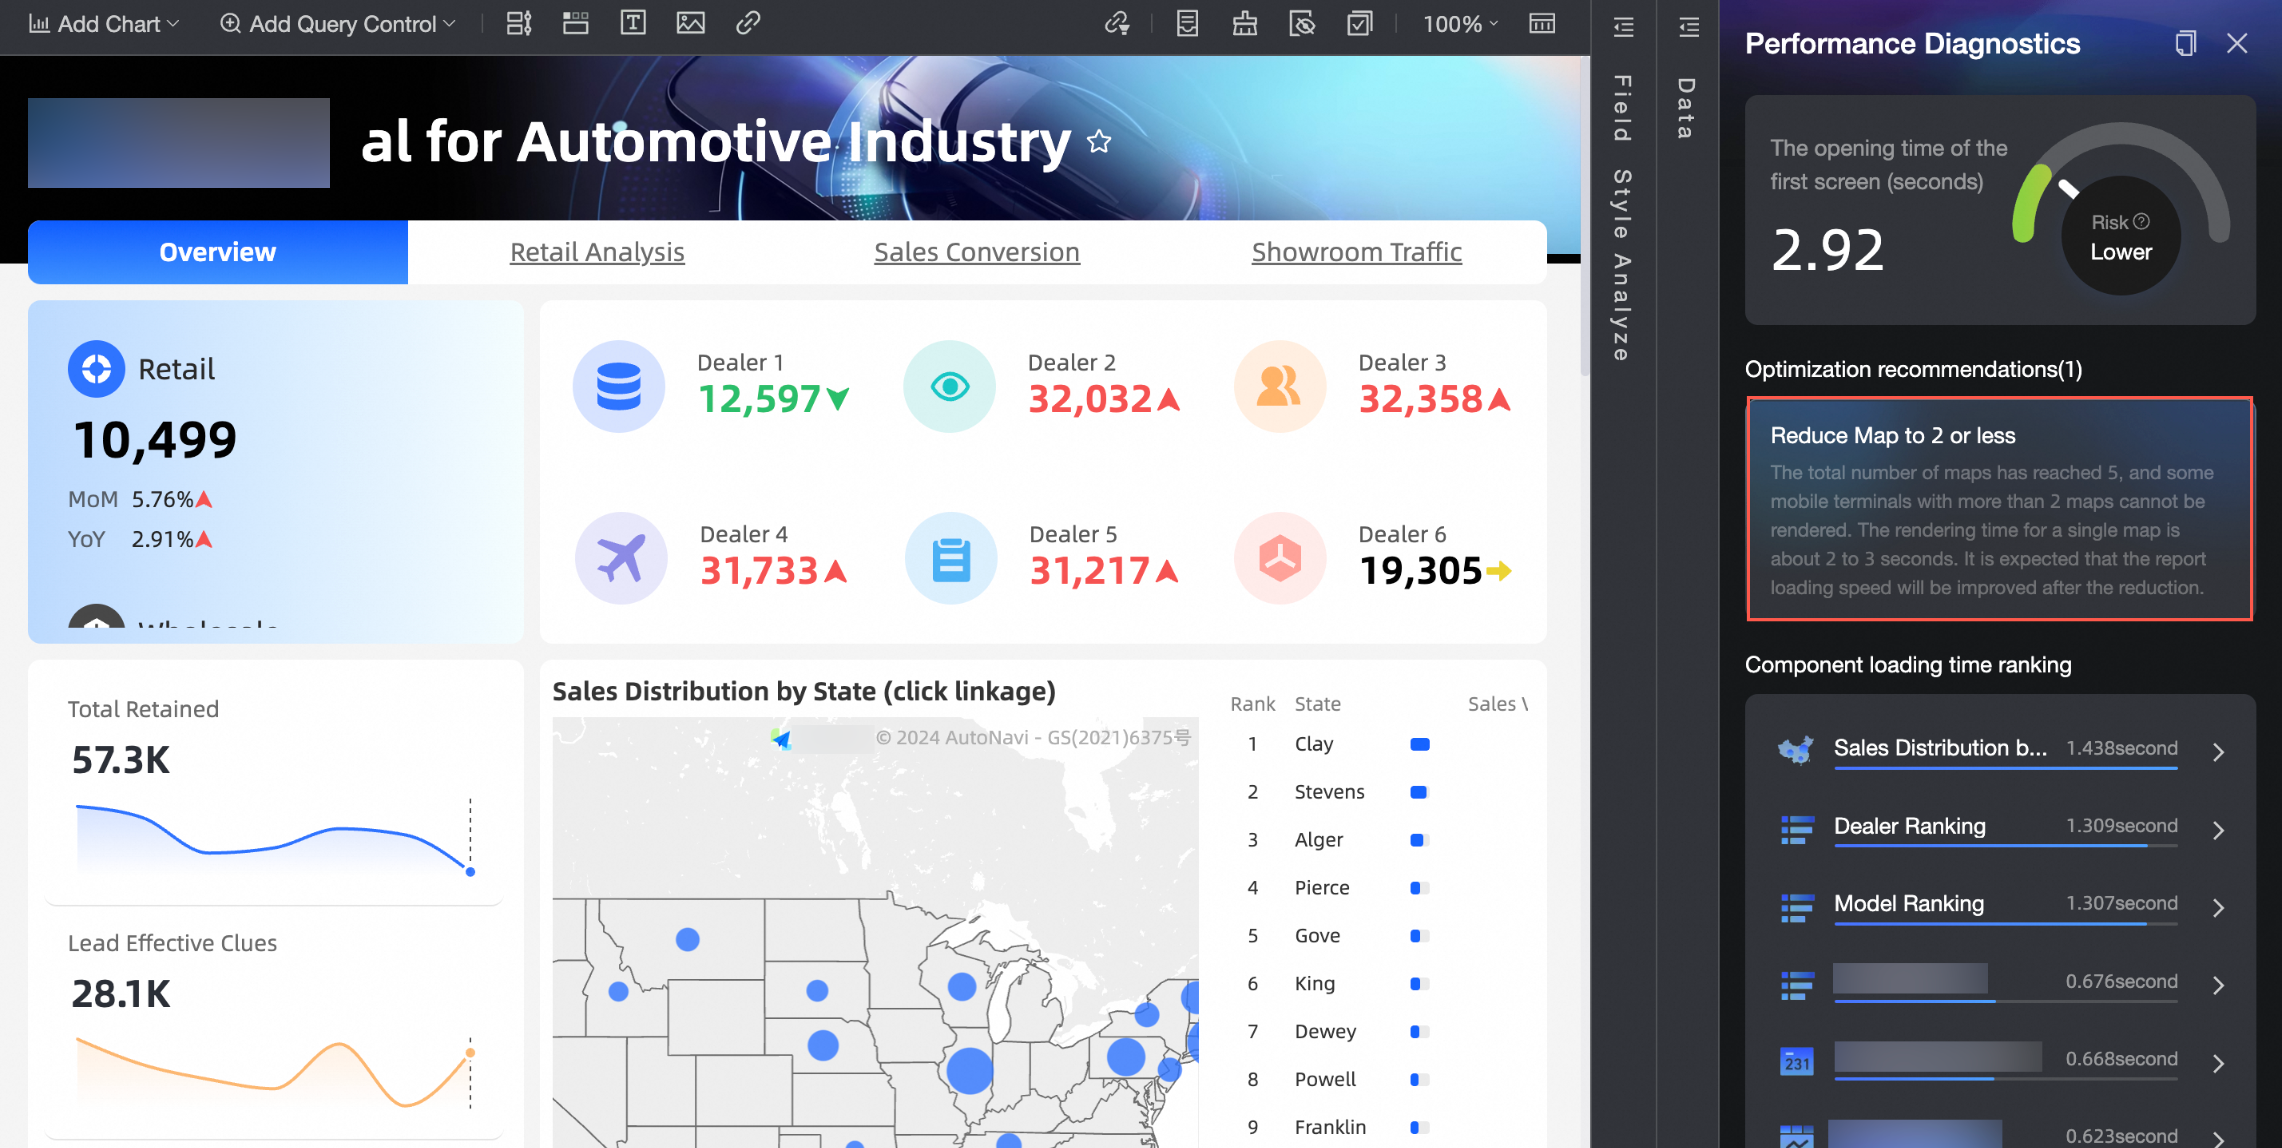
-
Follow the recommended specifications below when building reports to maintain performance.
Module
Content
Specification suggestion value
Dashboard
Chart
The number of charts and controls should be less than 100.
Map
The number of maps should be less than 2.
Tab label
The number of tab labels should be less than 50.
Cross table field
The number of cross table fields should be less than 100.
Detail table field
The number of detail table fields should be less than 100.
Indicator trend chart field
The number of indicator trend charts should be less than 100.
iframe
The number of embedded pages should be less than 5.
Query control
The number of query control elements should be less than 100.
Workbook
Sheet
The number of sheets should be less than 100.
Chart
The number of charts per sheet should be less than 20.
The total number of charts should be less than 100.
Floating image
The number of floating charts per sheet should be less than 50.
Dataset
The number of datasets per sheet should be less than 50.
Data dashboard
Page
The number of pages should be less than 5.
Chart
The number of charts per page should be less than 100.
iframe
The number of embedded pages should be less than 5.