Quick BI provides drill down, filter interaction, and redirection for multidimensional data analysis. With redirection, you can click a field value in a chart to navigate to a related report, page component, or external URL with matching filters applied.
Scenarios
When viewing your company’s sales dashboard, you can redirect from a field to view detailed order information. For example, click Order Information in a cross table, then click Office Supplies. Quick BI automatically redirects you to the Order Profit Details report and displays only orders where the Product Type is Office Supplies.
Limits
The following chart types support redirection:
-
Tables: cross tables, detail tables, multidimensional analysis tables, heatmaps.
-
Metric charts: scorecards, metric trends charts, metric relationship charts.
-
Line/area charts: line charts, area charts, stacked area charts, 100% stacked area charts, combination charts.
-
Column/bar charts: column charts, stacked column charts, 100% column charts, circular bar charts, leaderboards, bar charts, stacked bar charts, 100% bar charts, waterfall charts, bullet charts, box plots.
-
Pie/doughnut charts: pie charts, rose charts, sunburst charts, radar charts, treemap charts.
-
Bubble/scatter charts: bubble charts, scatter charts, faceted scatter charts.
-
Funnel/conversion charts: funnel charts, comparative funnel charts.
-
Geographic charts: colored maps, bubble maps, building heatmaps, symbol maps.
-
Other charts: word clouds.
Configure and Preview Redirection
You can configure redirection to go to another page inside Quick BI, to a component on the same page, or to an external URL.
Operation Entry
-
In edit mode for the Company Data Dashboard, select the cross table Order Information, then click the Analyze tab (①).
-
Click the
 icon (②) after Redirect to open the chart redirect settings page (③).
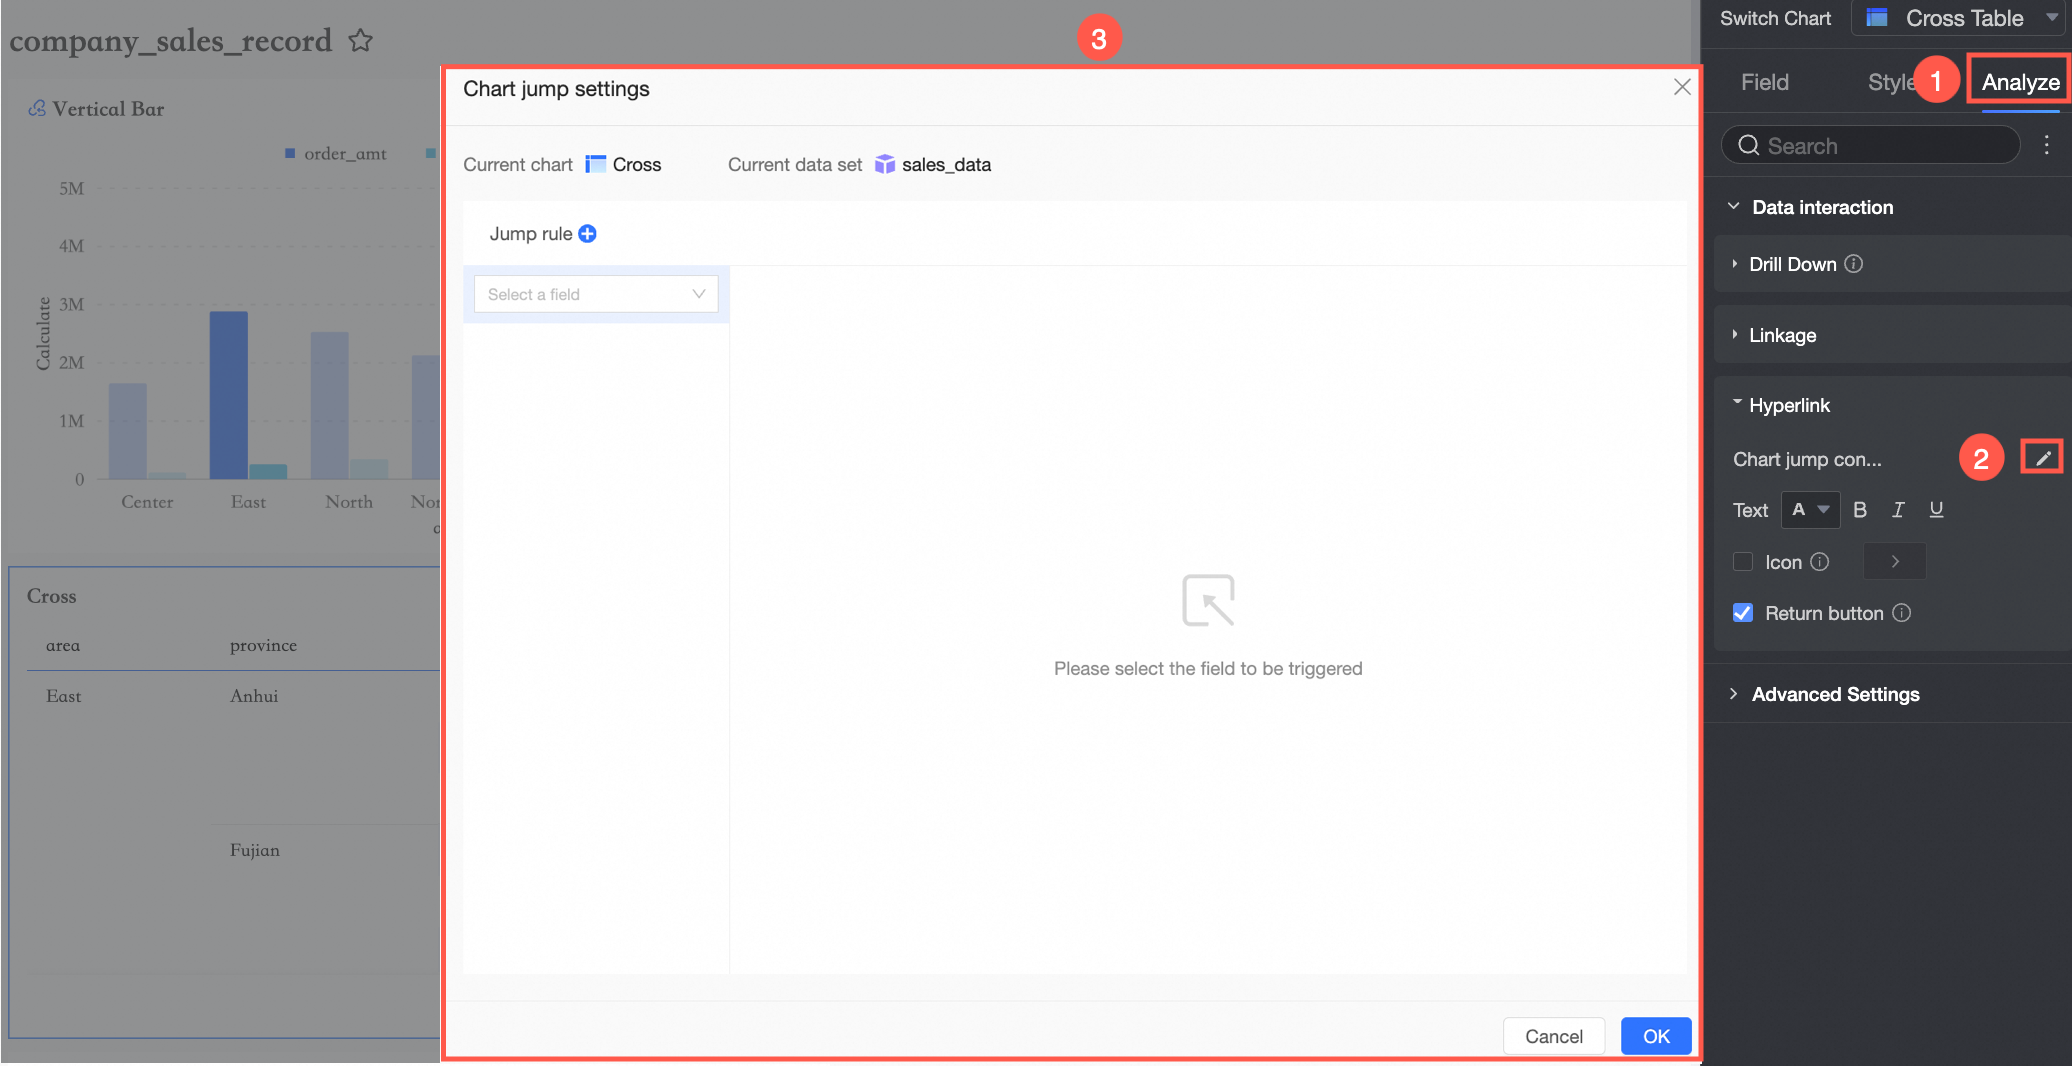
In-product Navigation
Set the Redirection Method
-
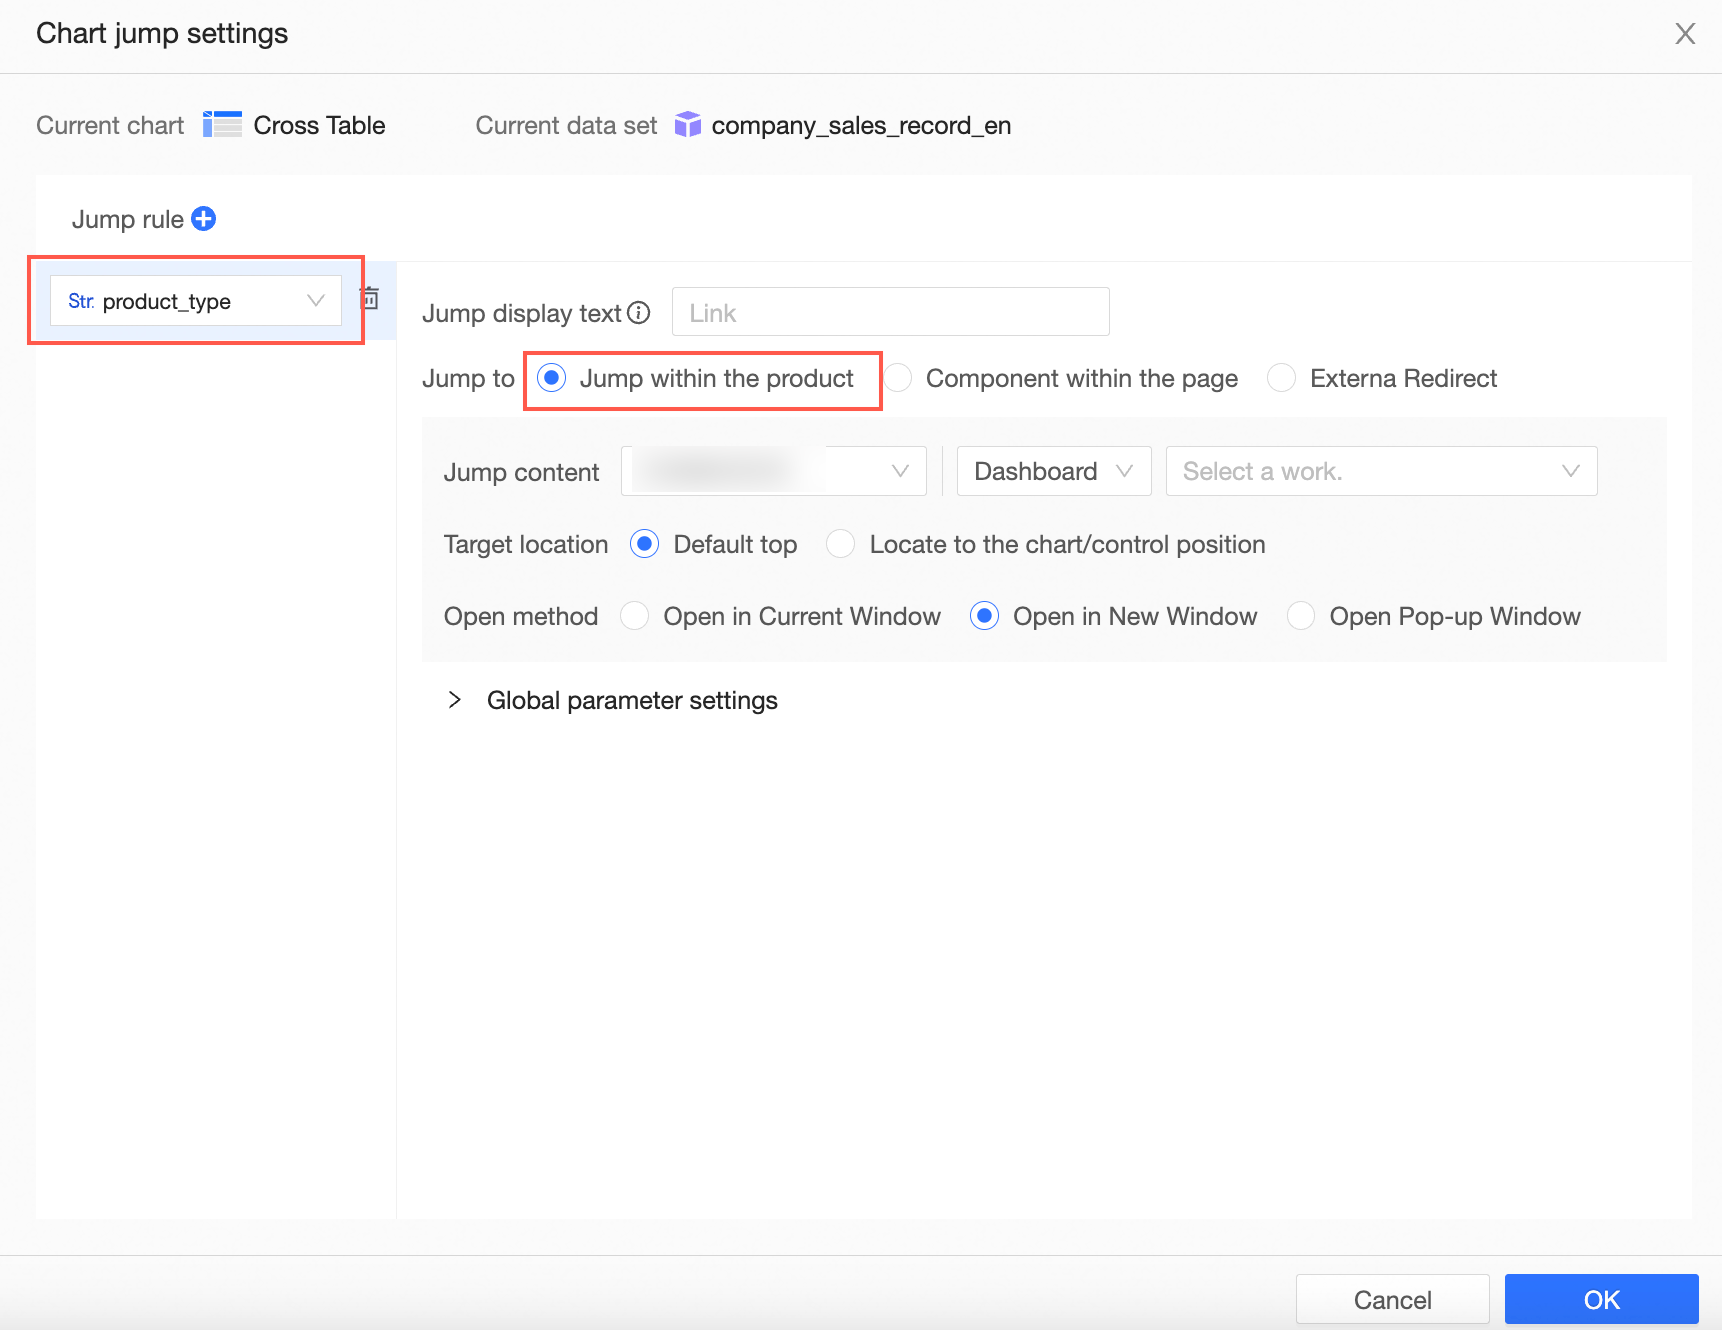
On the Redirection page, select a field to bind in the Redirection Rule section on the left. You can choose one of three redirection methods. This example uses Redirection within Quick BI.
-
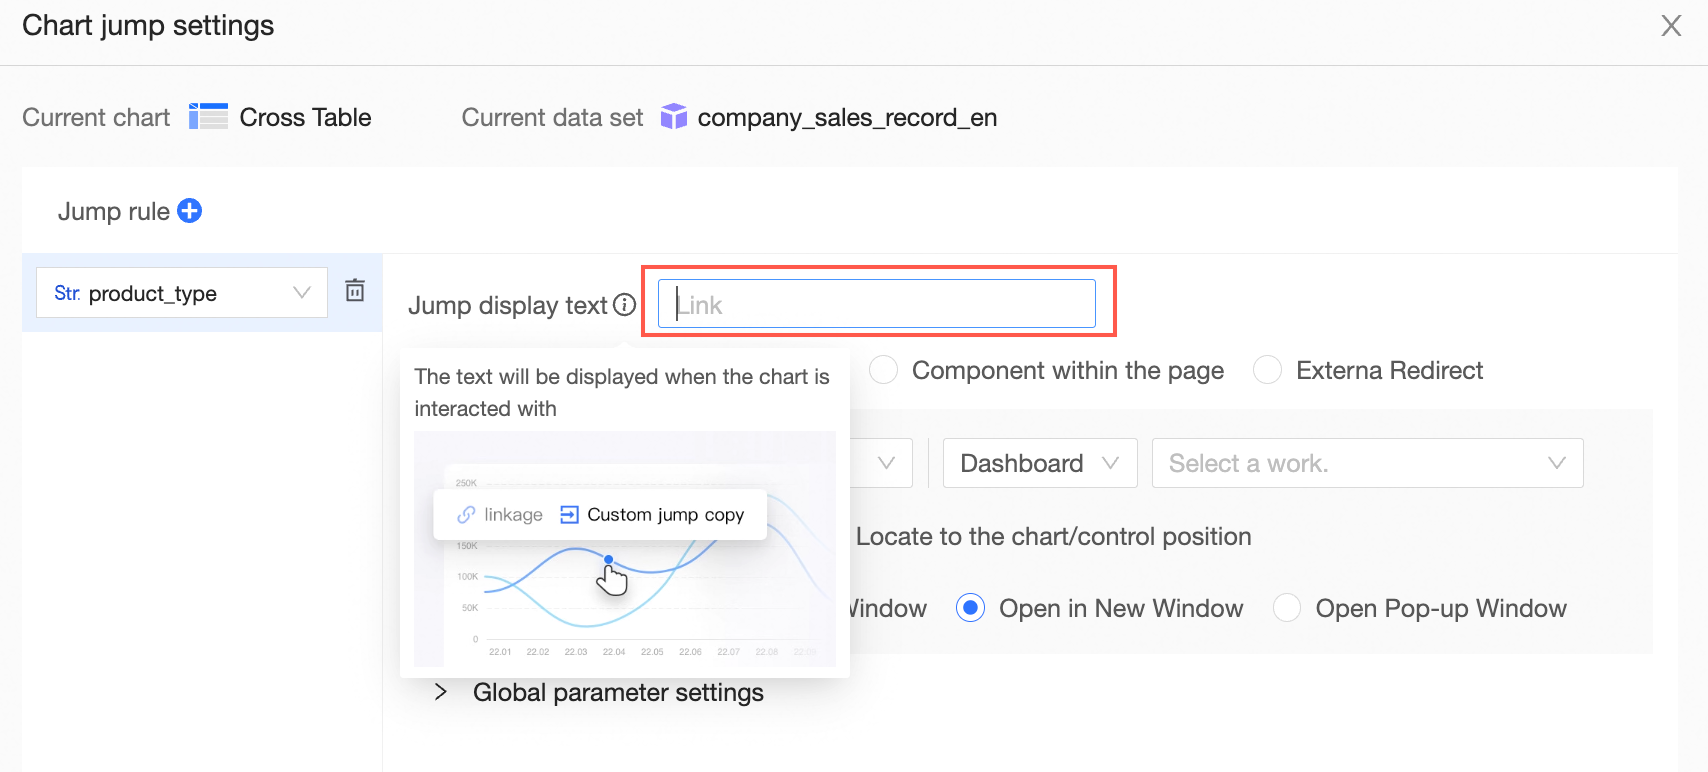
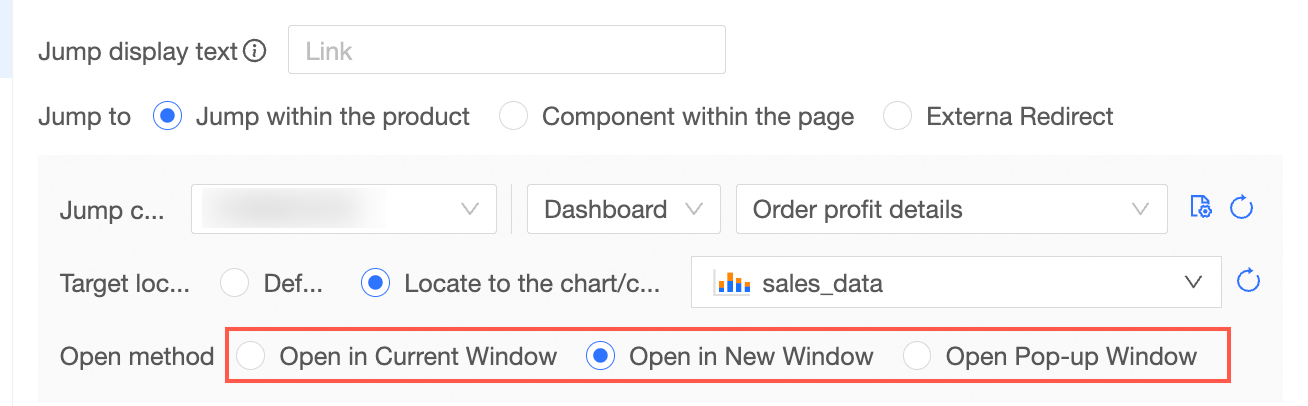
To display custom text when users interact with the chart, enter that text in the Redirection Display Text field. If you leave this field blank, the default text is Redirection. See the following image:
Set the Redirection Target
After you choose a redirection method, set the Redirection Content, Target Location, and Open Mode in the section below.
-
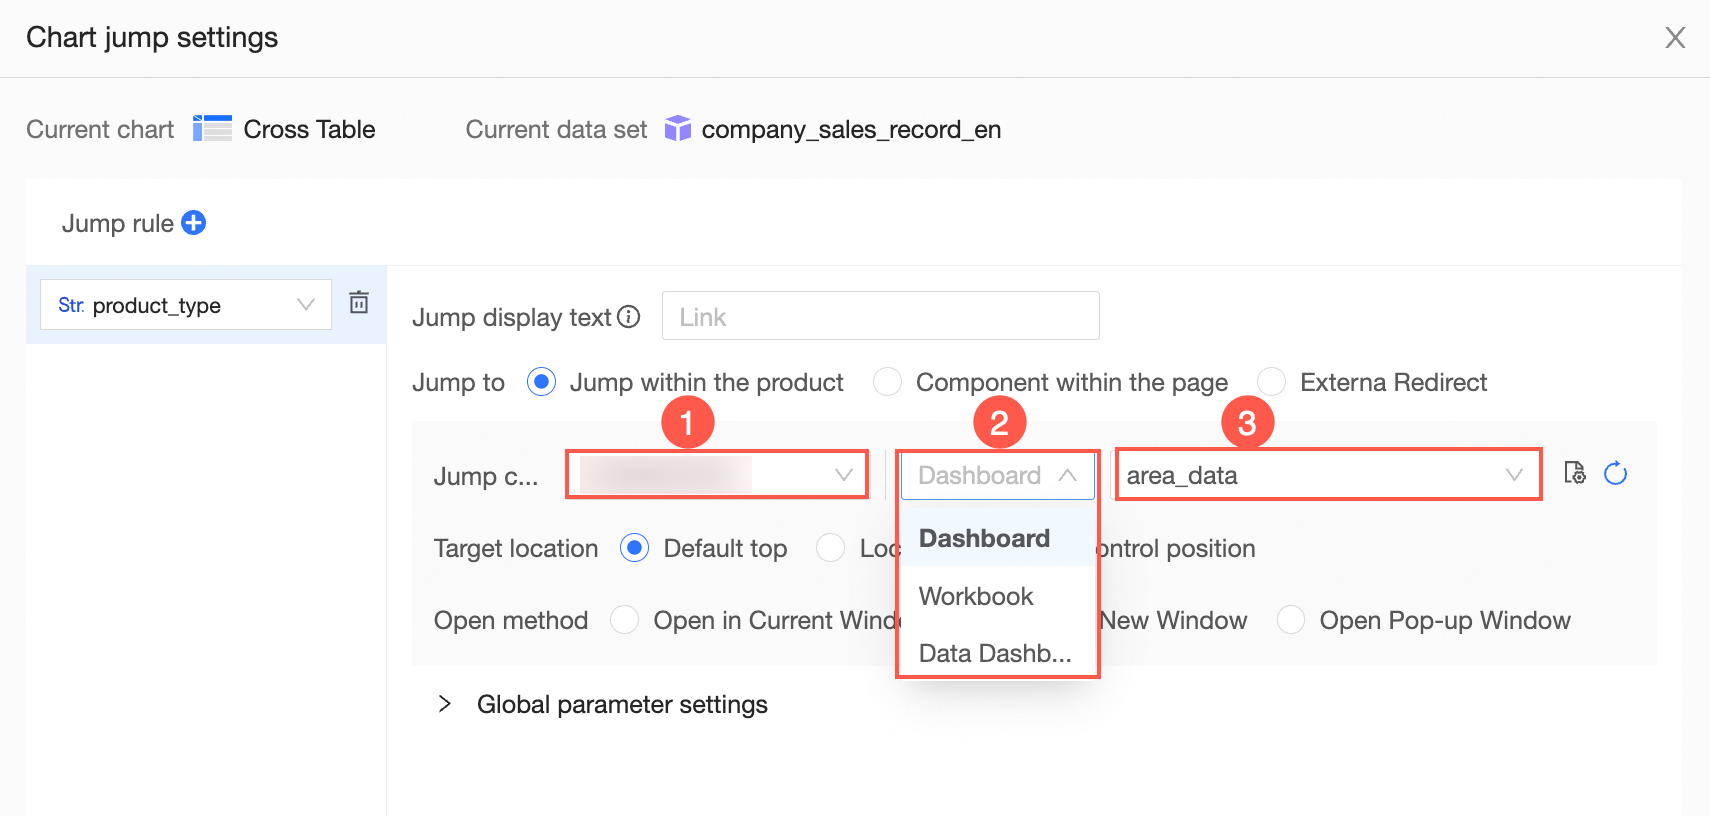
In Redirection Content, first select a workspace (①), then select a report type in that workspace (②), and finally select the Order Profit Details report (③).
-
If a report in the drop-down list shows the
 icon, it has global parameters configured and supports parameter-based redirection within Quick BI.
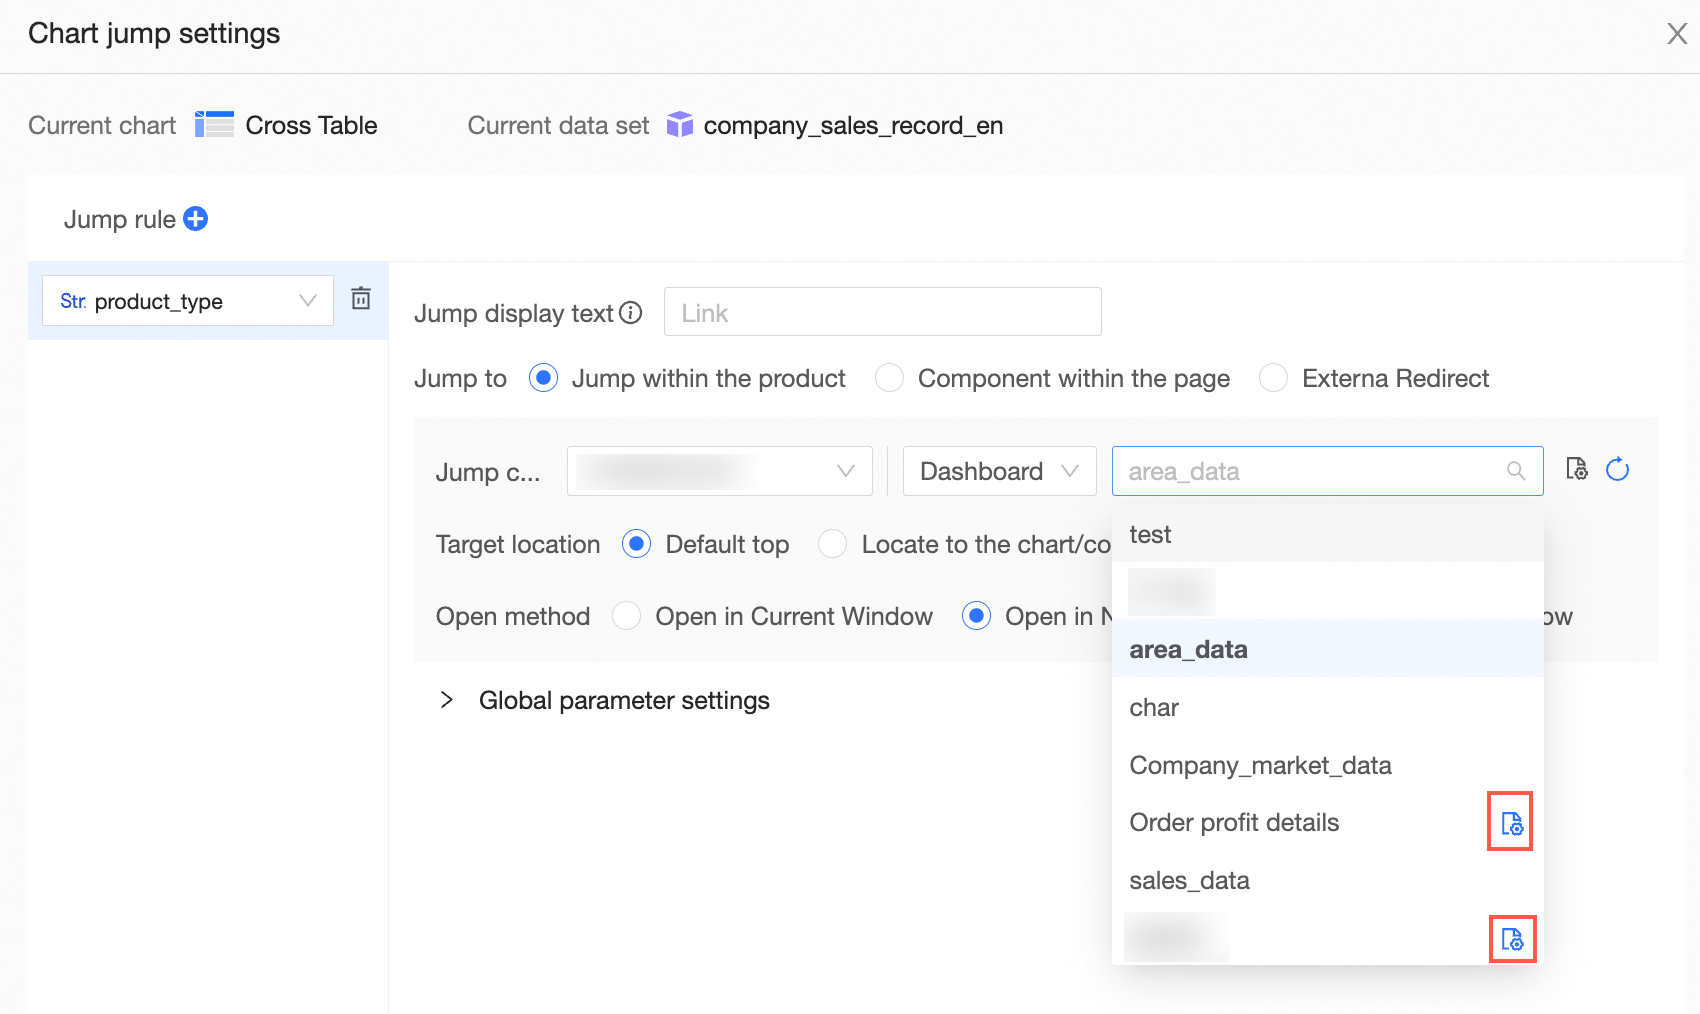
-
If the target report does not have global parameters configured, you cannot perform linked redirection. Click the
 icon to the right of the report selection box or click Go to Configure in the Global Parameter Settings section to configure global parameters. For step-by-step instructions, see Configure Global Variables.
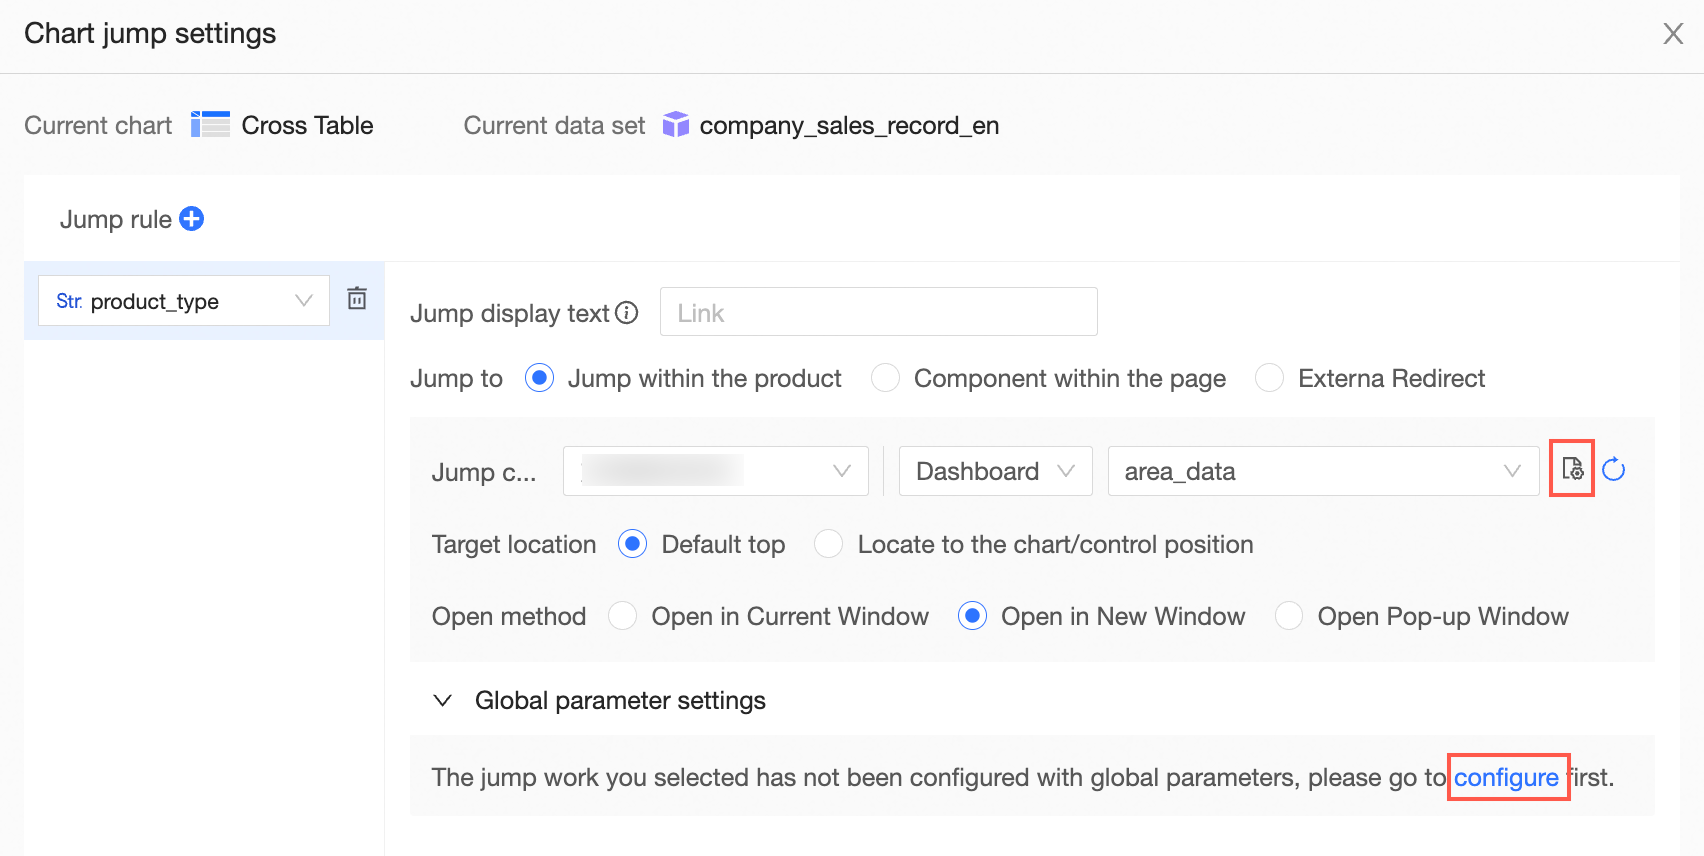
-
-
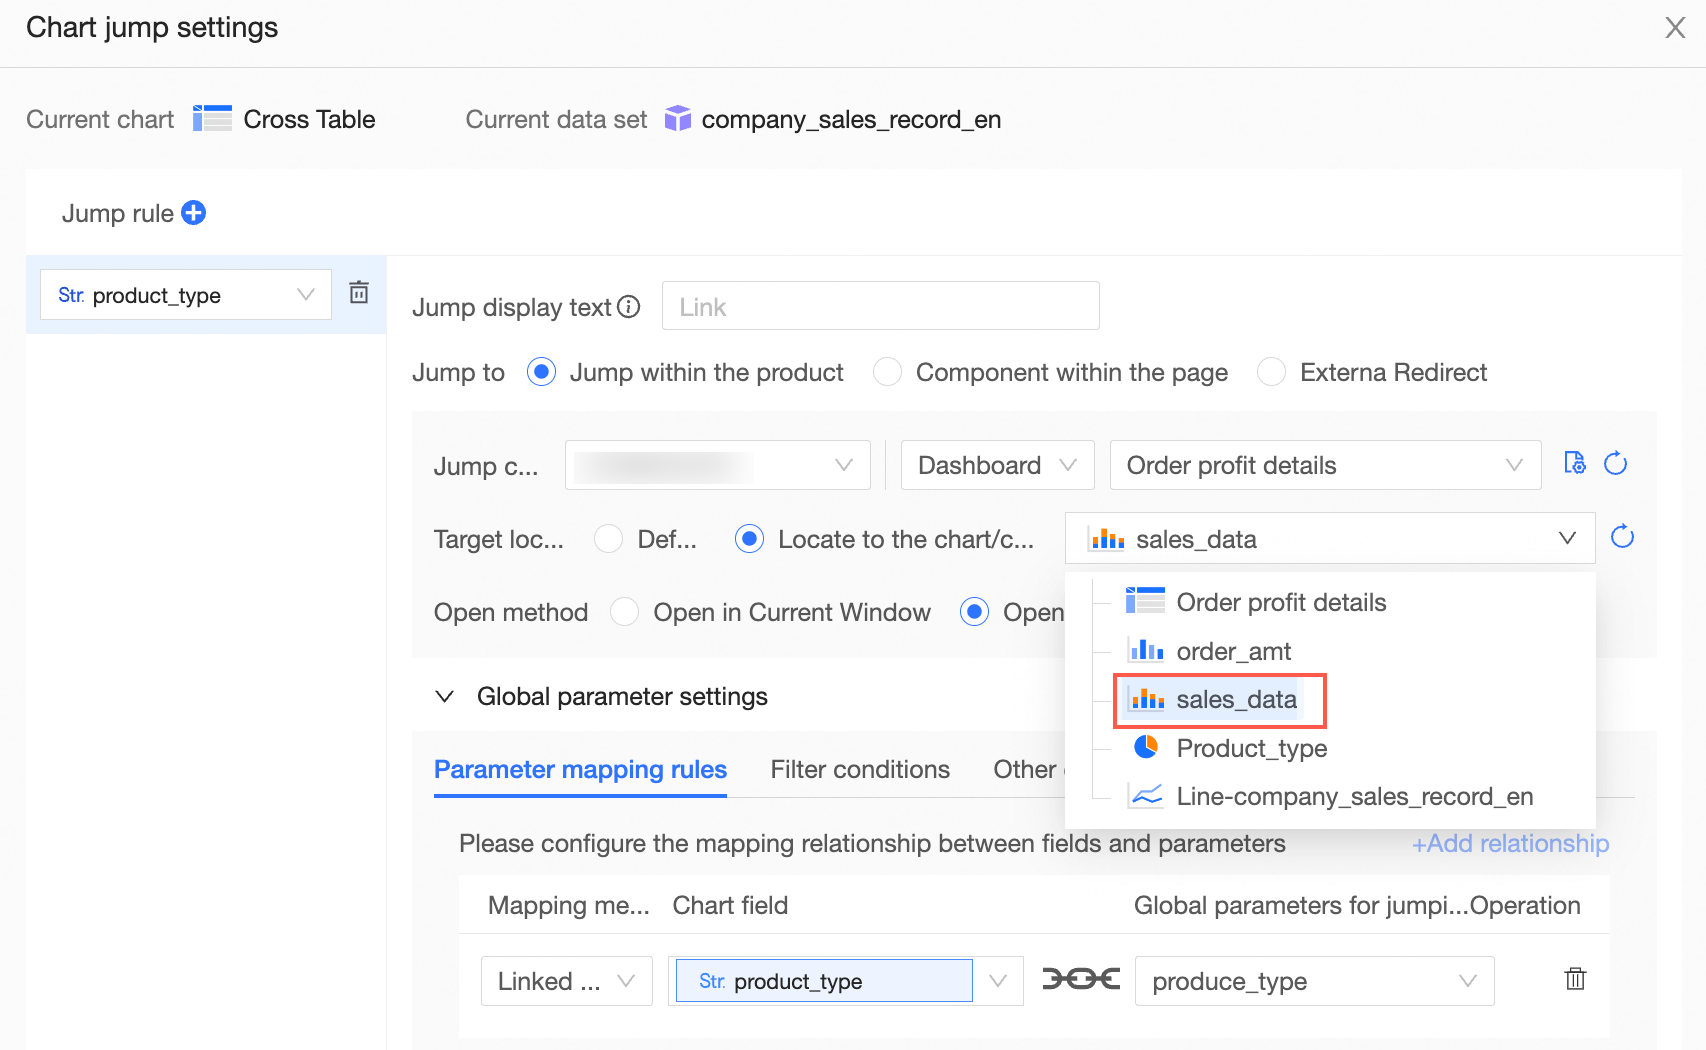
After you set the redirection content, choose where to display the target report. By default, Top of Page is selected, which means the target report opens at the top of the page. See the following image:
To scroll directly to a specific chart or control after redirection, select Scroll to Chart or Control and choose the Order Profit Details chart.
The result looks like this:
-
Choose how to open the redirected page: Current Window, New Window, or Popup.
-
If you choose New Window, click the Back button in the upper-left corner after redirection to return to the previous page. See the following image:
-
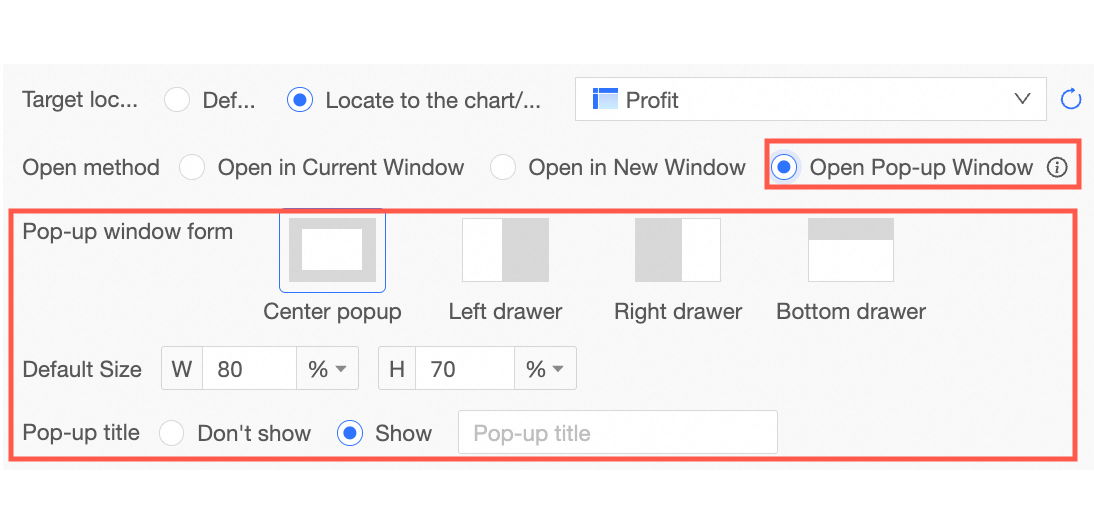
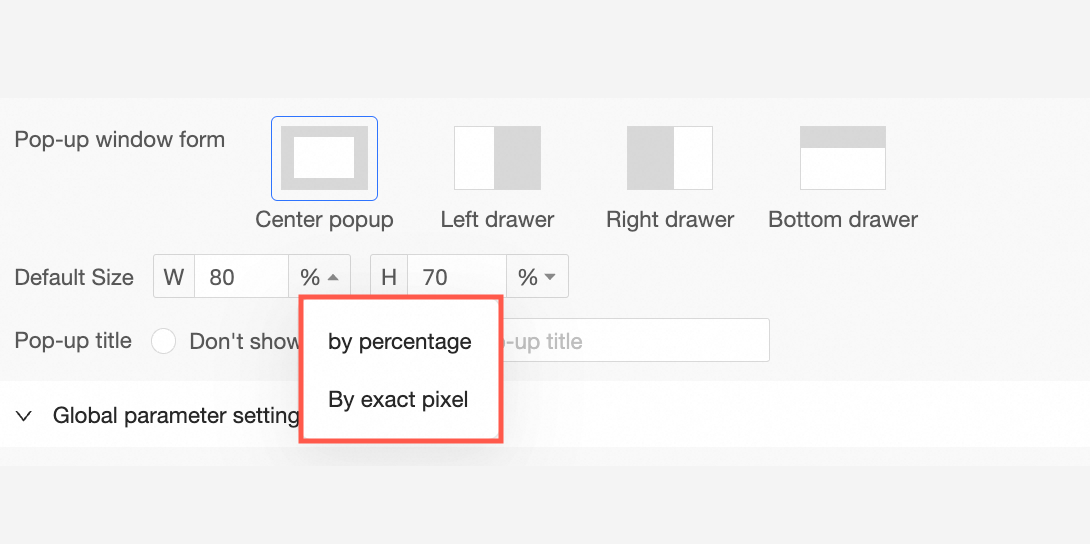
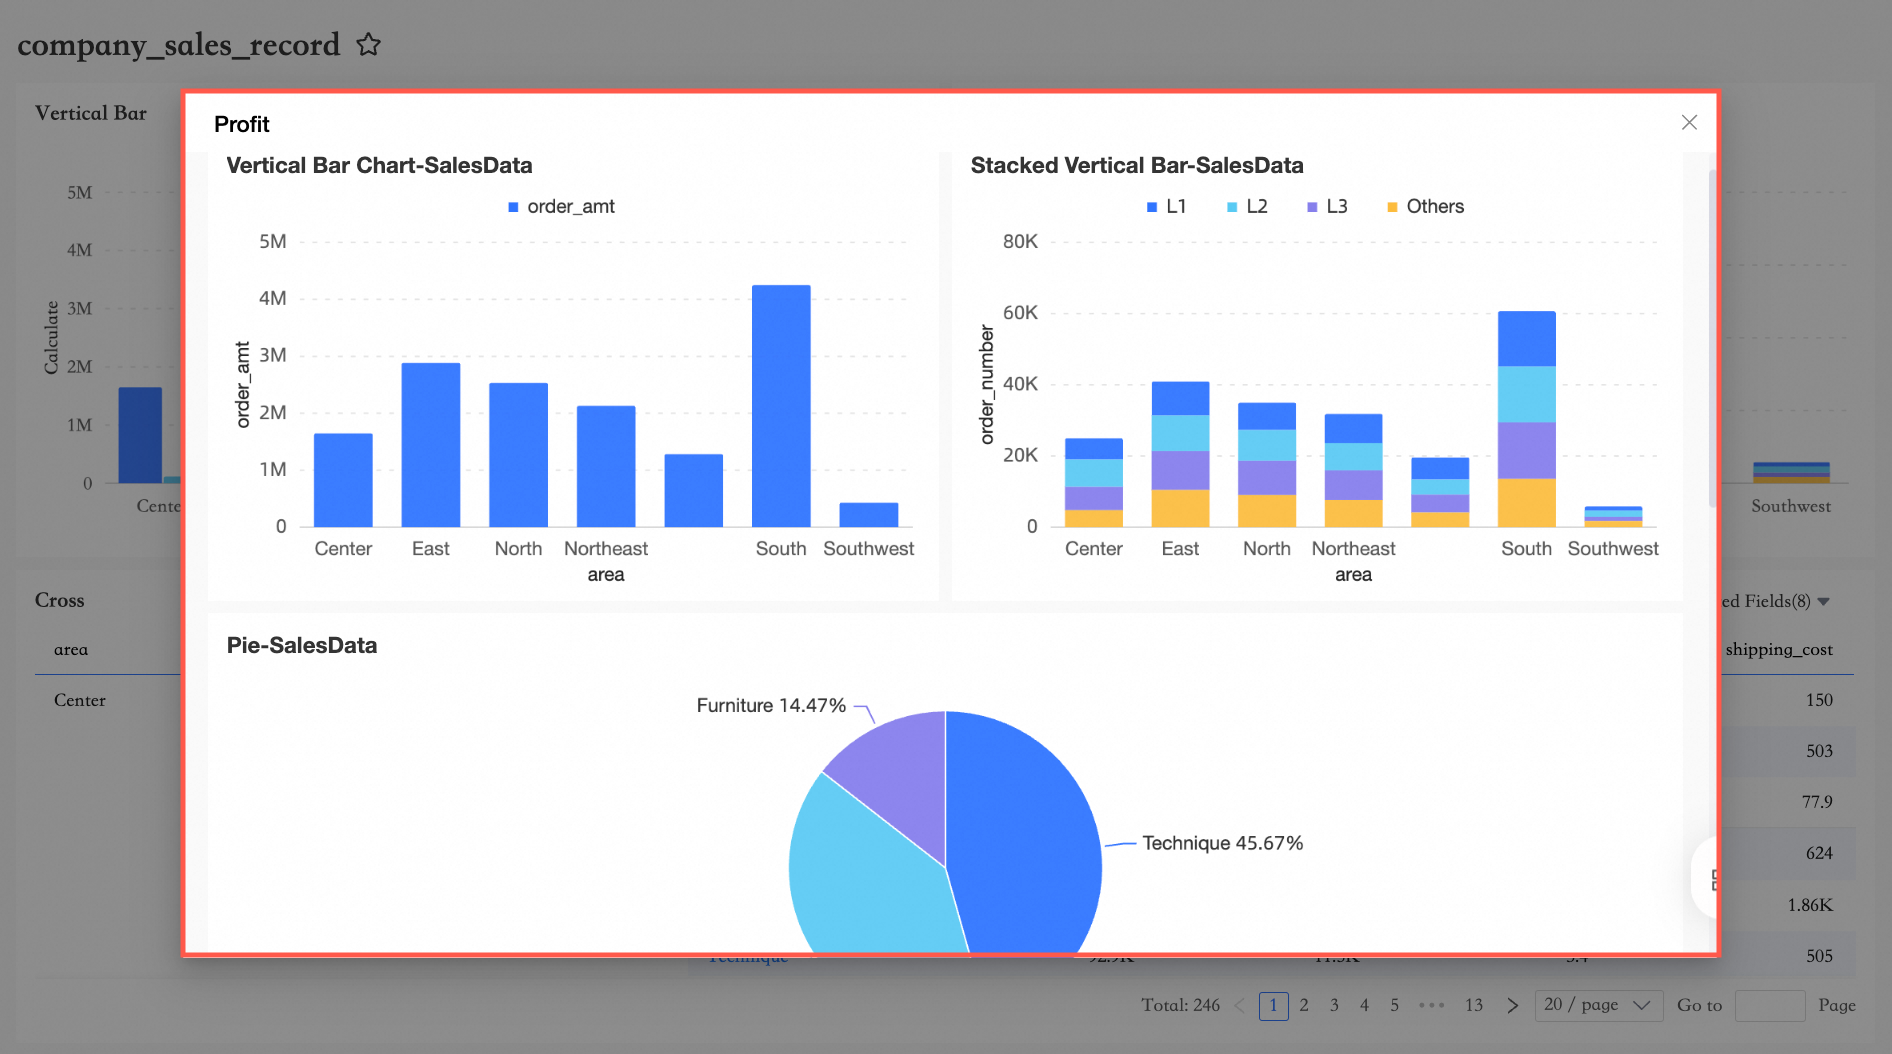
If you choose Popup, set the Popup Style, Default Size, Popup Title, and Page Overlay.
 Note
Note-
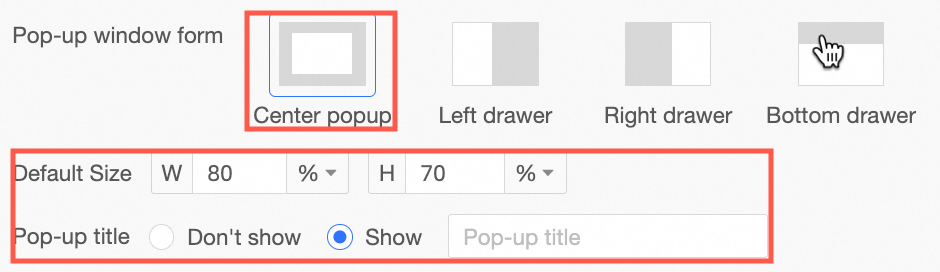
For center-aligned popups, you can choose whether to show the popup title. For other popup styles, the title always appears and cannot be hidden.
-
Only left drawers, right drawers, and bottom drawers support toggling the page overlay. When the overlay is hidden, you can click to switch dimension values.
-
For Default Size, choose either a percentage or exact pixels.
-
Center-aligned popup.
-
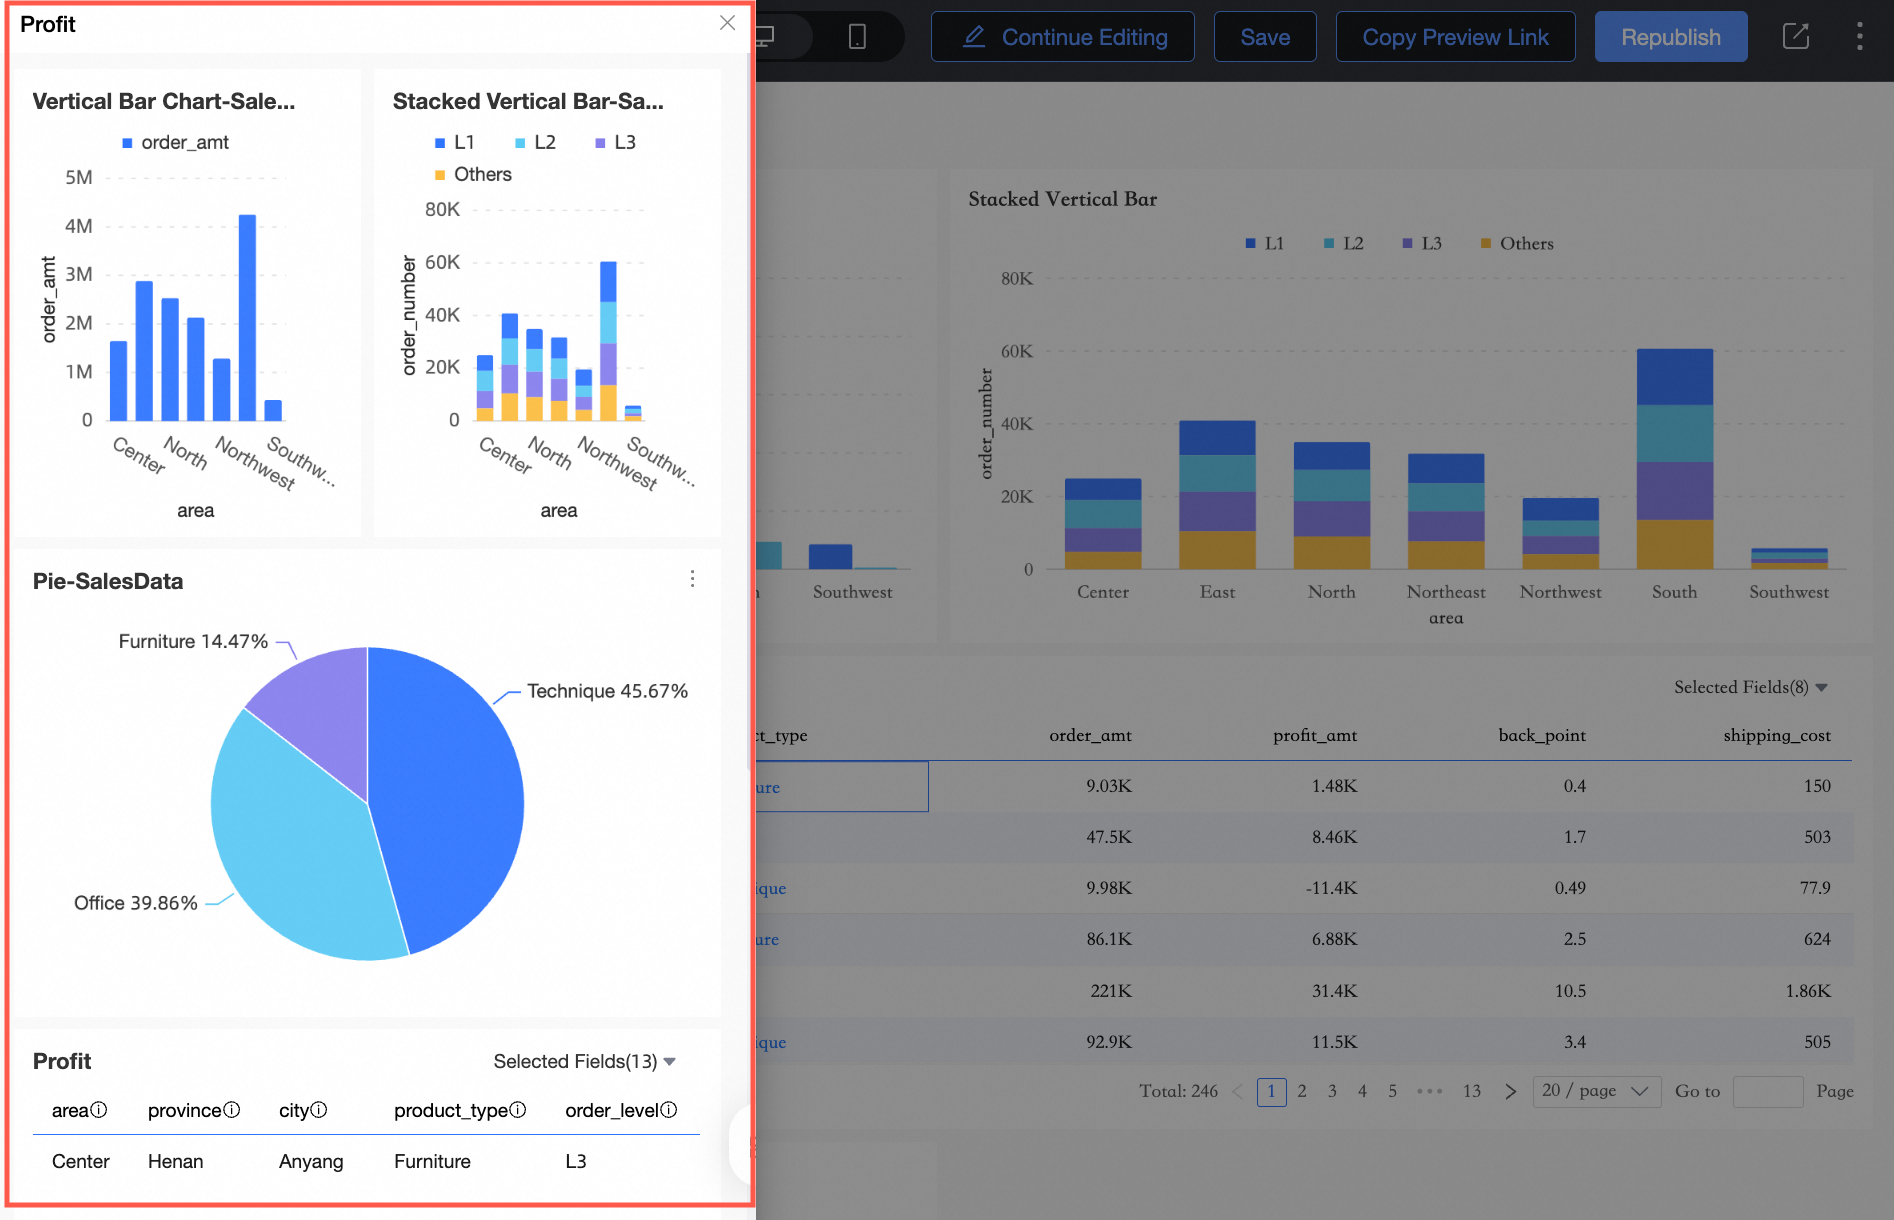
Left drawer.
-
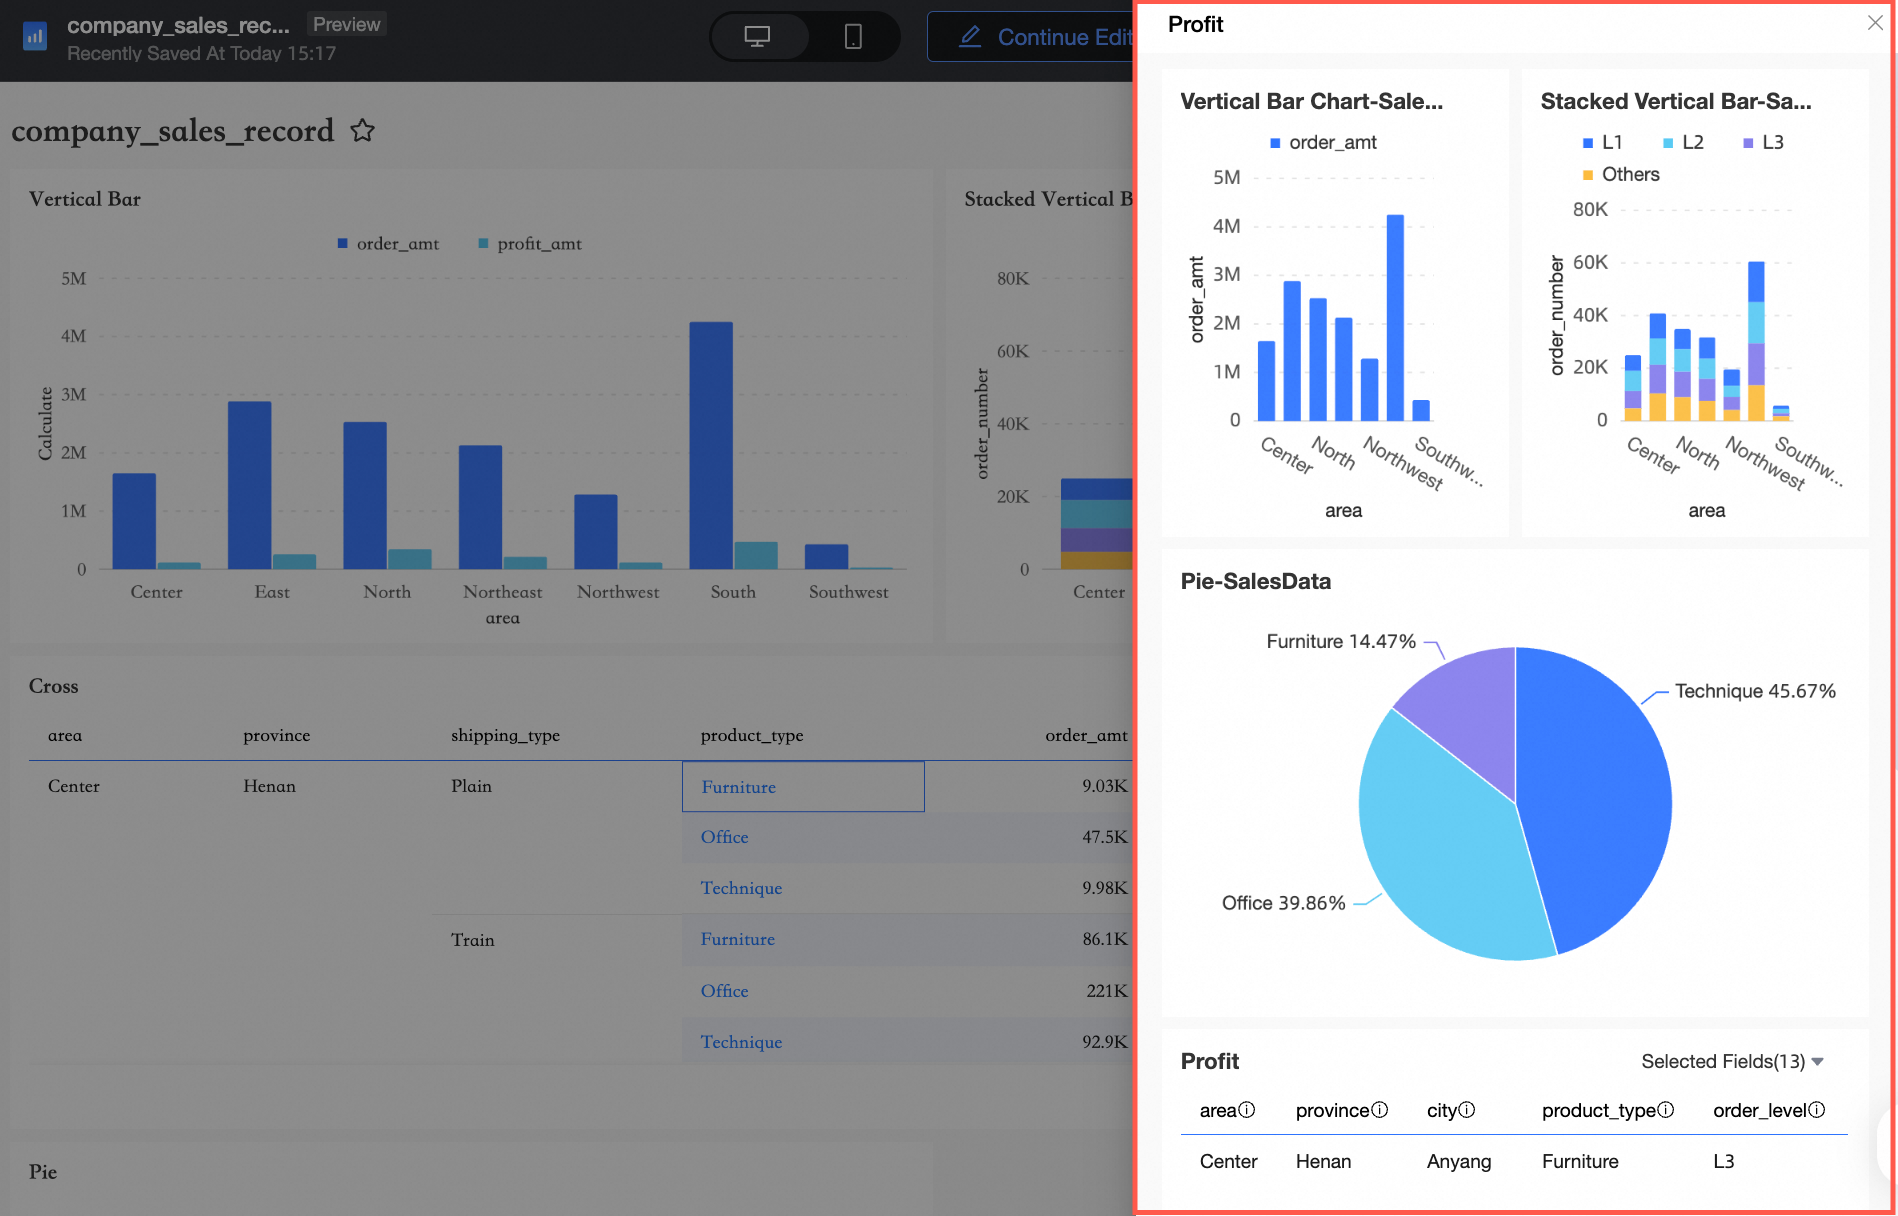
Right drawer.
-
Bottom drawer.
-
When using a popup, you can drag to resize the window or reposition it.
-
-
Configure Global Parameters
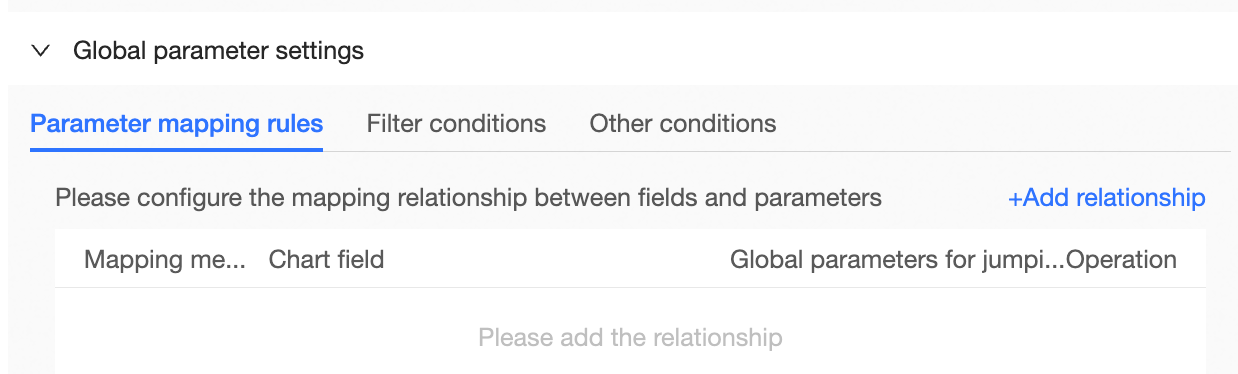
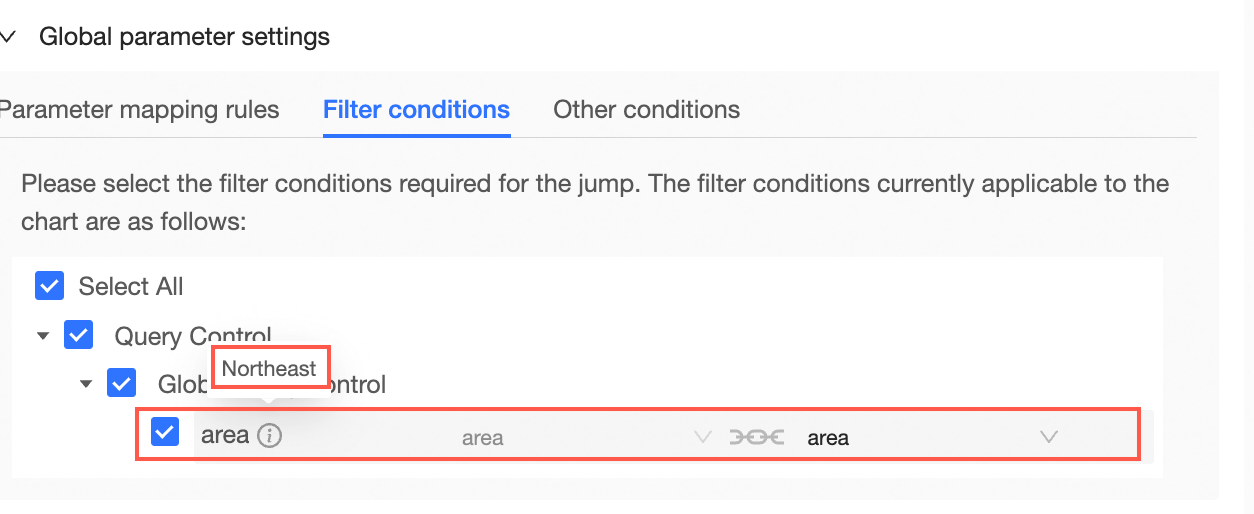
After you set the redirection target, configure Parameter Mapping Rules, Filter Conditions (query controls and global parameters), and Other Conditions (drill down and filter interaction conditions) in the Global Parameter Settings section.
In Parameter Mapping Rules, the chart fields and query controls used in Filter Conditions support dimensions, measures, and placeholders. Placeholders support only value placeholders and condition placeholders. For details, see Placeholders.
-
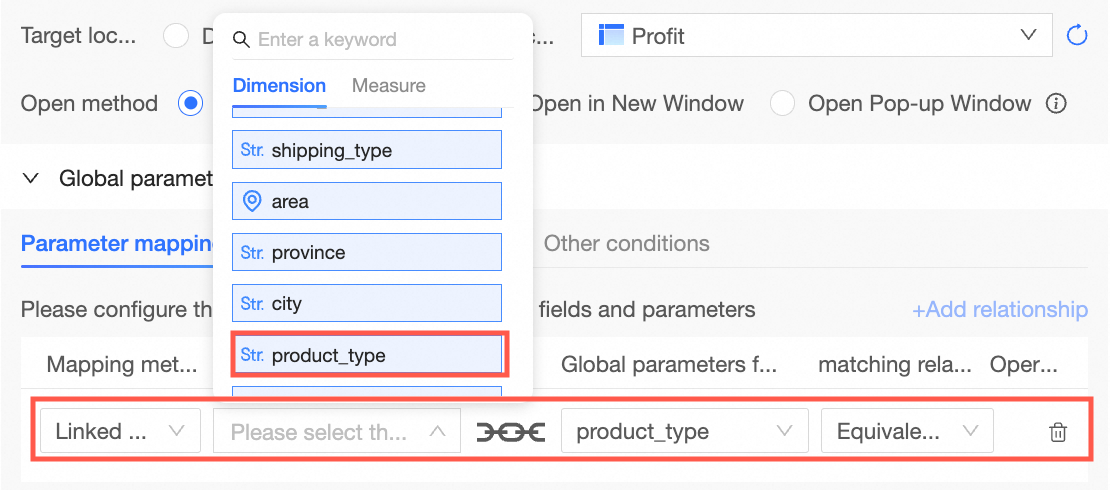
To redirect between reports, map a field in the current chart to a parameter in the target report. Select Associate Field as the mapping method, and choose Product Type as the chart field to match against the global parameter in the target report.
 Matching Types include Exact Match and Multi-value Match.
Exact Match: When you select Exact Match, the value passed during redirection must equal the target parameter value. Example:
Multi-value Match: When you select Multi-value Match, values separated by commas are split and displayed individually. Example:
 Note
NoteMatching types apply to all supported chart types. No chart type restrictions exist. The default is Exact Match.
-
If the source report has a query control (for example, a Region control) set to Northeast, select Region in the global controls and configure the corresponding parameter in the target report. After you save, the redirection carries this filter condition.
-
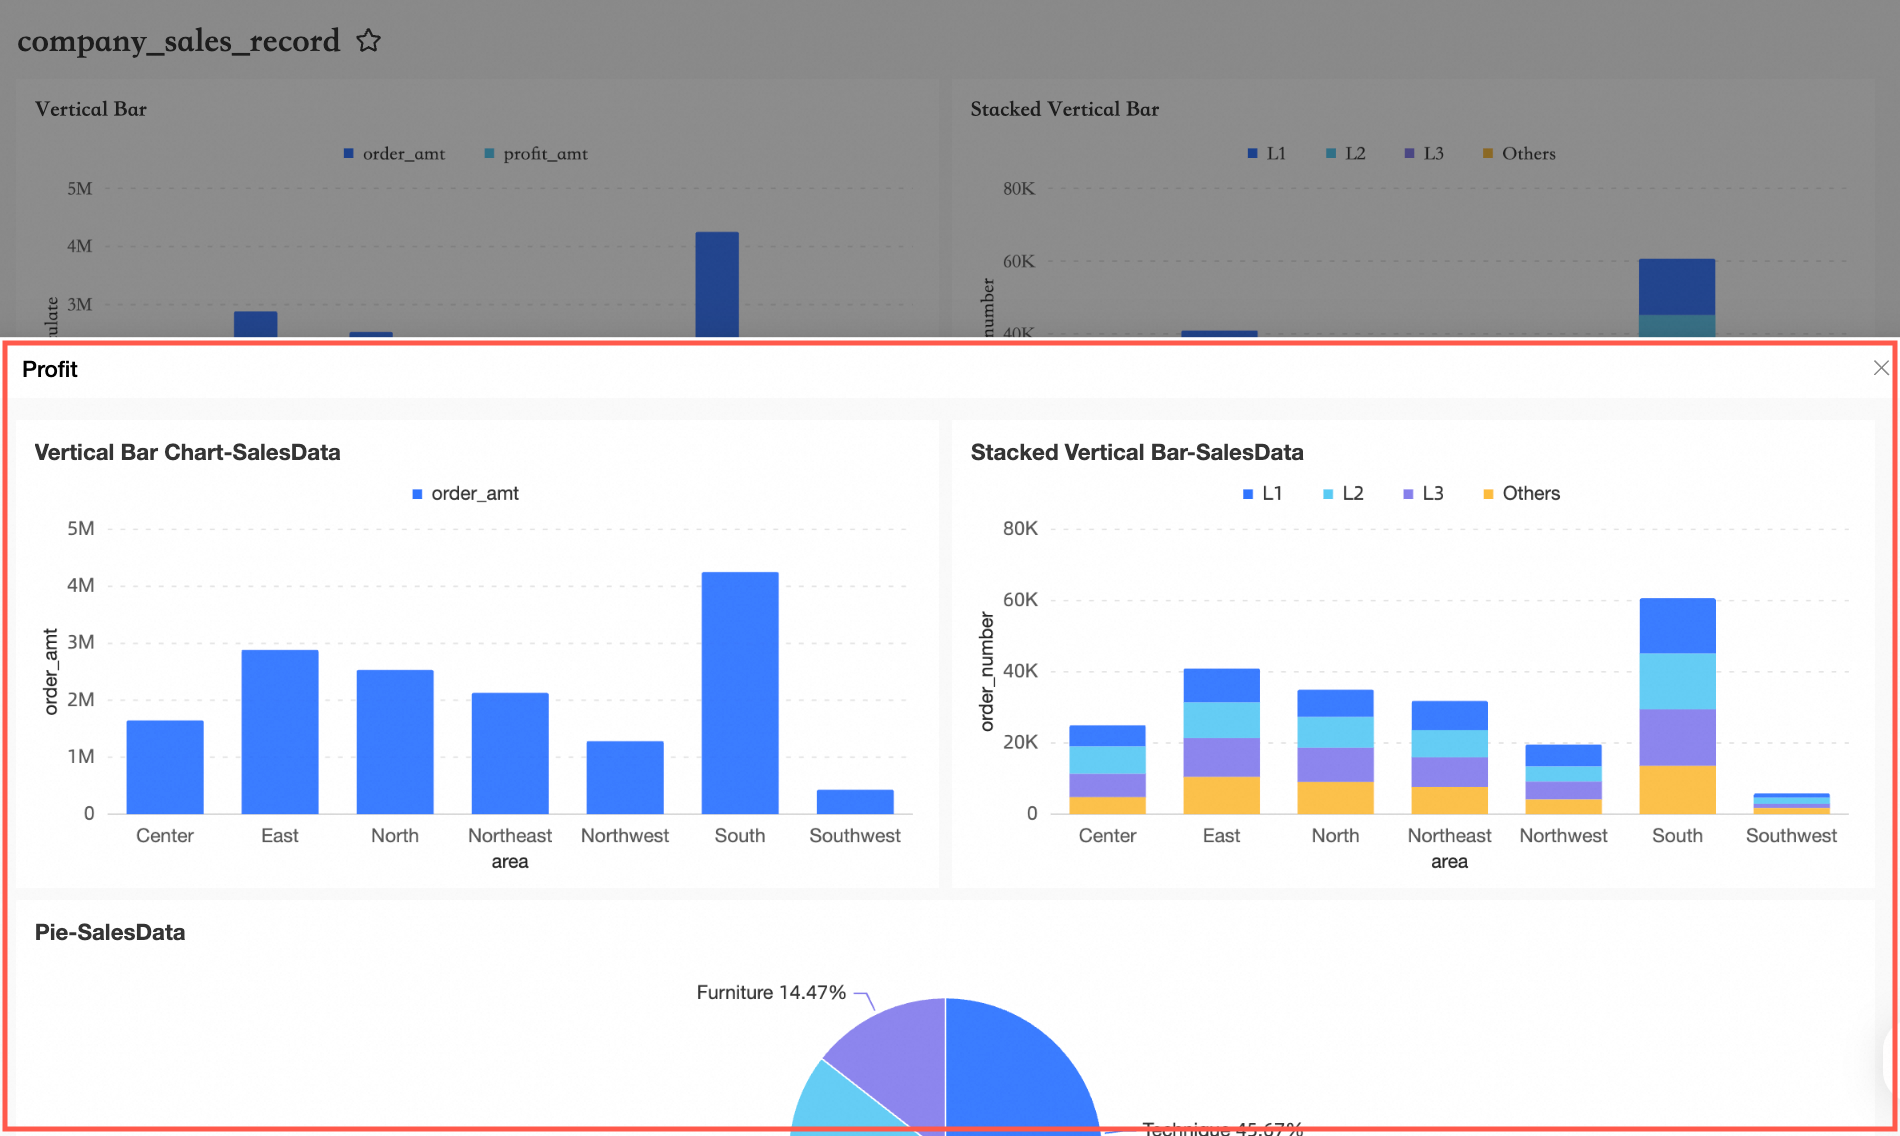
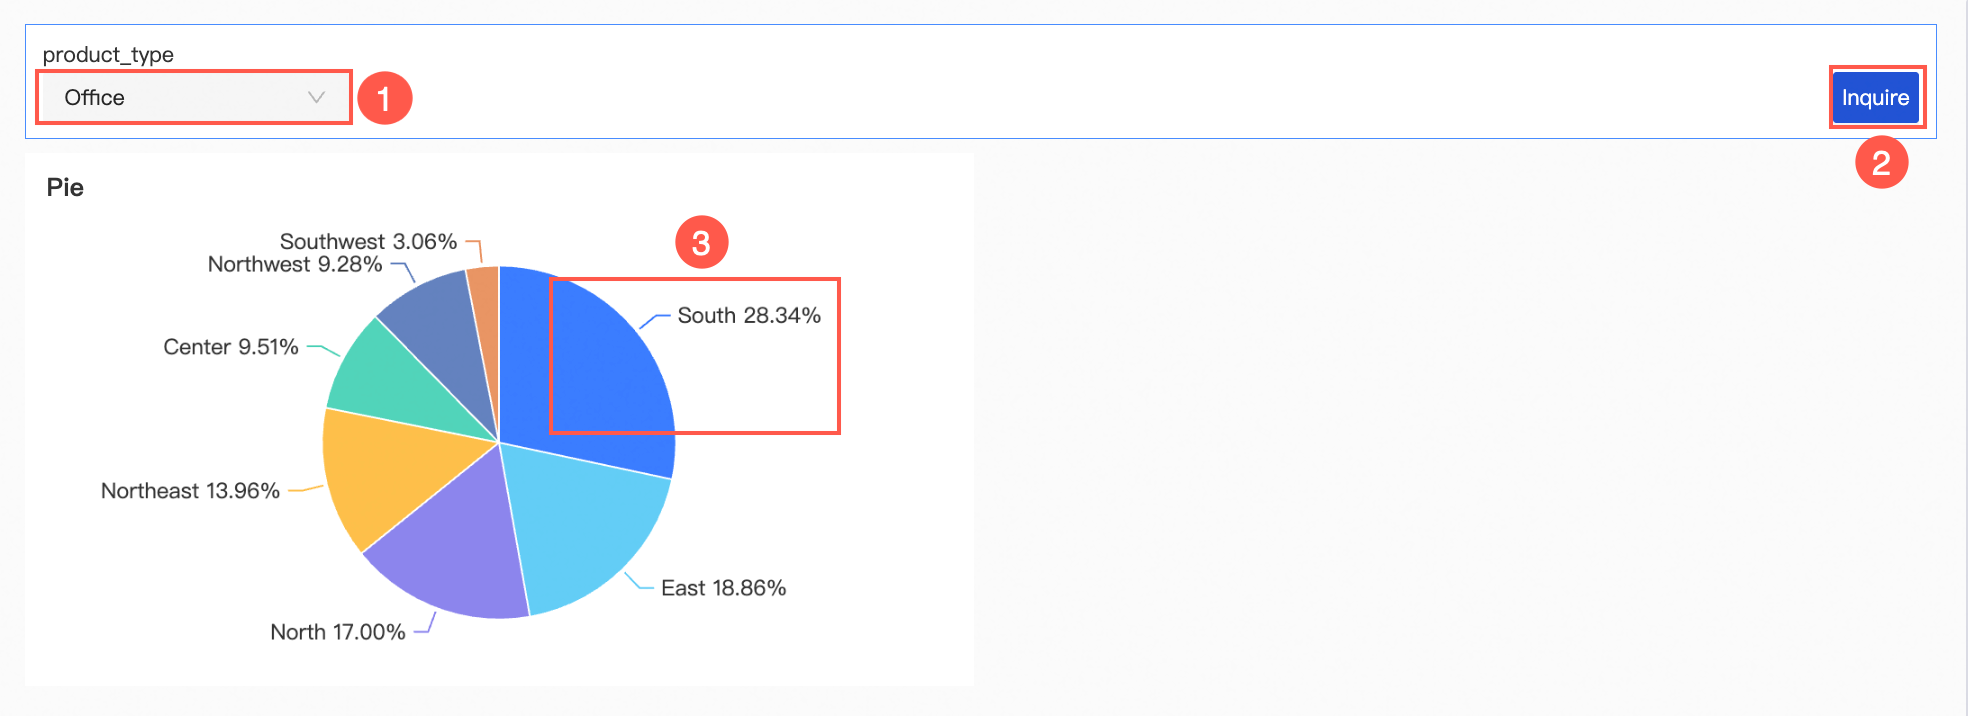
Example using a pie chart: compare results before and after enabling Carry Filter Conditions.
In the pie chart, the query control (that is, Product Type) is set to Office Supplies, and the redirection region is Southern China. See the following image:
-
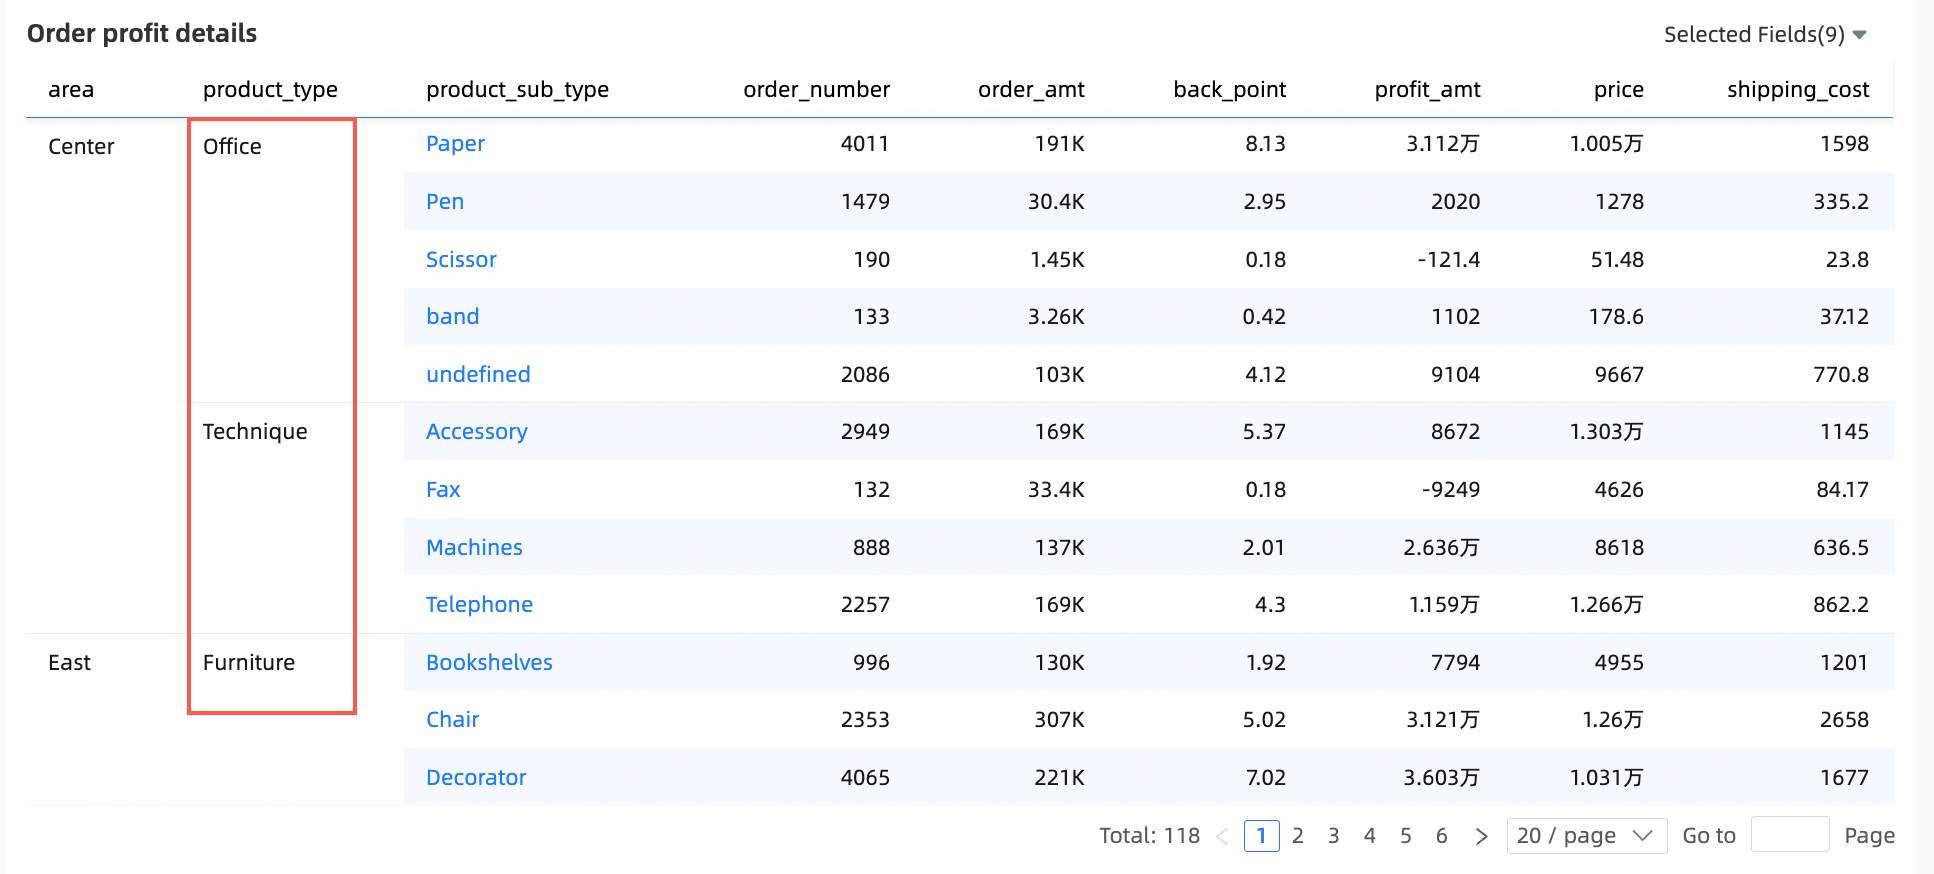
When Carry Filter Conditions is not selected, the redirected cross table shows all product types for the region, without filtering by product type.
-
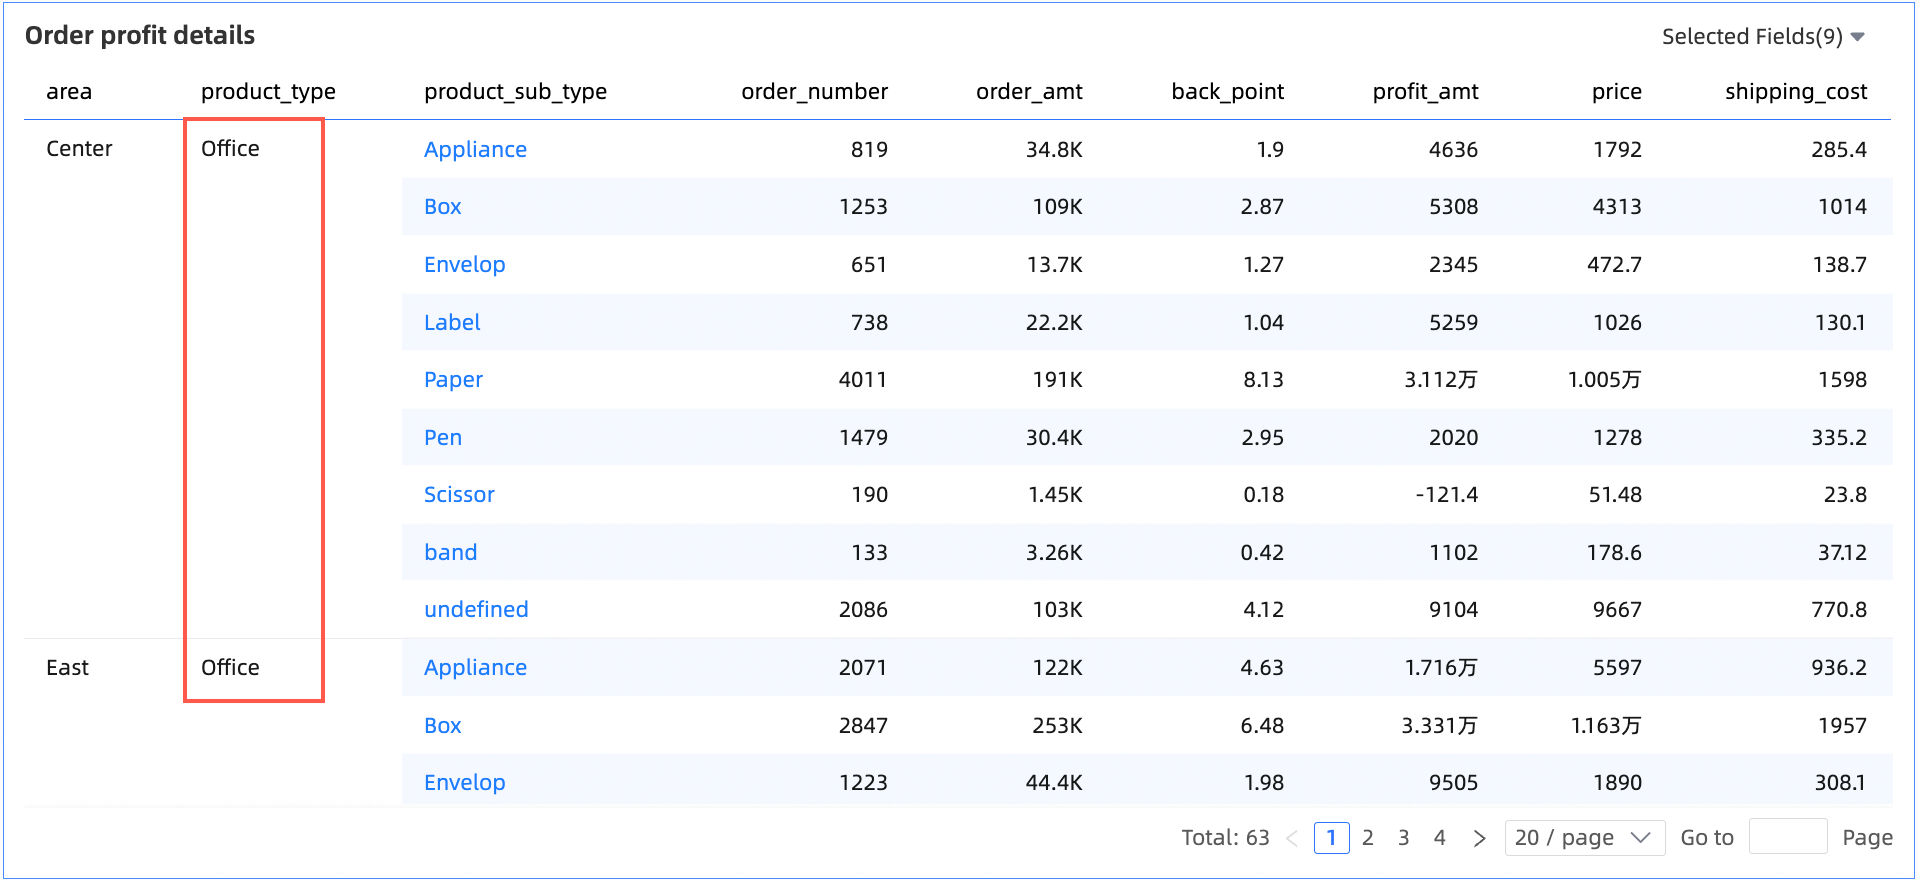
When Carry Filter Conditions is selected, the redirected cross table shows only data where the Product Type is Office Supplies for the region.
-
-
Carry Filter Conditions also supports multi-level redirection.
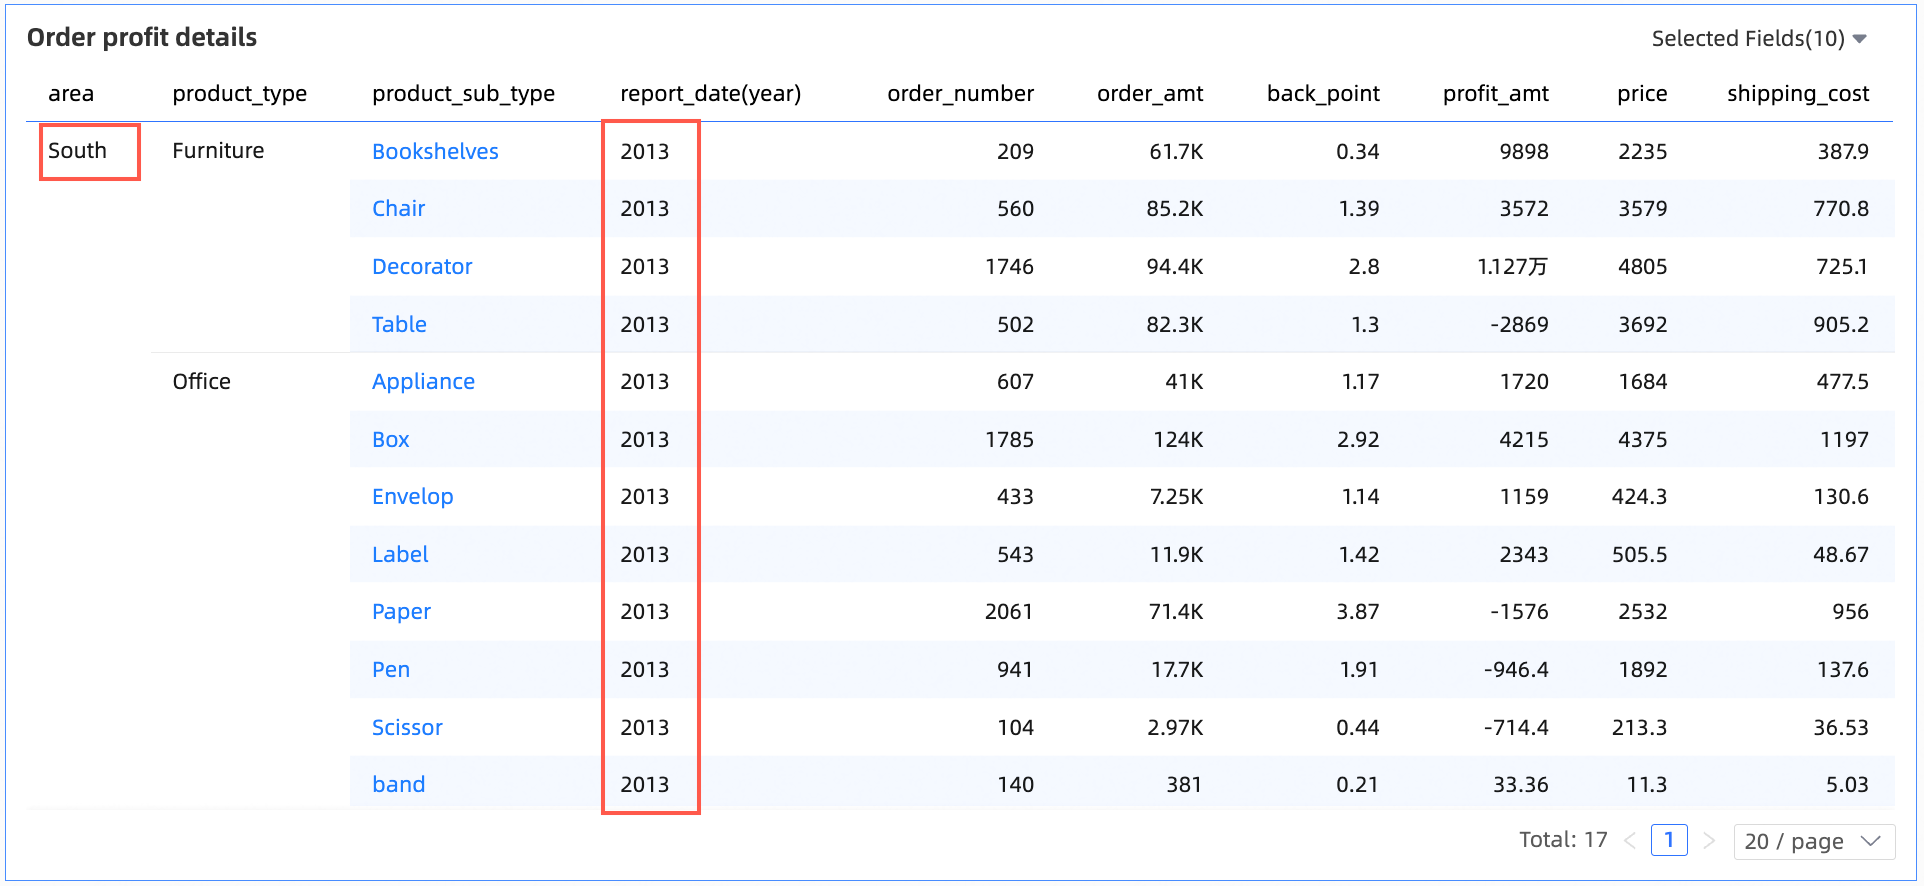
For example, if you query Order Information for the Northeast region and click Office Supplies, you redirect to the Order Profit Details page. The page then shows profit details for Office Supplies in the Northeast region. If you then click Paper under Product Subcategory, you redirect to the Order Shipping Status page. That page then shows shipping status for Paper in the Northeast region.
See the following image:
 Note
NoteThe following chart types support Carry Filter Conditions and Carry Other Conditions (filter interaction or drill down):
-
Line/area charts
Line charts, area charts, stacked area charts, 100% stacked area charts, combination charts
-
Column/bar charts
Column charts, 100% stacked column charts, bar charts, stacked bar charts, 100% stacked bar charts, leaderboards
-
Pie/doughnut charts
Pie charts, rose charts
-
-
-
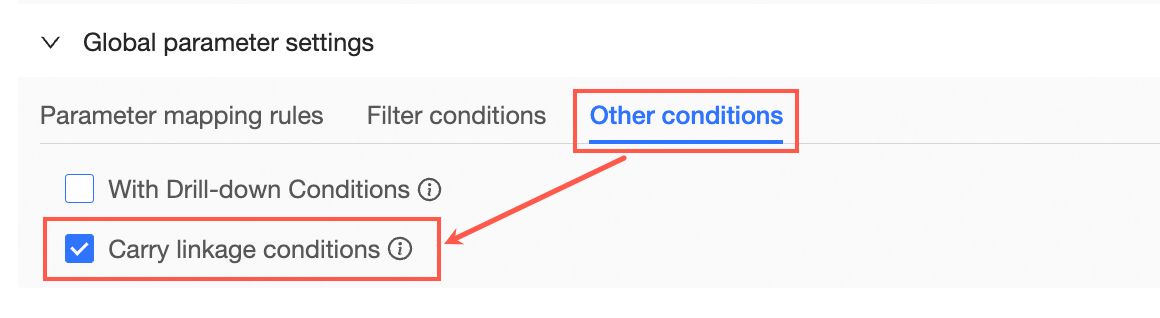
If the source report applies filter interaction, select Carry Filter Interaction Conditions in the Other Conditions section to carry those conditions during redirection.
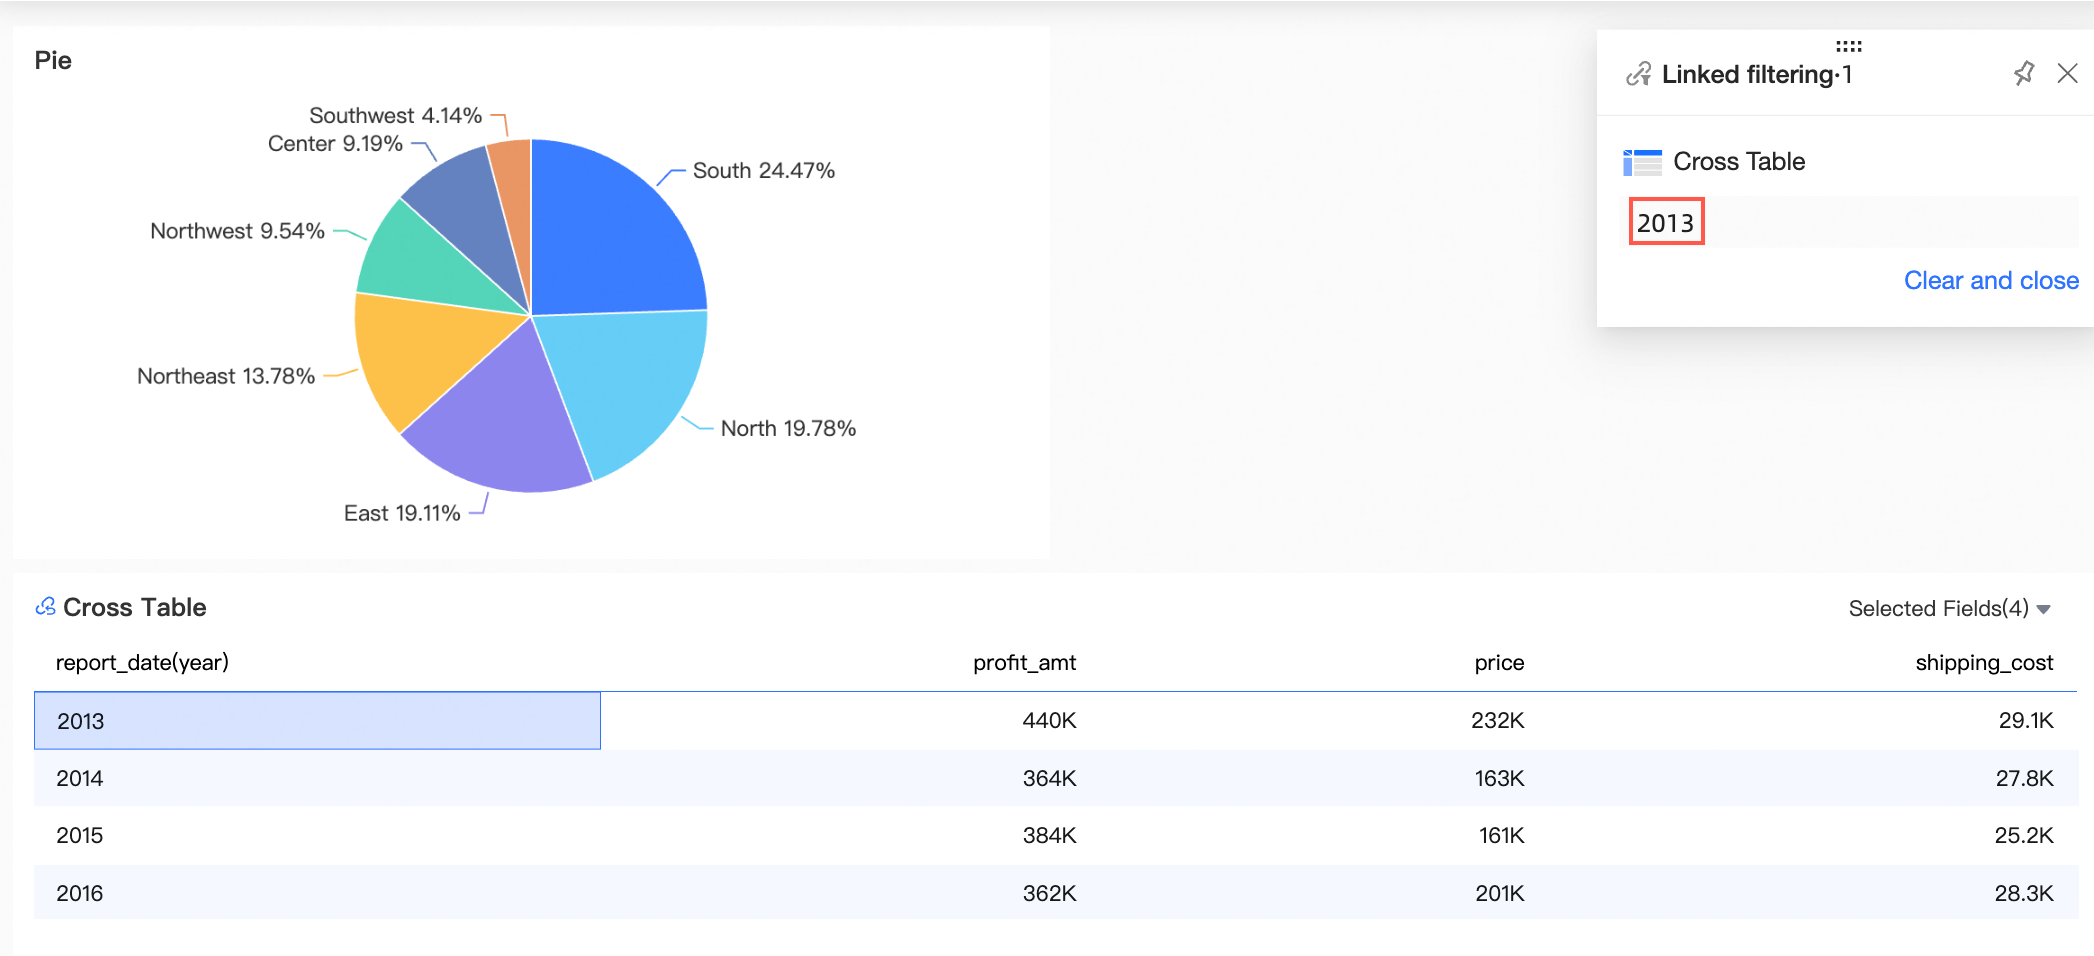
For example, if you apply filter interaction on the Order Date field in a cross table and set it to 2013, clicking a region such as Southern China in a pie chart redirects to a cross table showing only data where Region is Southern China and Order Date is 2013.
Redirect Display
Click Office Supplies in the cross table Order Information. Quick BI redirects you to the Business Analysis dashboard and displays only orders where the Product Type is Office Supplies.
If the chart has only redirection configured, clicking triggers immediate redirection. If the chart has additional interactive actions (such as filter interaction or redirection), clicking displays an action bar. You must then select redirection from that bar.
In-page Widget
-
On dashboards, you can redirect to any chart, Tab control, rich text, image, or embedded page.
-
When you set a jump in a workbook, select a sheet.
-
In a data dashboard, you can configure a link to a specific page.
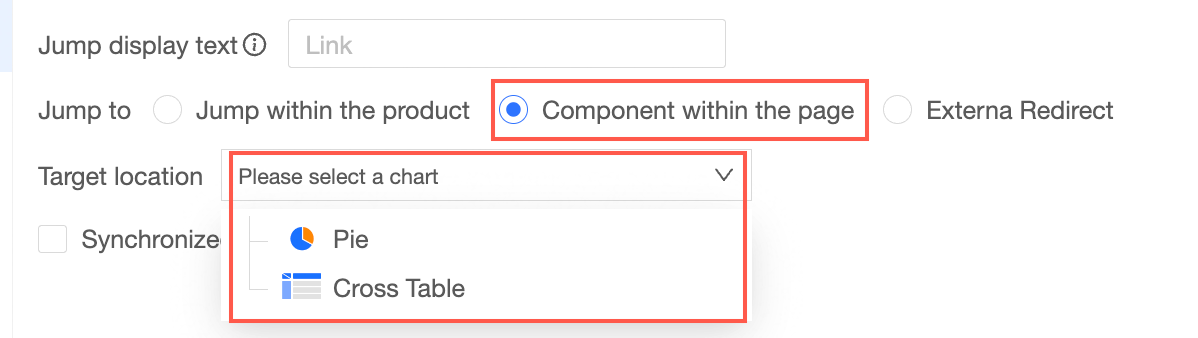
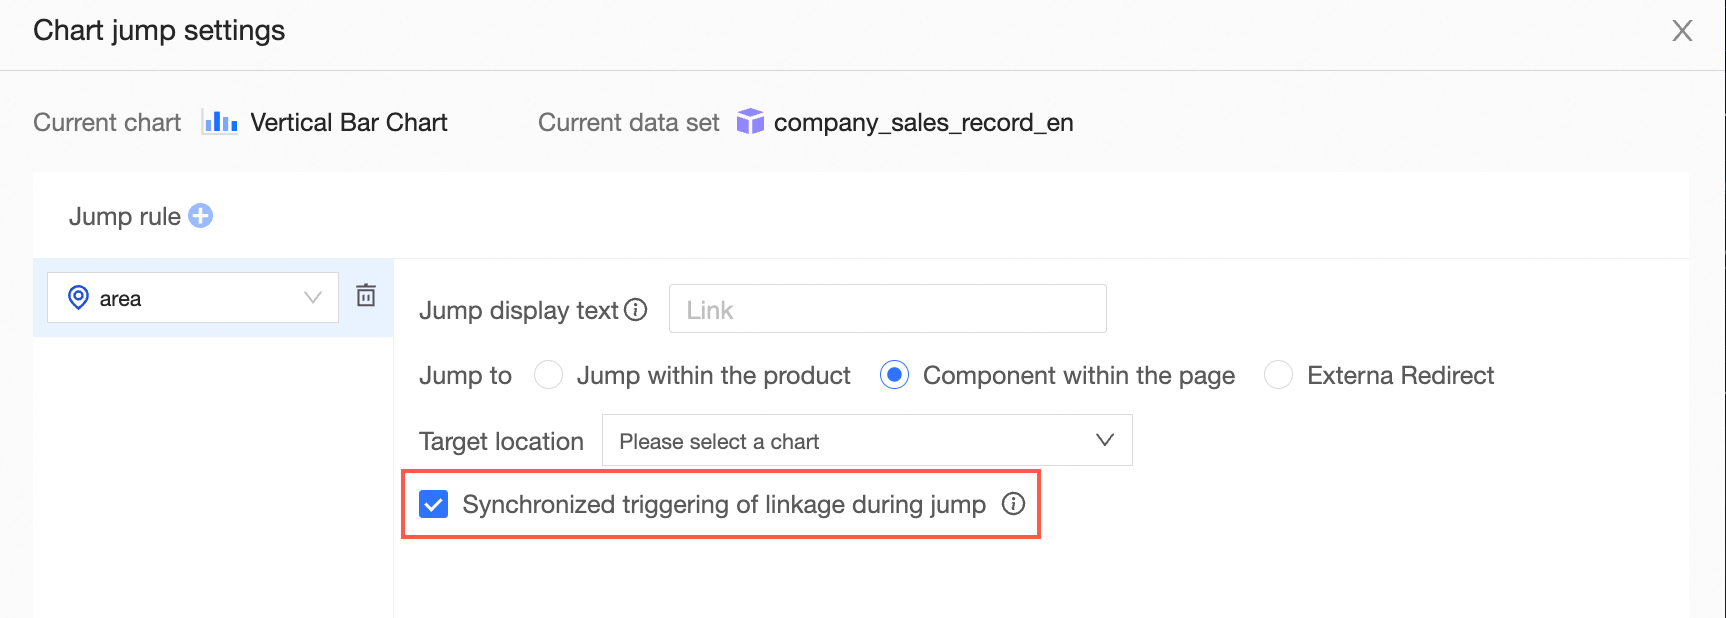
On the Redirection Settings page, select the fields to bind in the Redirection Rules section on the left. After you select Redirect to and choose the Page Component option, select the charts and components on the current page in the Target Location section.
When Sync Filter Interaction on Redirection is enabled in same-page redirection, both filter interaction and redirection take effect simultaneously when you click a redirection field.
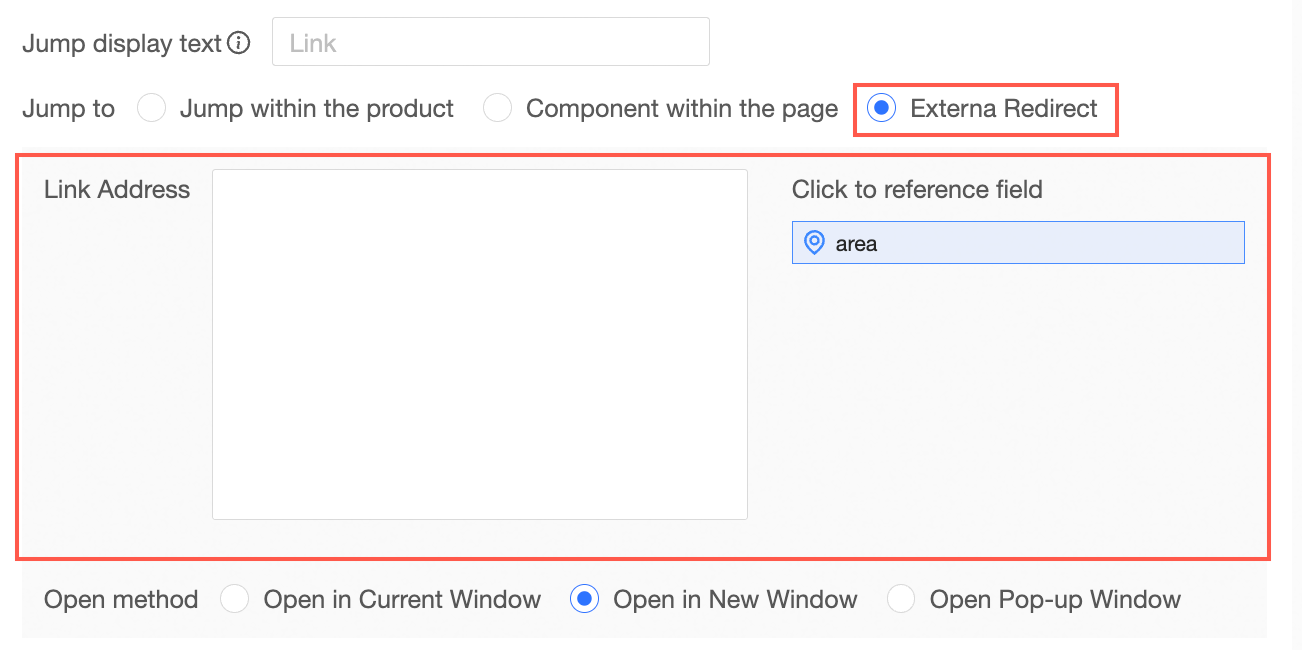
External Link Redirection
When you choose External Link as the redirection method, you can redirect to a specified URL or pass parameters to an integrated user system.
On the Redirection Settings page, select a field to bind on the left, choose External Link as the Redirection To method, enter a URL, and click OK.
In the URL field, enter the destination URL directly or double-click a dimension field from the chart to insert it into the URL.
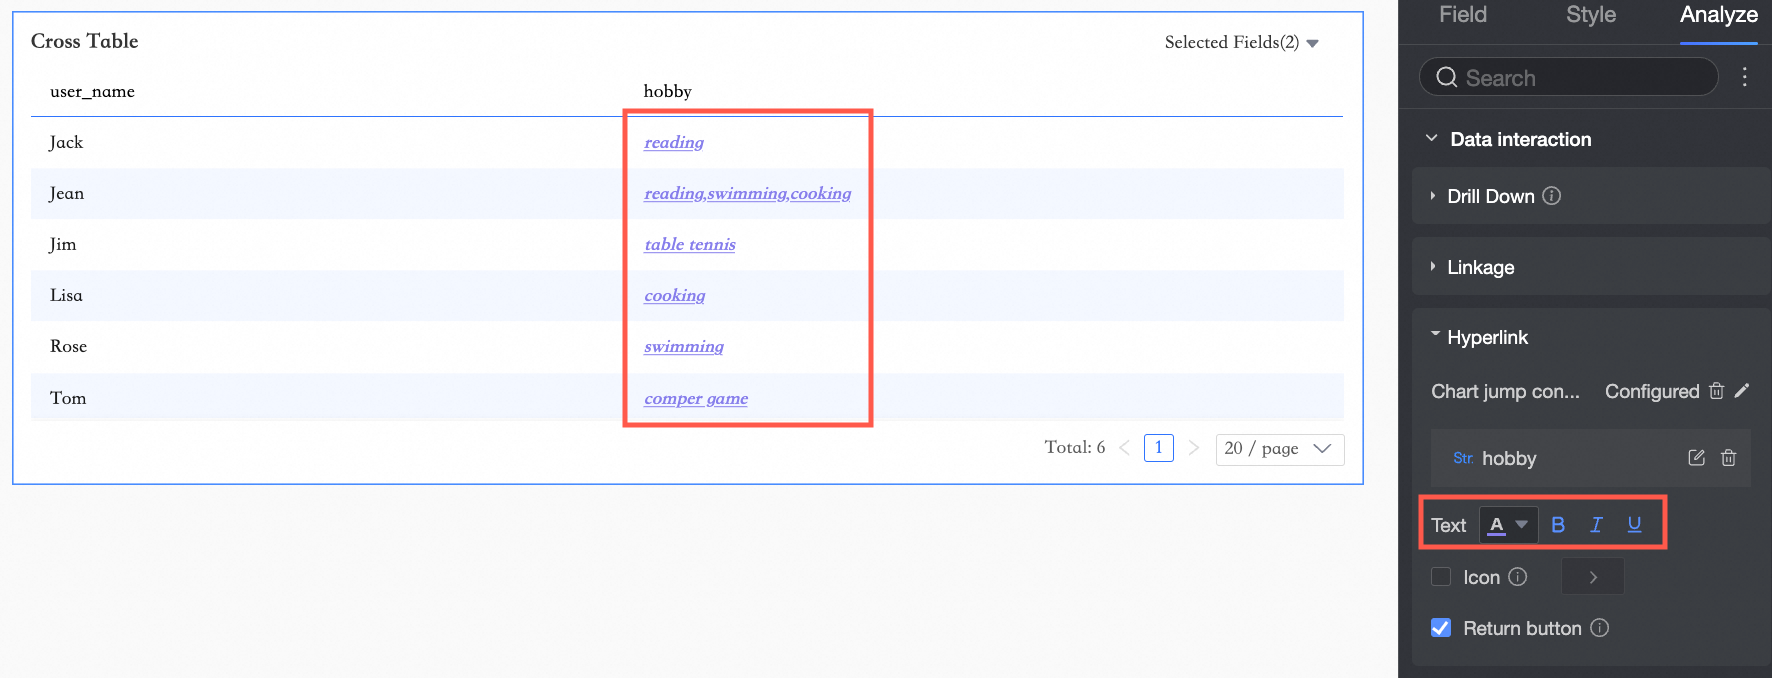
Configure Redirection Styling
Only text-based charts support redirection styling.
Operation Entry
Go to the Analyze tab (①) for the chart, then click Redirection in the Data Interaction section to expand the Configuration Items (②).
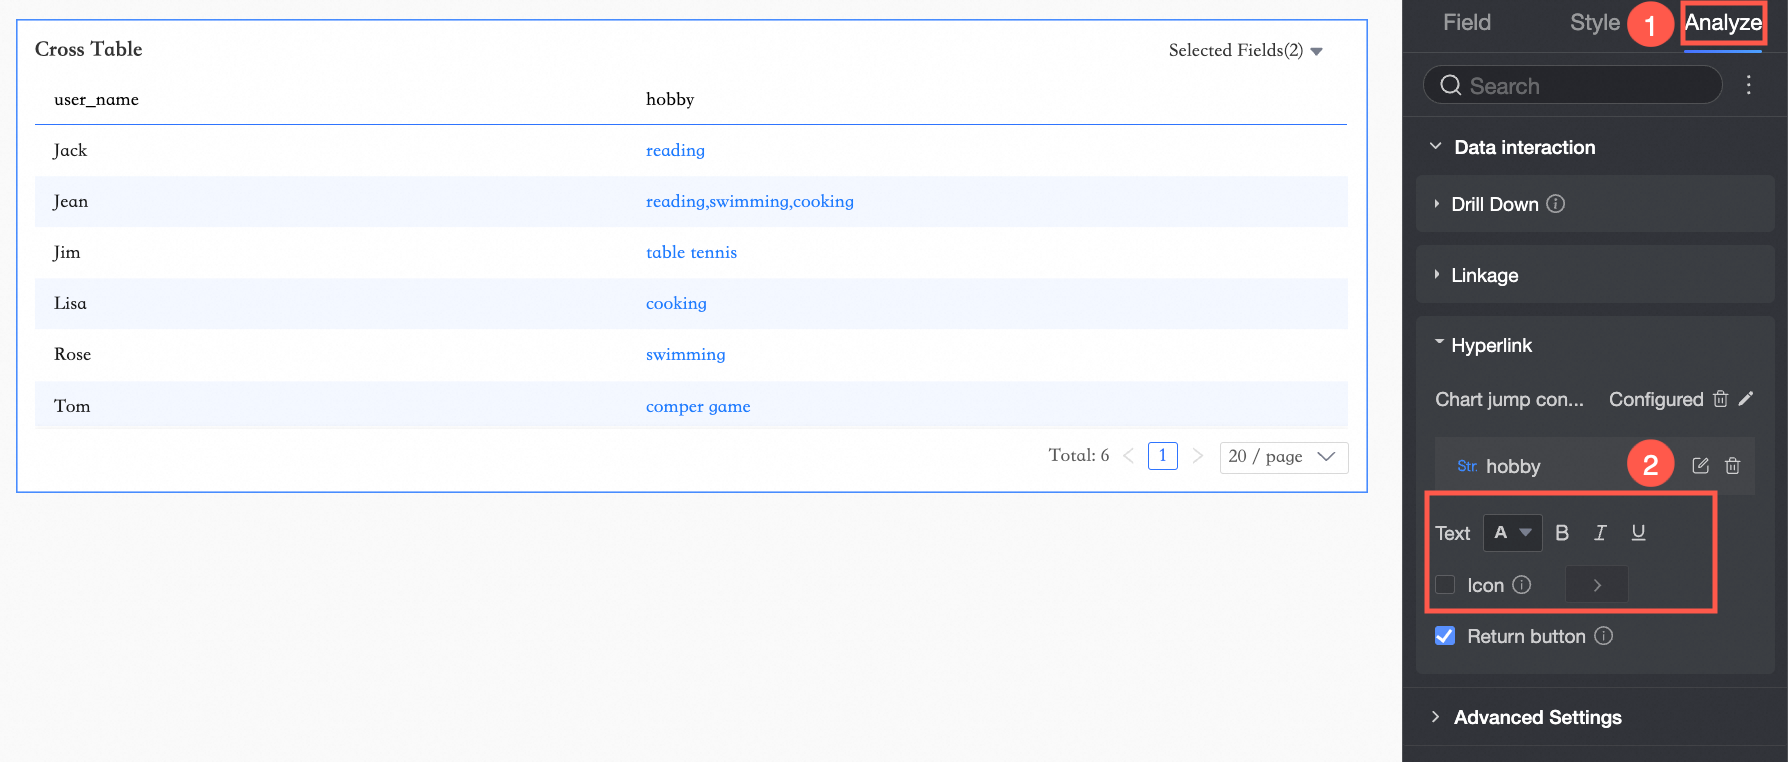
Configuration Items
|
Configuration Item |
Description |
|
Text |
Set the text style for the redirection field. Options include color, bold, italic, and underline.
Note
Not supported for metric charts. |
|
Icon |
Select Icon to display a redirection icon next to the bound field. You can choose a custom icon.
Note
Supported only for these chart types: cross tables, detail tables, multidimensional analysis tables, scorecards, metric relationship charts, metric trends charts, and leaderboards. |
|
Back Button |
Select Back Button to let users return from the redirected page to the current page. Note
The back button works only for Current Window and New Window open modes. |