This topic describes how to perform statistical analysis of user access data, view rankings of active resources and users, track access volumes, and review resource access logs.
Background information
The access analysis feature is available only in the Pro and Professional Edition.
Only organization administrators and users with custom roles that have artificial intelligence for IT operations permissions can view and manage the access analysis feature.
Only users with workspace management permissions can view and manage the workspace-level resource analysis feature.
Organization-level access analysis
This panel provides organization-level resource access analysis for organization administrators and users with custom roles that have artificial intelligence for IT operations permissions.
Feature entry
On the Tenant Management page, in the navigation pane on the left, choose Artificial Intelligence for IT Operations > Statistical Analysis > Access Analysis.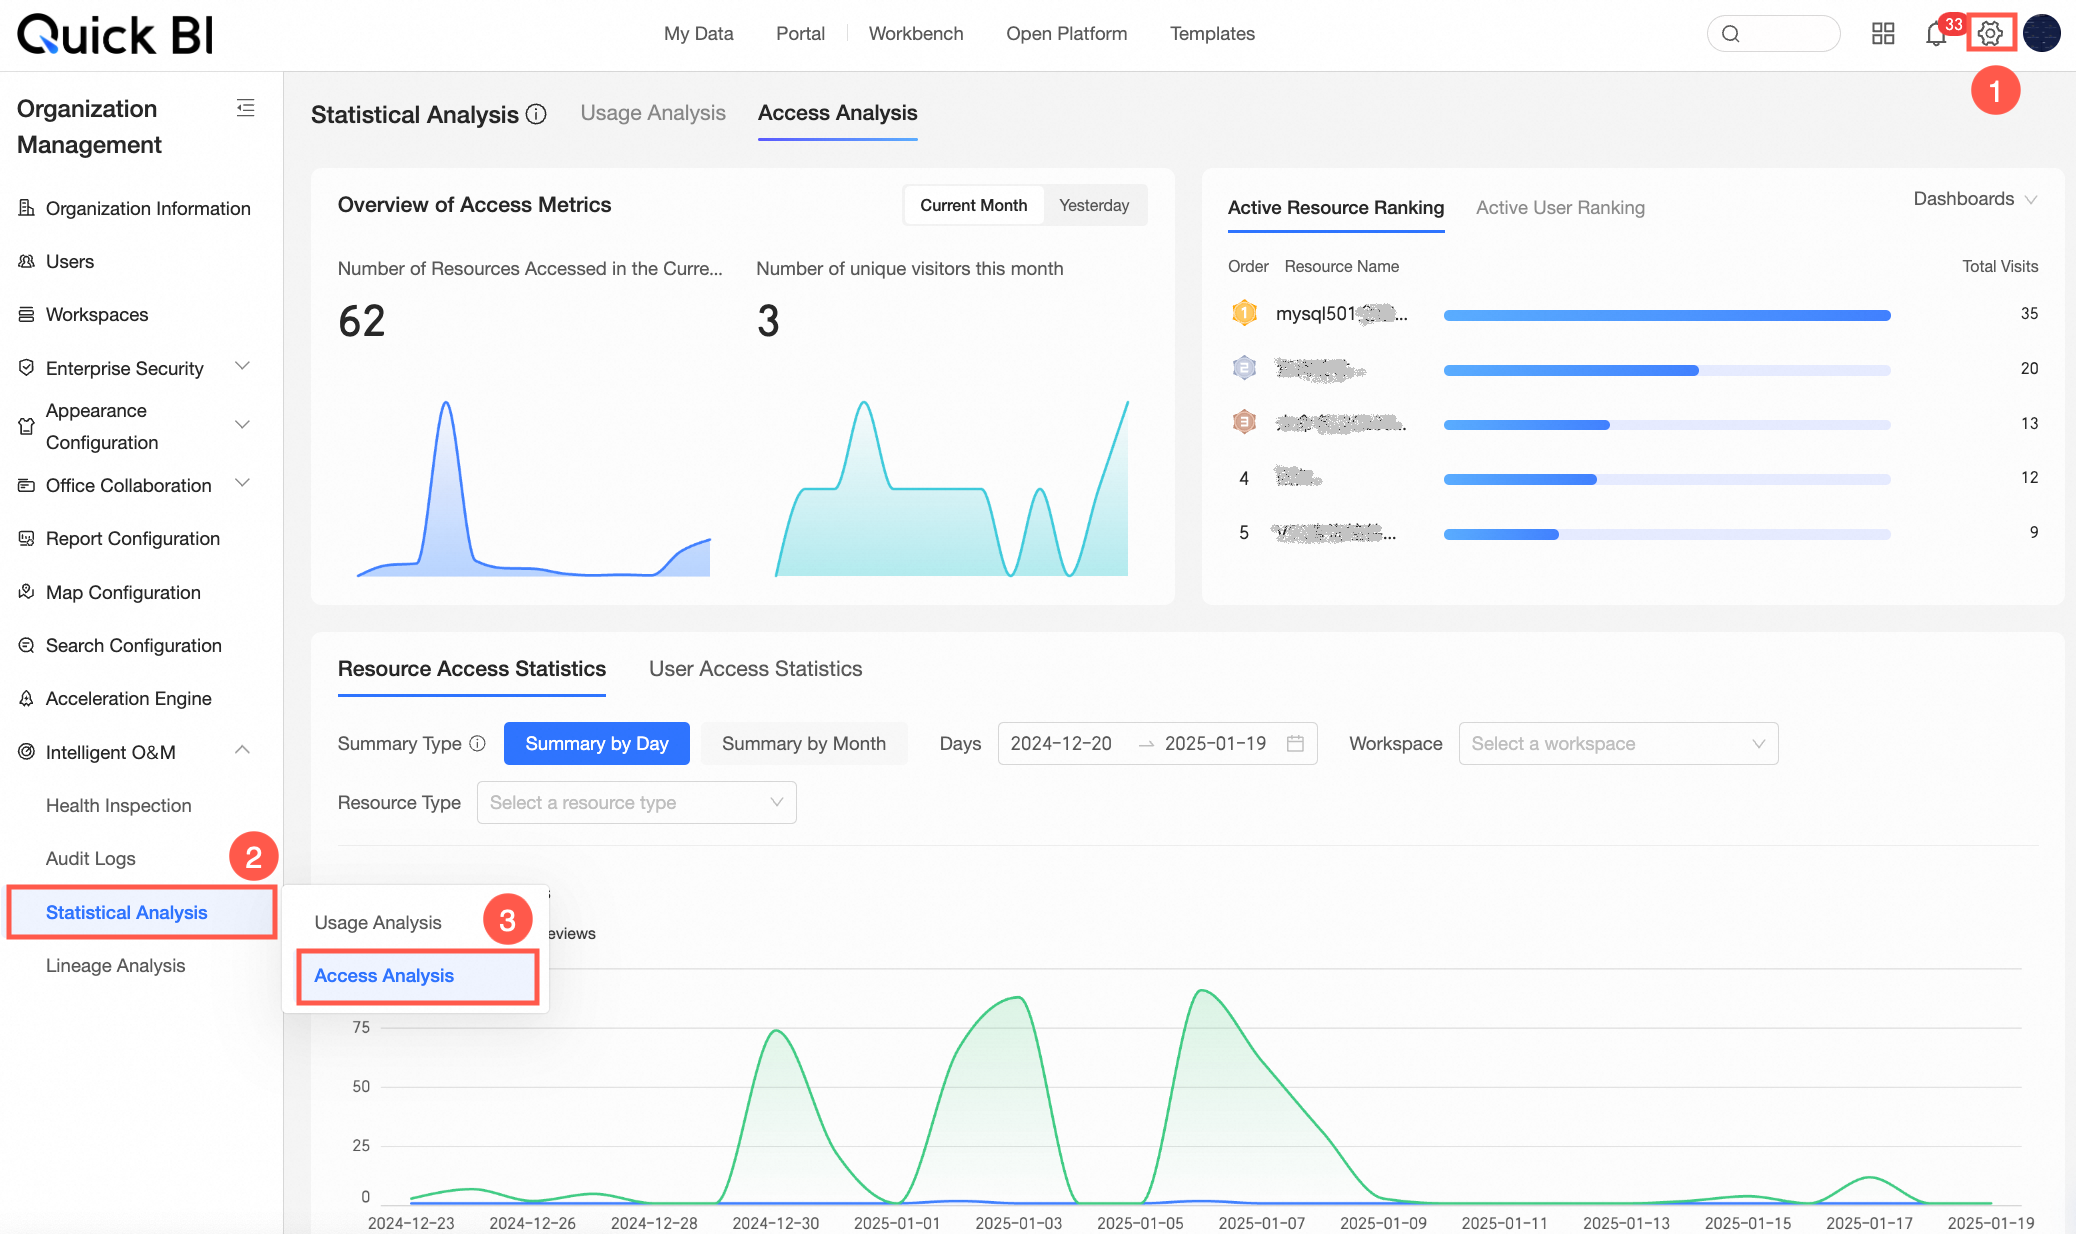
Panel content
Active metrics overview
You can view the access metrics overview and activity ranking for resources in the current organization.
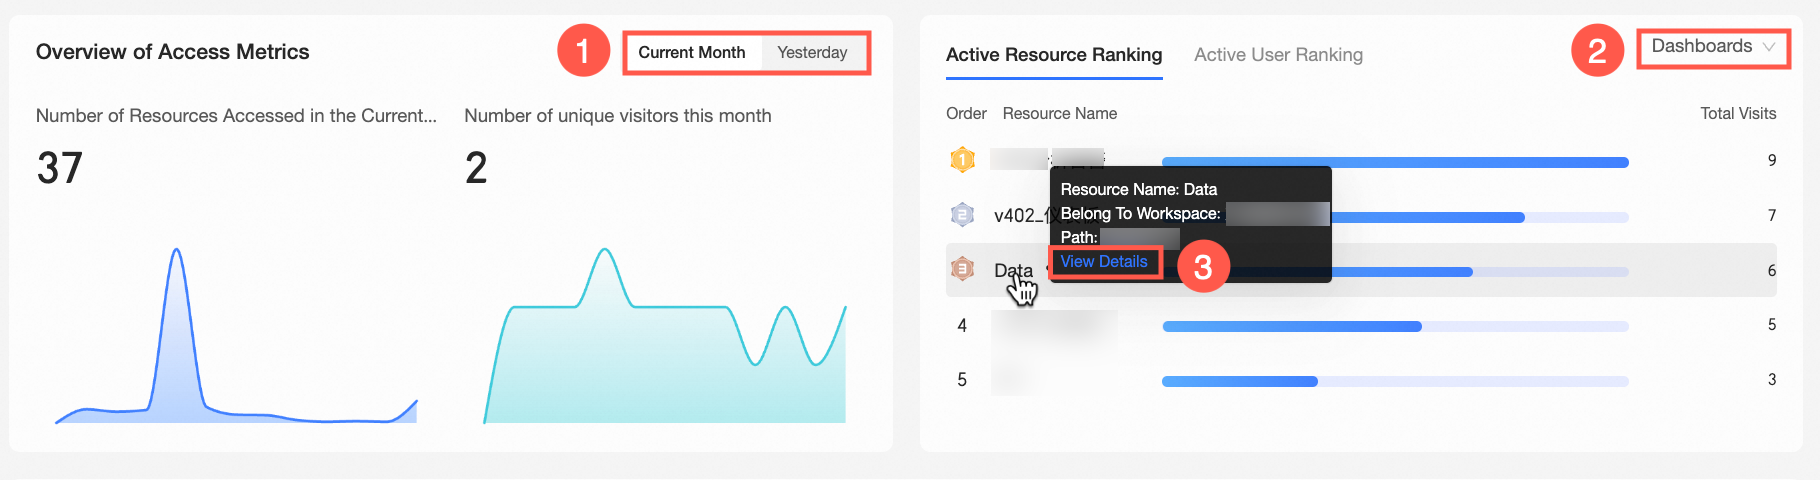
Access metrics overview: Displays the trend in the number of accessed resources and access users. By default, data for the current month is displayed. You can switch to yesterday's data by clicking the tab (①) in the upper-right corner.
NoteMonthly dimension statistics: Displays the trend of cumulative active users per month for the last 12 months, including the current month.
Yesterday dimension statistics: Displays the trend of cumulative active users per day for the last 30 days, including yesterday.
Activity ranking: Displays the ranking of active resources, active users, and the total number of accesses. By default, the cumulative number of accesses to dashboards is shown. In the drop-down list (②) in the upper-right corner, you can switch the resource type. You can also hover over a resource name and click View Details (③) to open the resource access log.
Access statistics
You can view the resource access statistics and user access statistics for the current organization.
Resource access statistics: On the Resource Access Statistics tab, you can view the access status of resources in the current organization.
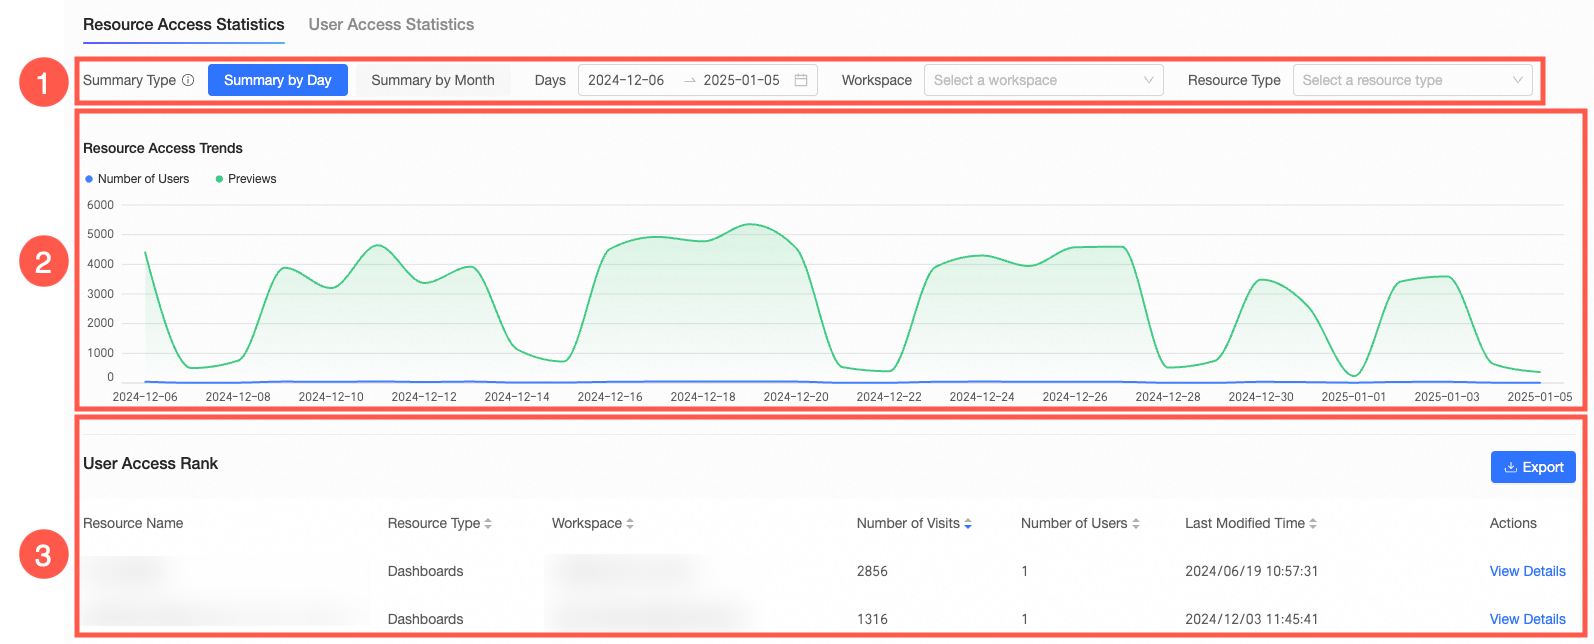
You can perform the following operations:
①: Filter the data by summary type, date range, workspace, and resource type.
②: Displays the resource access trend. The chart in this area updates based on the filters you select in area ①.
③: Displays the resource access ranking. In the Operations column, click View Details to open the corresponding access log. You can also click the Export button in the upper-right corner to export the resource access ranking data on the current page to a local Excel file.
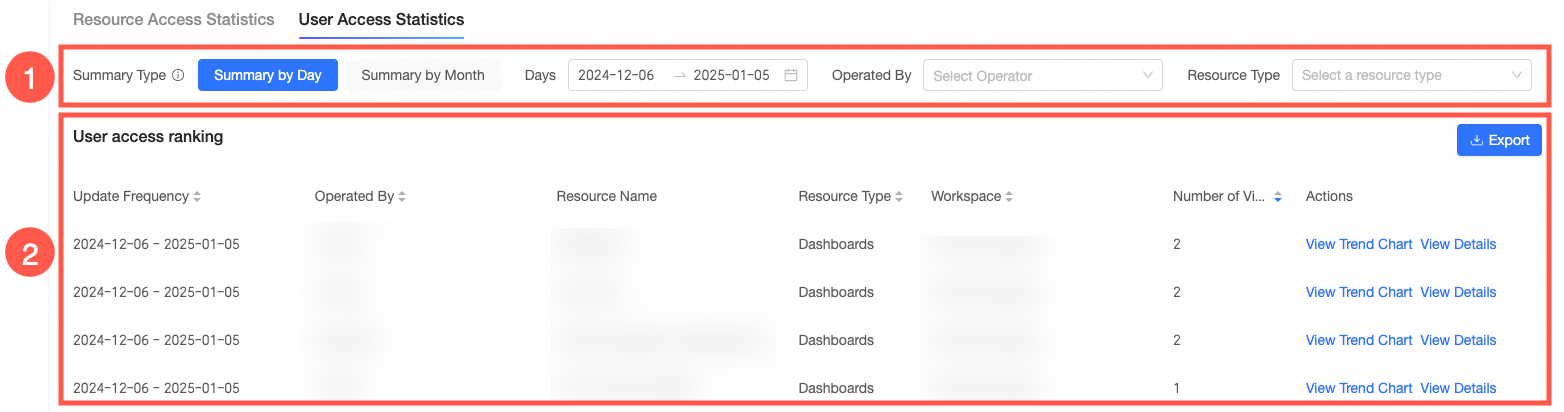
User access statistics: On the User Access Statistics tab, you can view the user access status in the current organization.
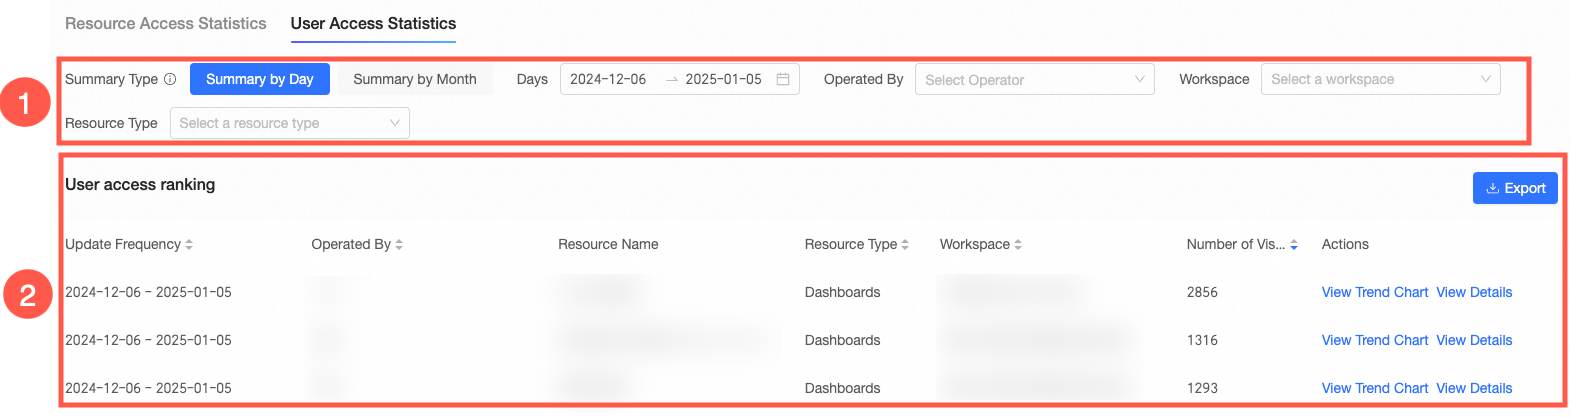
You can perform the following operations:
①: Filter the data by summary type, date range, operator, workspace, and resource type.
②: Displays the user access ranking. In the Operations column, click View Trend to open a pop-up window that shows the access trend for that operator and resource. You can also click the Export button in the upper-right corner to export the user access ranking data on the current page to a local Excel file.
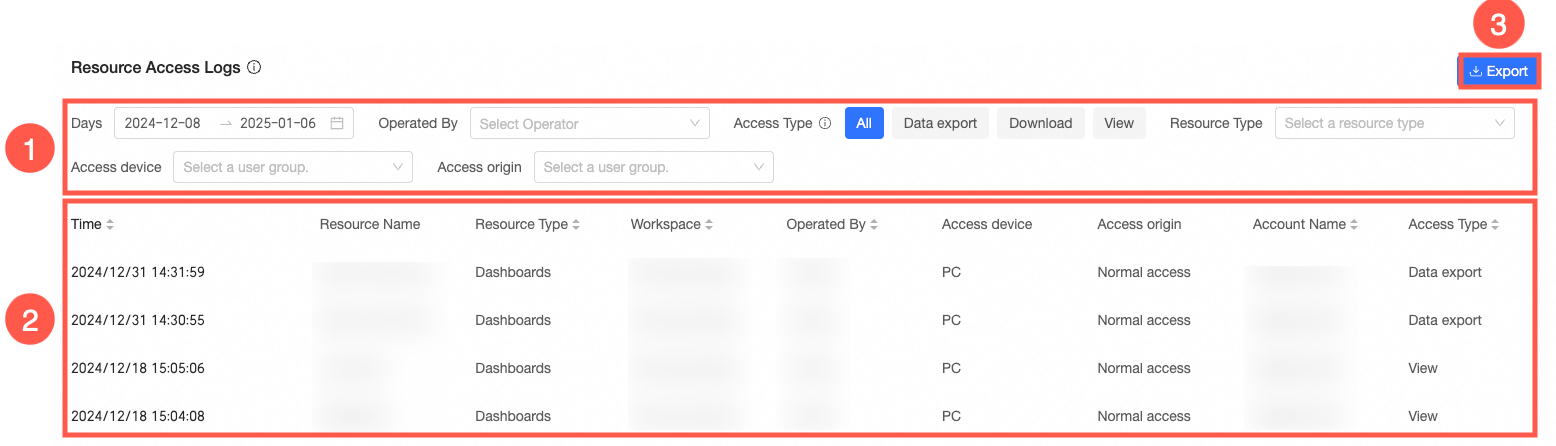
Resource access log
You can view the resource access log of the current organization.
NoteLog data is retained for 30 days. A maximum of 10,000 entries are displayed on the page.
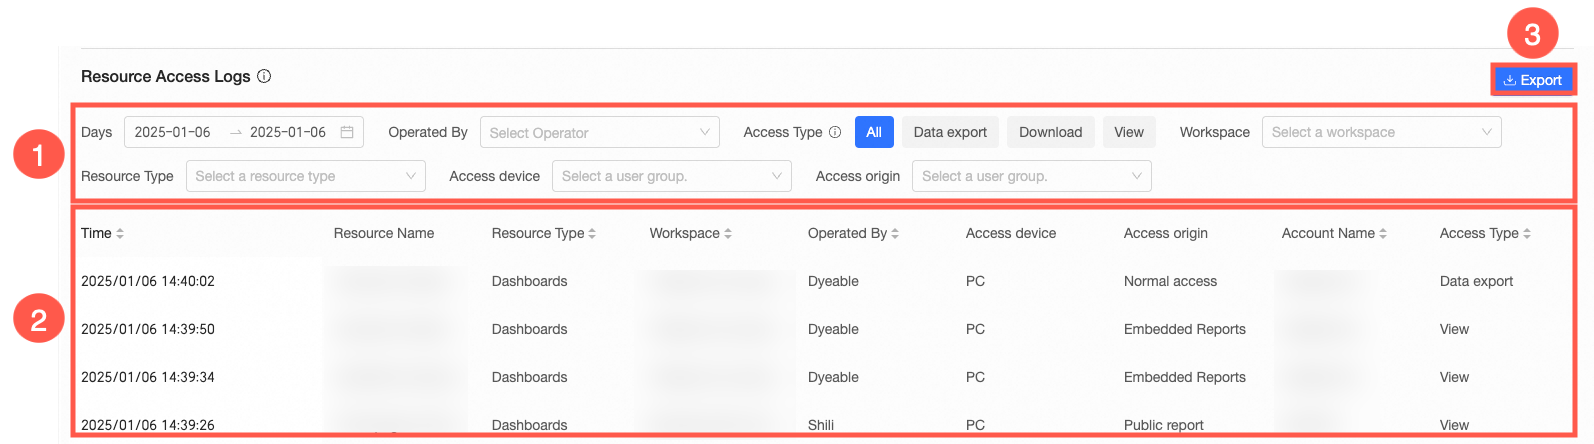
You can perform the following operations:
①: Filter the data by date range, operator, access type, workspace, resource type, access device, and access source.
②: Displays the details of the resource access log. The content in this area updates based on the filters you select in area ①.
③: Click the Export button to export the current page of the resource access log to a local Excel file.
Workspace-level access analysis
This section describes the workspace-level resource access analysis panel, which is primarily for workspace administrators. If organization administrators access this panel from workspace management, their view is limited to the current workspace.
Organization administrators must have management permissions for the workspace to view its access analysis.
Feature entry
On the Workbench page, in the navigation pane on the left, choose Workspace Management > Resource Analysis > Access Statistics.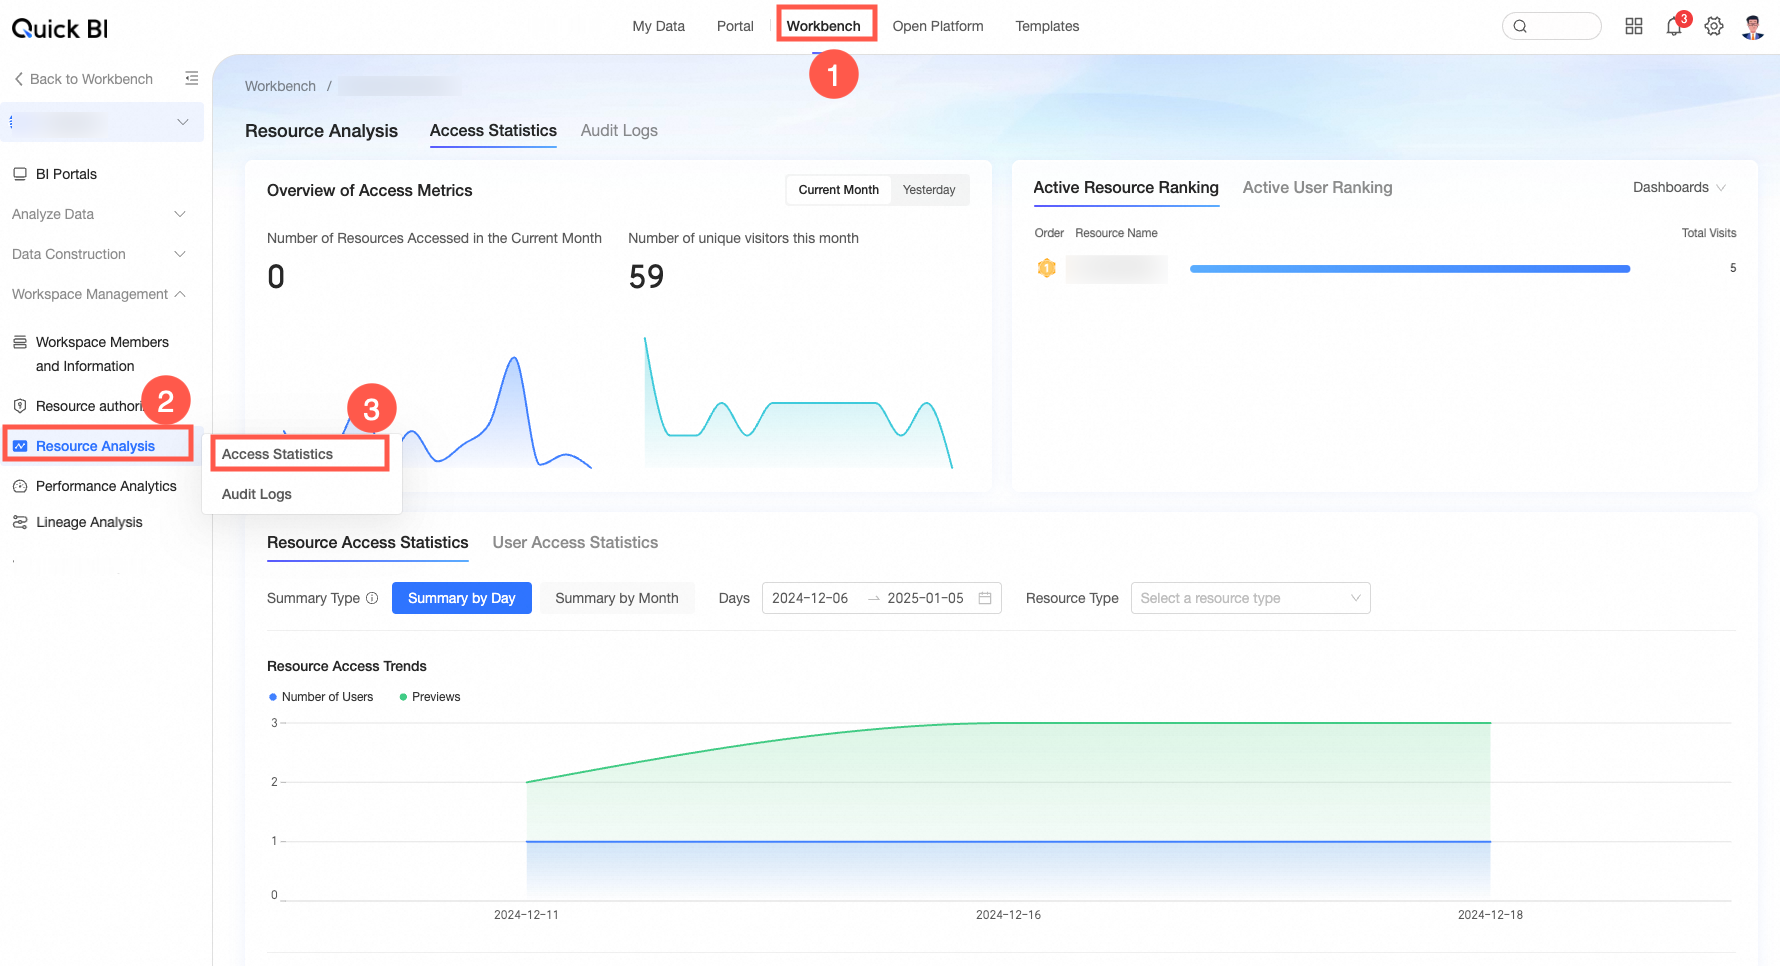
Panel content
Active metrics overview
You can view the access metrics overview and activity ranking for resources in the current workspace.
Access metrics overview: Displays the trend in the number of accessed resources and access users. By default, data for the current month is displayed. You can switch to yesterday's data by clicking the tab (①) in the upper-right corner.
NoteMonthly dimension statistics: Displays the trend of cumulative active users per month for the last 12 months, including the current month.
Yesterday dimension statistics: Displays the trend of cumulative active users per day for the last 30 days, including yesterday.
Activity ranking: Displays the ranking of active resources, active users, and the total number of accesses. By default, the cumulative number of accesses to dashboards is shown. In the drop-down list (②) in the upper-right corner, you can switch the resource type. You can also hover over a resource name and click View Details (③) to open the resource access log.
Access statistics
You can view the resource access statistics and user access statistics for the current workspace.
Resource access statistics: On the Resource Access Statistics tab, you can view the access status of resources in the current workspace.
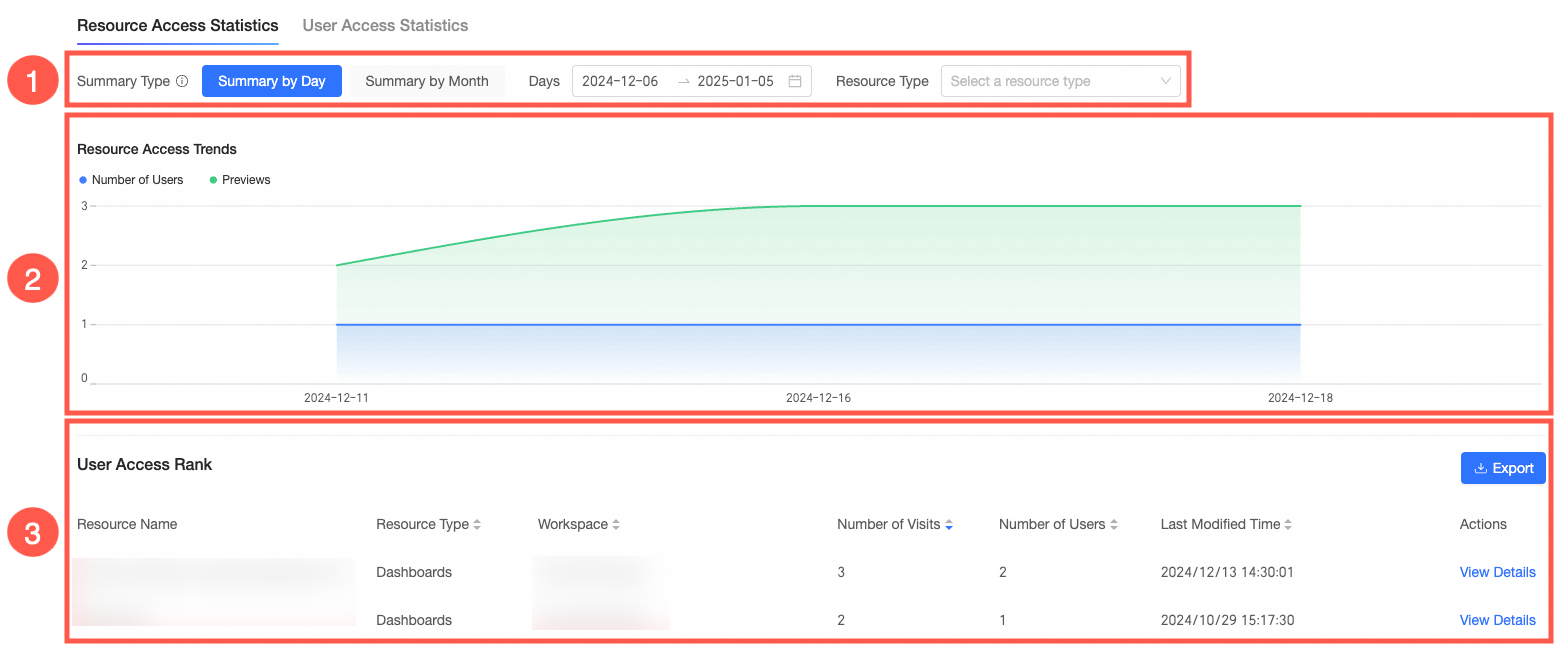
You can perform the following operations:
①: Filter the data by summary type, date range, and resource type.
②: Displays the resource access trend. The chart in this area updates based on the filters you select in area ①.
③: Displays the resource access ranking. In the Operations column, click View Details to open the corresponding access log. You can also click the Export button in the upper-right corner to export the resource access ranking data on the current page to a local Excel file.
User access statistics: On the User Access Statistics tab, you can view the user access status in the current organization.
You can perform the following operations:
①: Filter the data by summary type, date range, operator, and resource type.
②: Displays the user access ranking. In the Operations column, click View Trend to open a pop-up window that shows the access trend for that operator and resource. You can also click the Export button in the upper-right corner to export the user access ranking data on the current page to a local Excel file.
Resource access log
You can view the resource access log of the current workspace.
NoteLog data is retained for 30 days. A maximum of 10,000 entries are displayed on the page.
You can perform the following operations:
①: Filter the data by date range, operator, access type, resource type, access device, and access source.
②: Displays the details of the resource access log. The content in this area updates based on the filters you select in area ①.
③: Click the Export button to export the current page of the resource access log to a local Excel file.
Report-level access analysis
Feature entry
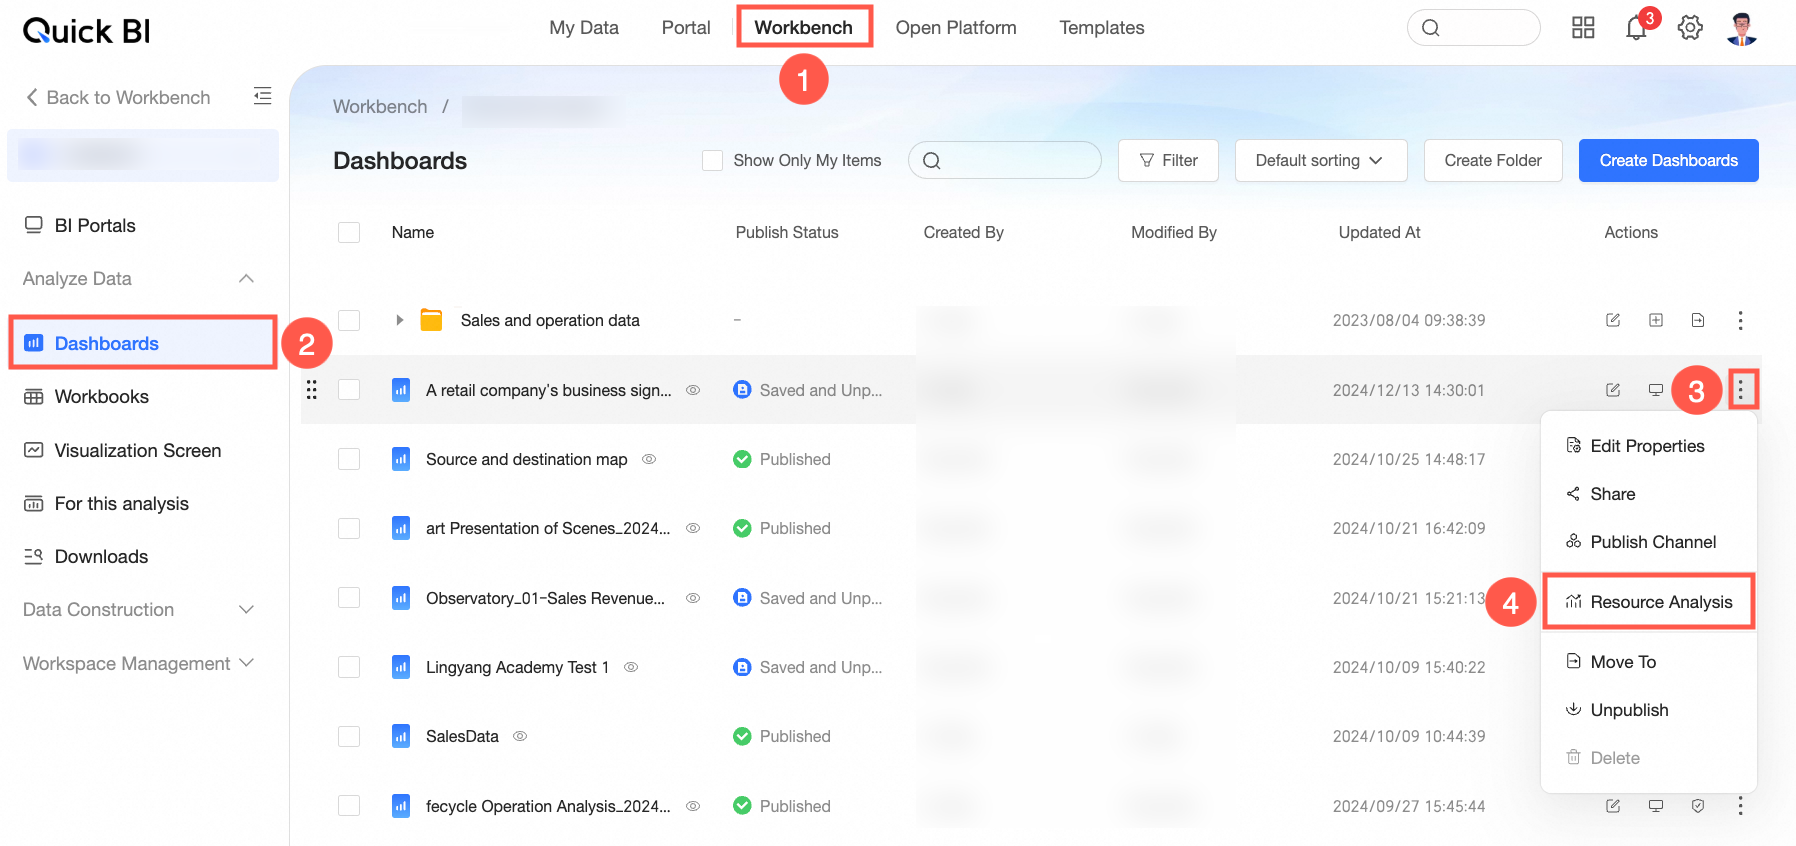
On the Workbench page, under Data Analysis, find the target resource. Then, click the ![]() icon in the Operations column and select Resource Analysis from the drop-down list.
icon in the Operations column and select Resource Analysis from the drop-down list.
Report-level resource analysis is supported for BI portals, dashboards, workbooks, data dashboards, ad hoc analysis, Downloads, and data entry (only for published resources).
This section uses a dashboard as an example.
Panel content
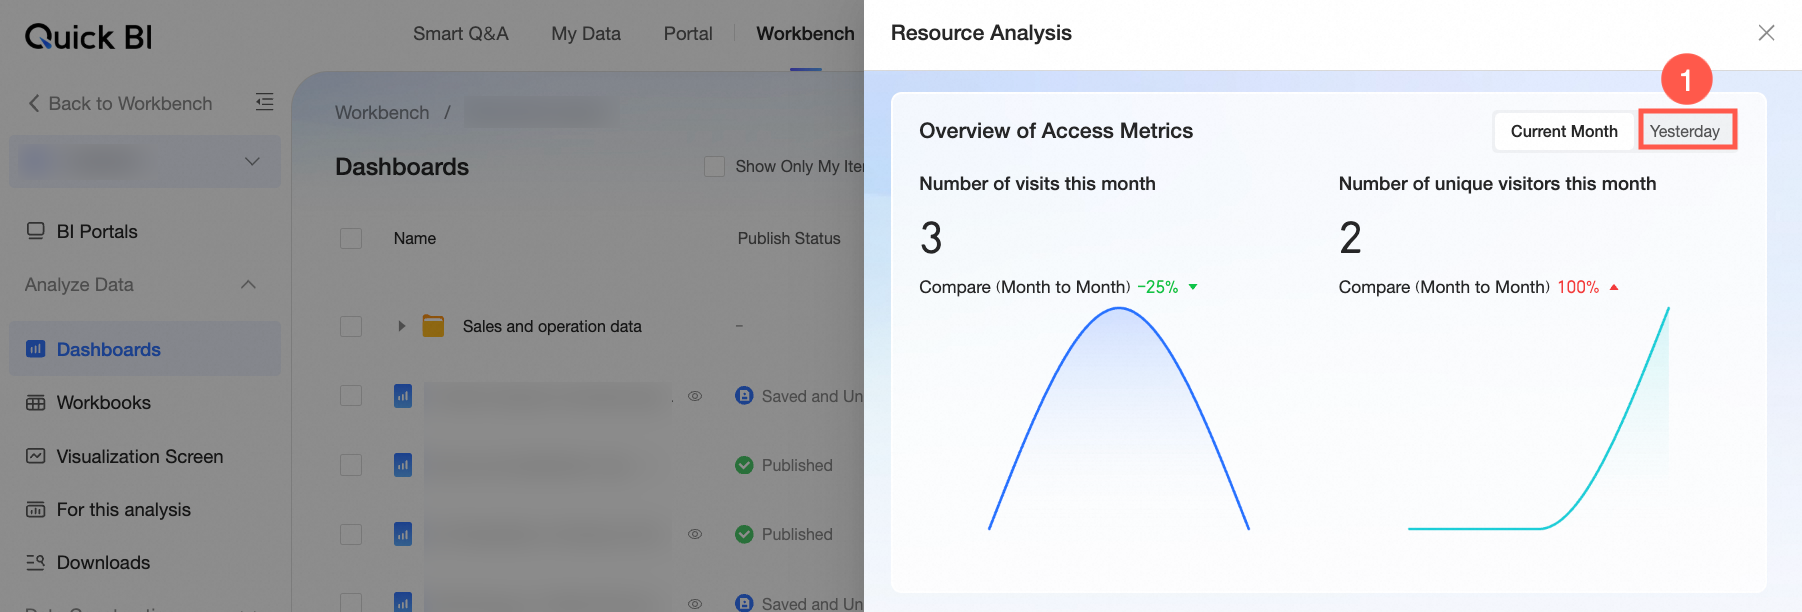
Access metrics overview
You can view the trend of access count and number of access users for the current resource by month or day. By default, data for the current month is displayed. You can switch to yesterday's data by clicking the tab (①) in the upper-right corner.
Access users
You can view the statistical analysis of user access for the current resource.
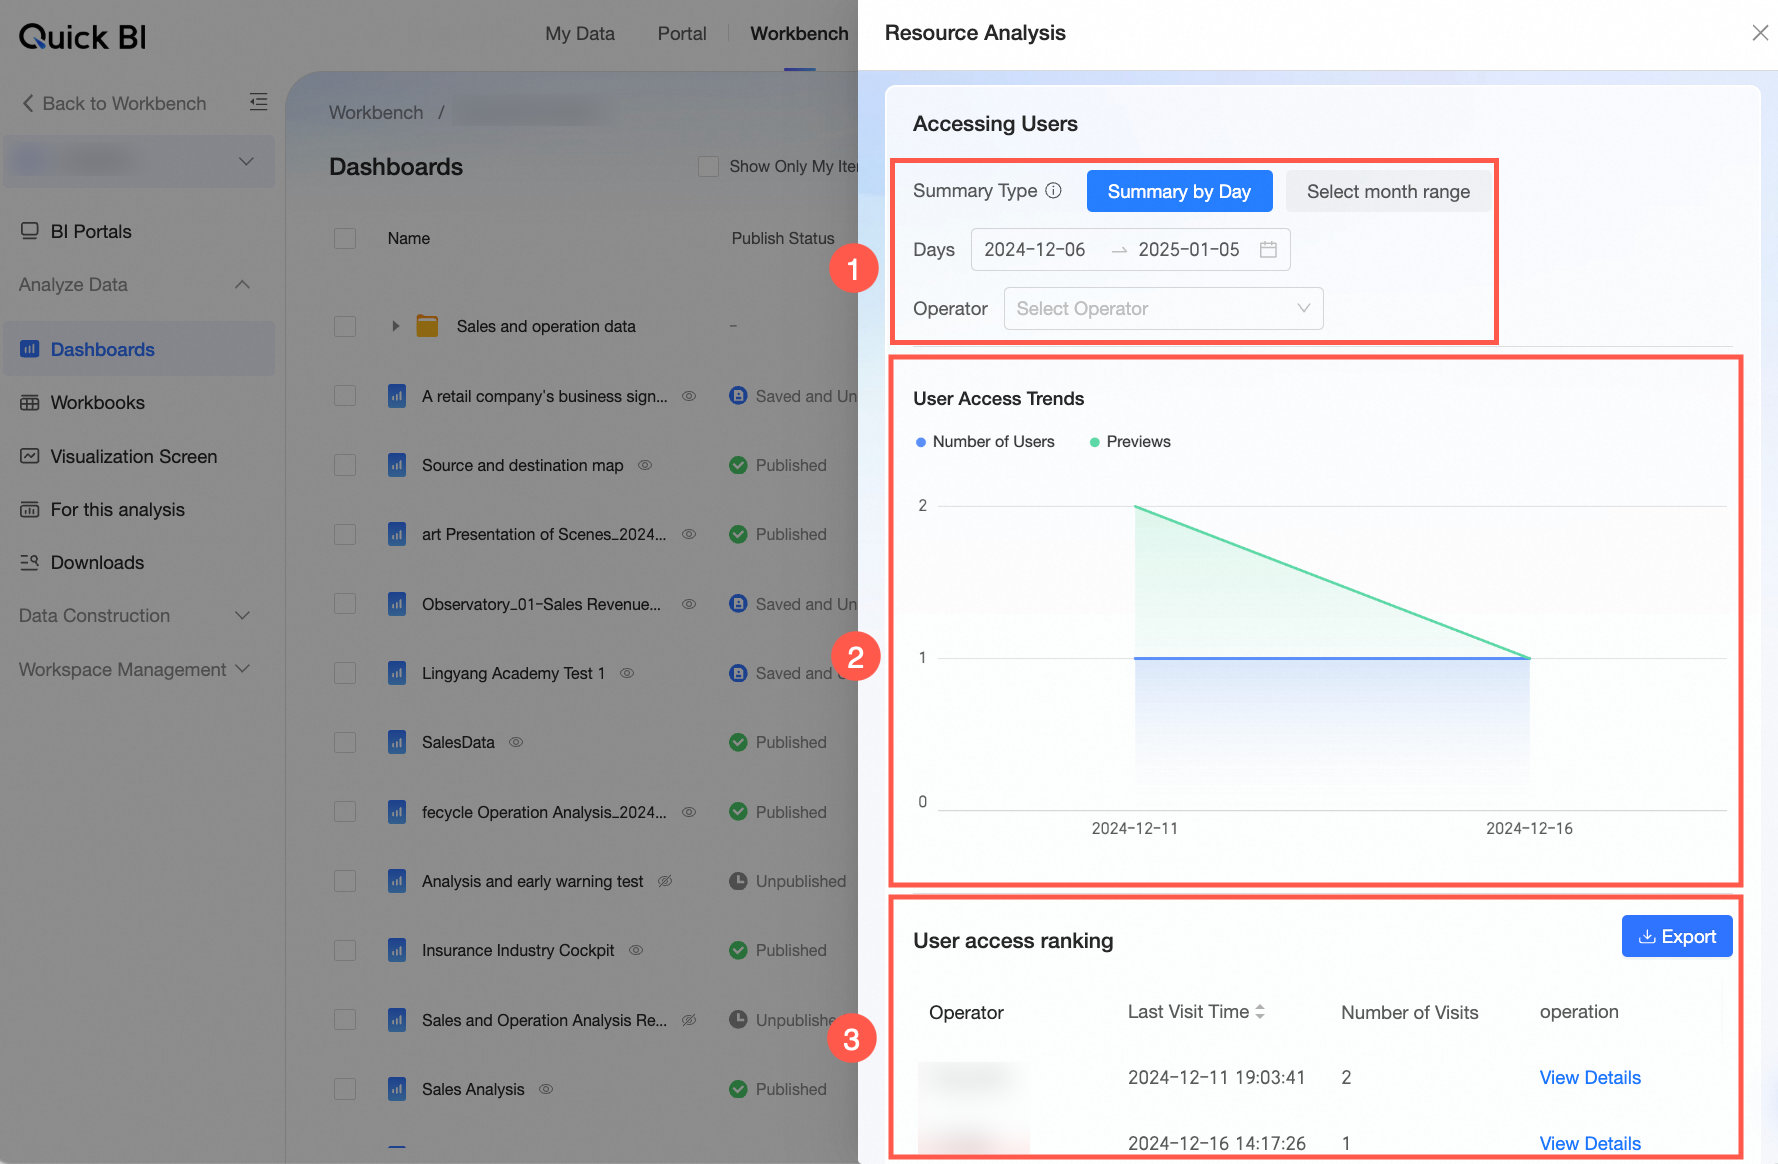
You can perform the following operations:
①: Filter the data by summary type, date range, and operator.
②: Displays the user access data trend, including the number of access users and number of previews. The chart in this area updates based on the filters you select in area ①.
③: Displays the user access ranking. In the Operations column, click View Details to open the User Access Log module and view access details. You can also click the Export button in the upper-right corner to export the user access ranking data on the current page to a local Excel file.
User access log
You can view the access log of the current resource.
NoteLog data is retained for 30 days. A maximum of 10,000 entries are displayed on the page.
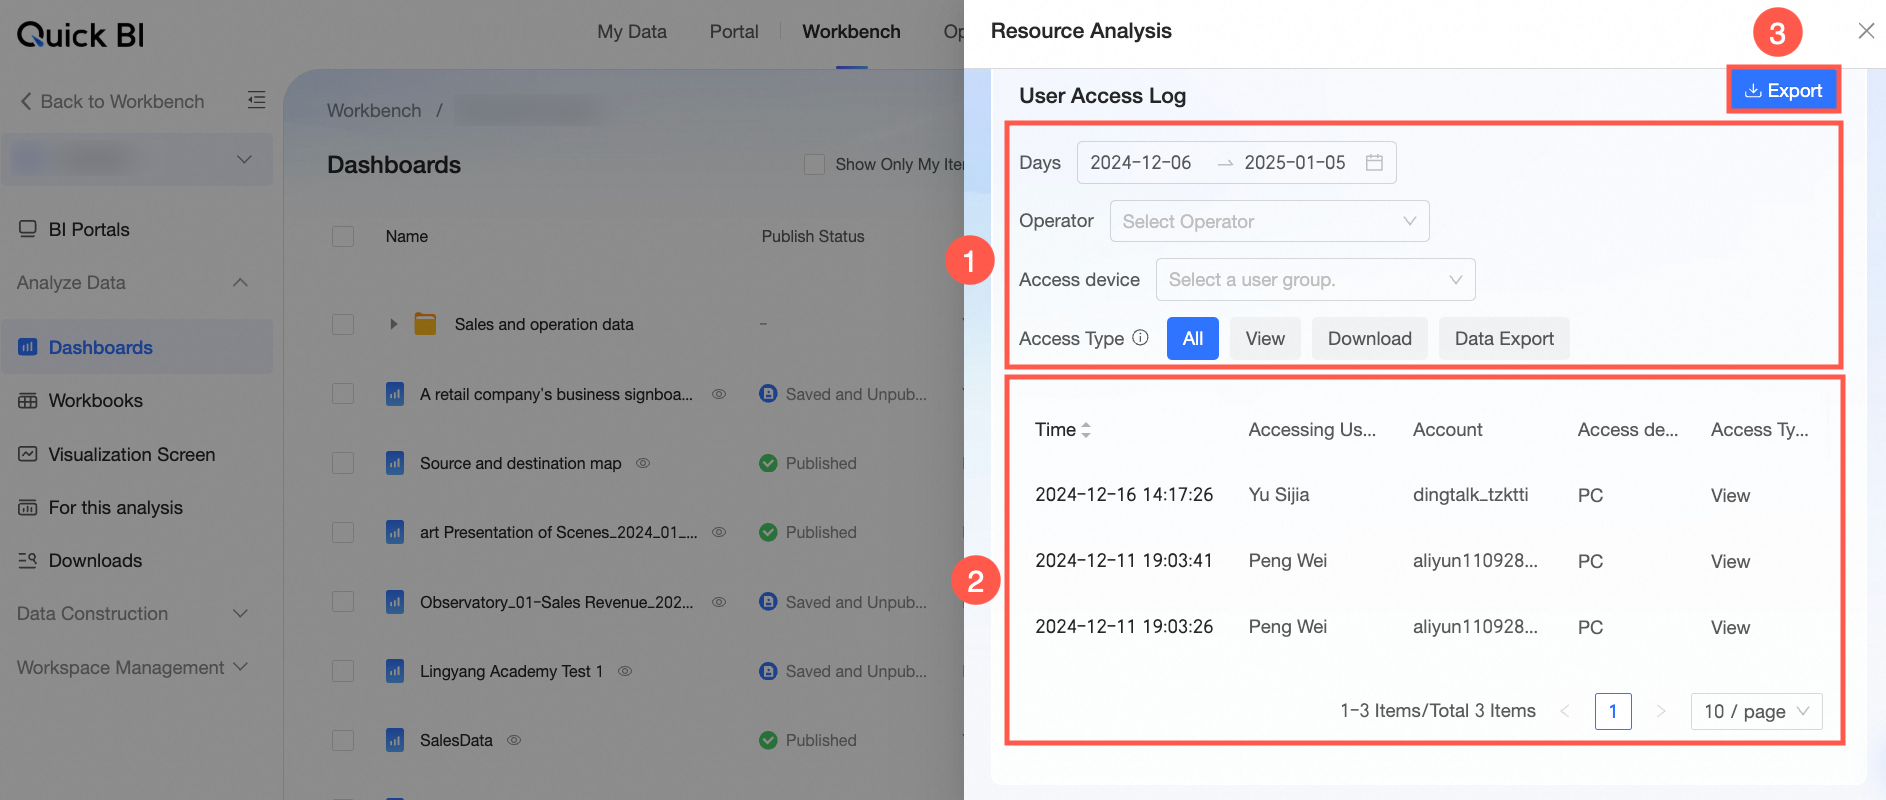
①: Filter the data by date range, operator, access device, and access type.
②: Displays the details of the resource access log, including the date, access user, and account information. The content in this area updates based on the filters you select in area ①.
③: Click the Export button to export the current page of the resource access log to a local Excel file.