Remote users can access dashboards on mobile devices through Quick BI's mobile edit mode. This feature allows toggling between PC and mobile report views with a button at the top of the dashboard. Quick BI offers two distinct building modes for mobile reports via the mobile layout lock. This guide will help you select the appropriate mode for various scenarios and set up your mobile report accordingly.
Entry Point
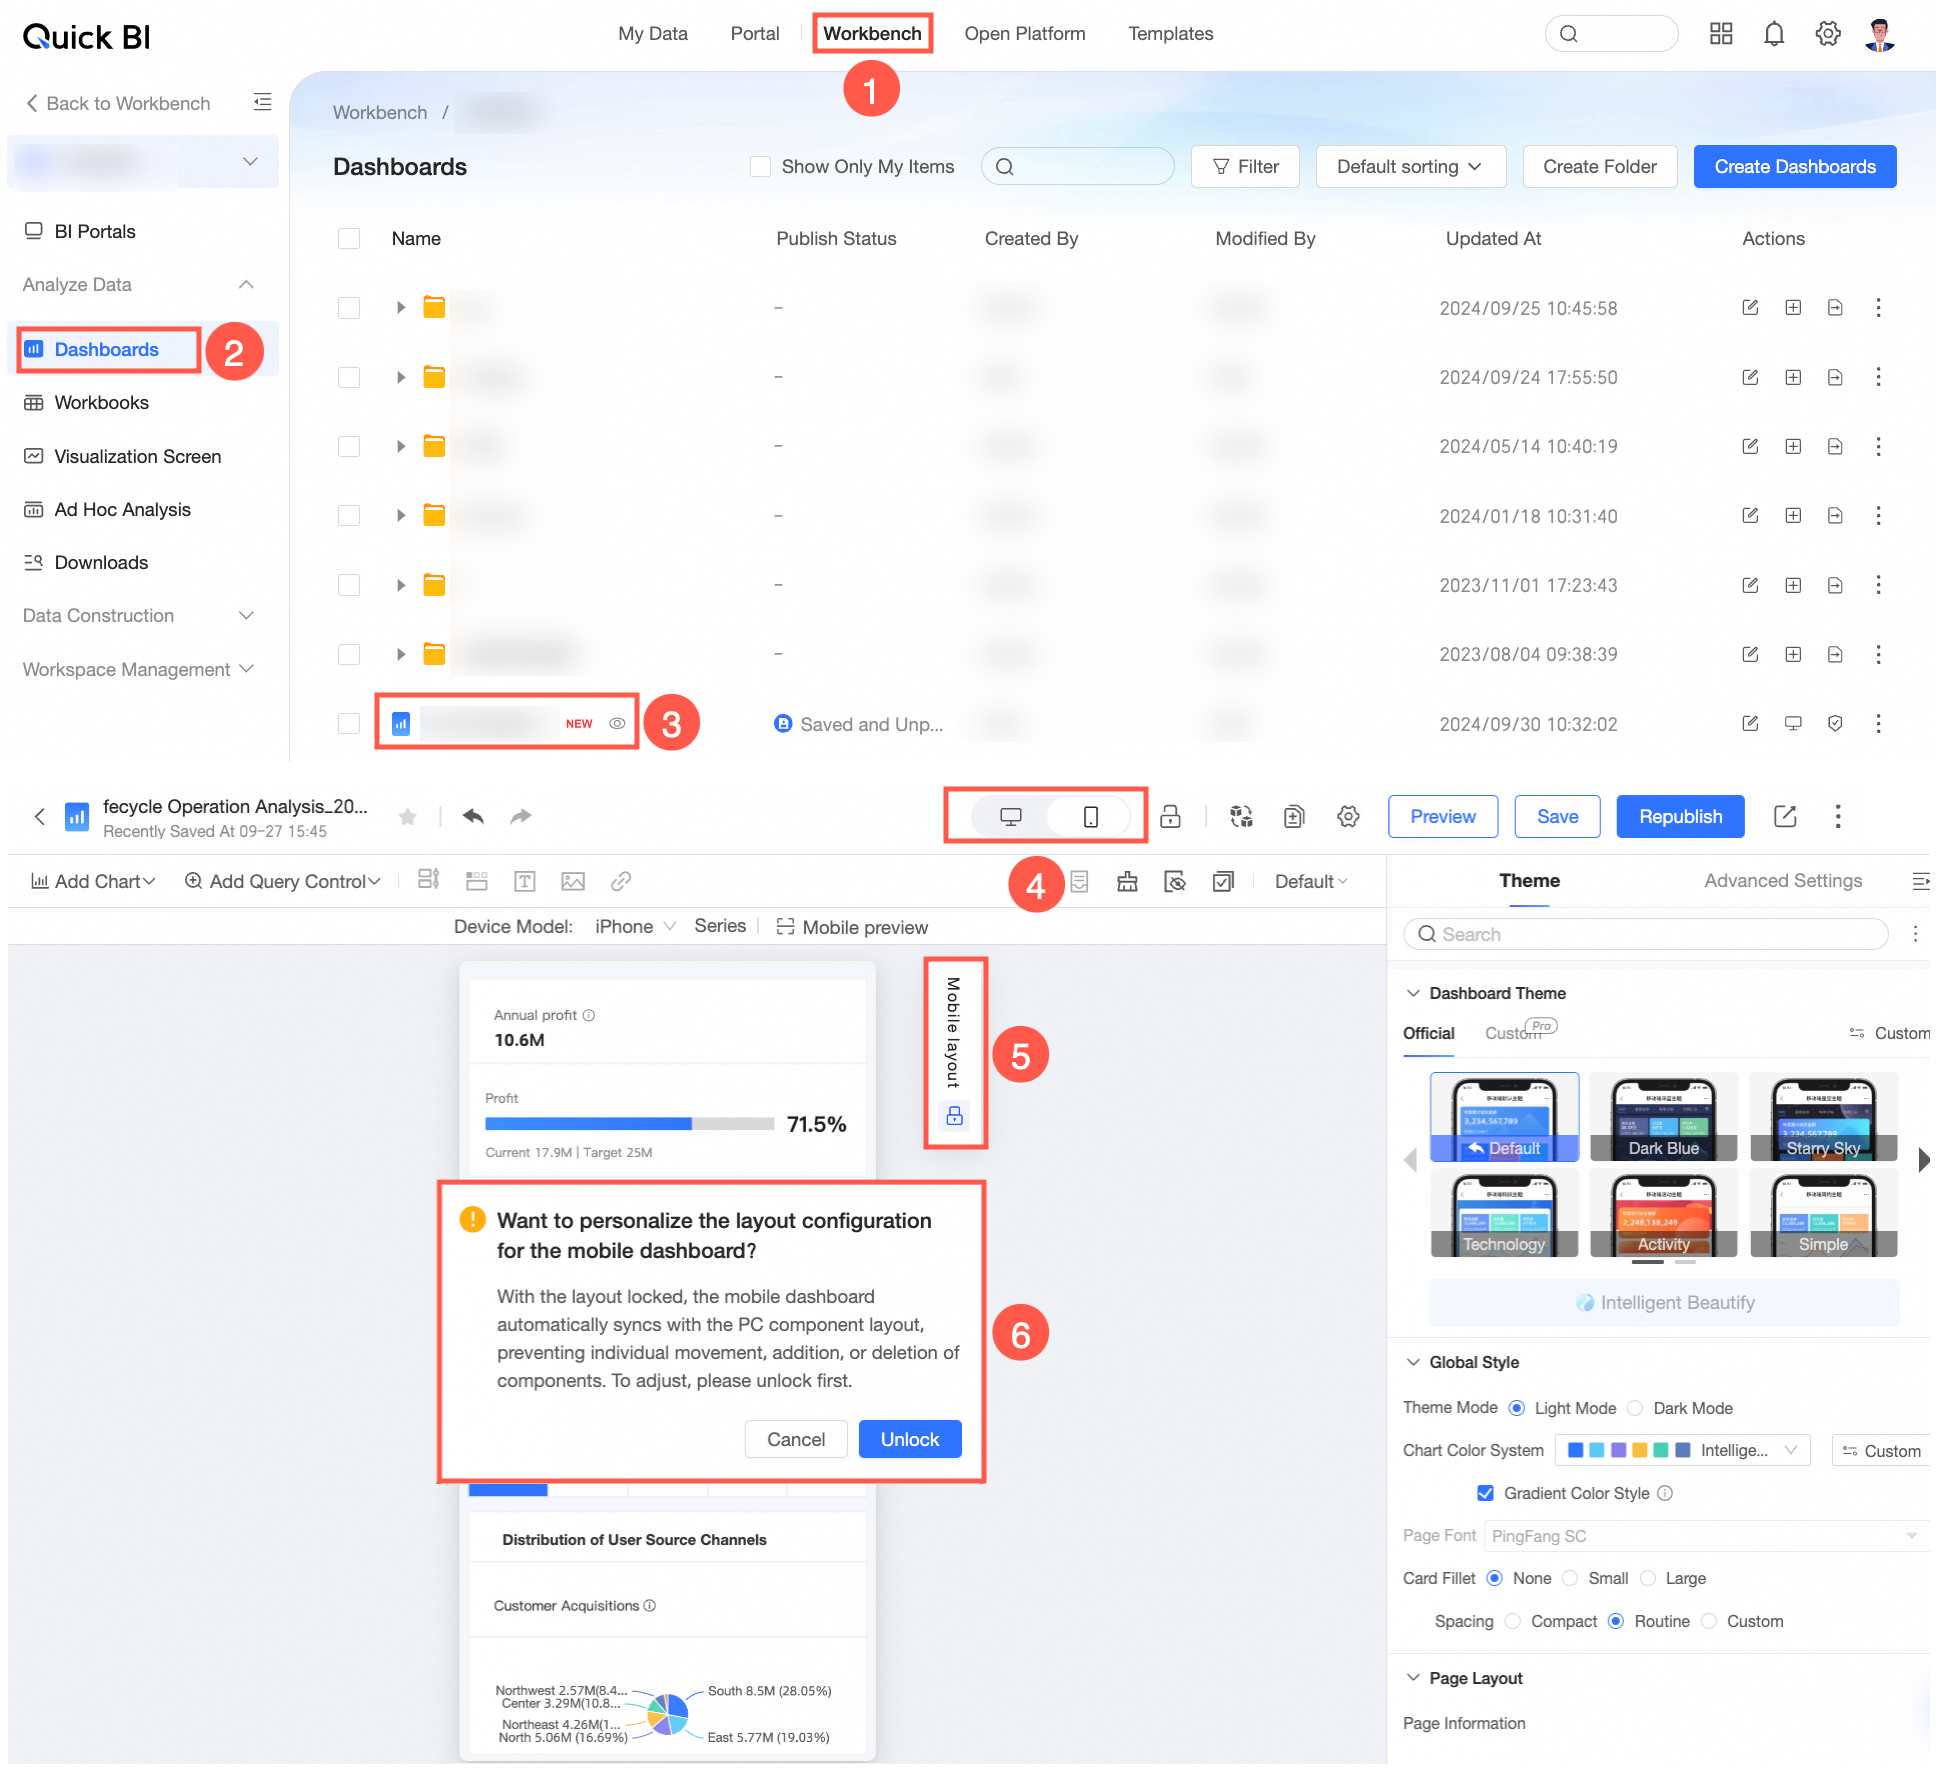
To begin, access the Quick BI console and switch to mobile mode in your desired dashboard within the workspace. Then, activate the mobile layout lock to configure a unique style for the mobile terminal.
In the locked state, the mobile layout lock defaults to a locked position after report creation. The mobile report style will mirror the PC settings, limiting certain configuration actions to maintain content and layout consistency across both platforms. This mode is ideal when the mobile report does not require personalized configurations and the component number and order should align with the PC version.
In the unlocked state, unlocking the mobile layout lock permits independent configuration of the mobile report layout. All mobile terminal configuration features become available. The mobile and PC reports are constructed separately, and their layouts do not influence each other. This mode is best for scenarios that demand unique mobile report adaptations, enabling more intricate and visually appealing layouts on the mobile terminal.
Mobile Report Building Interface
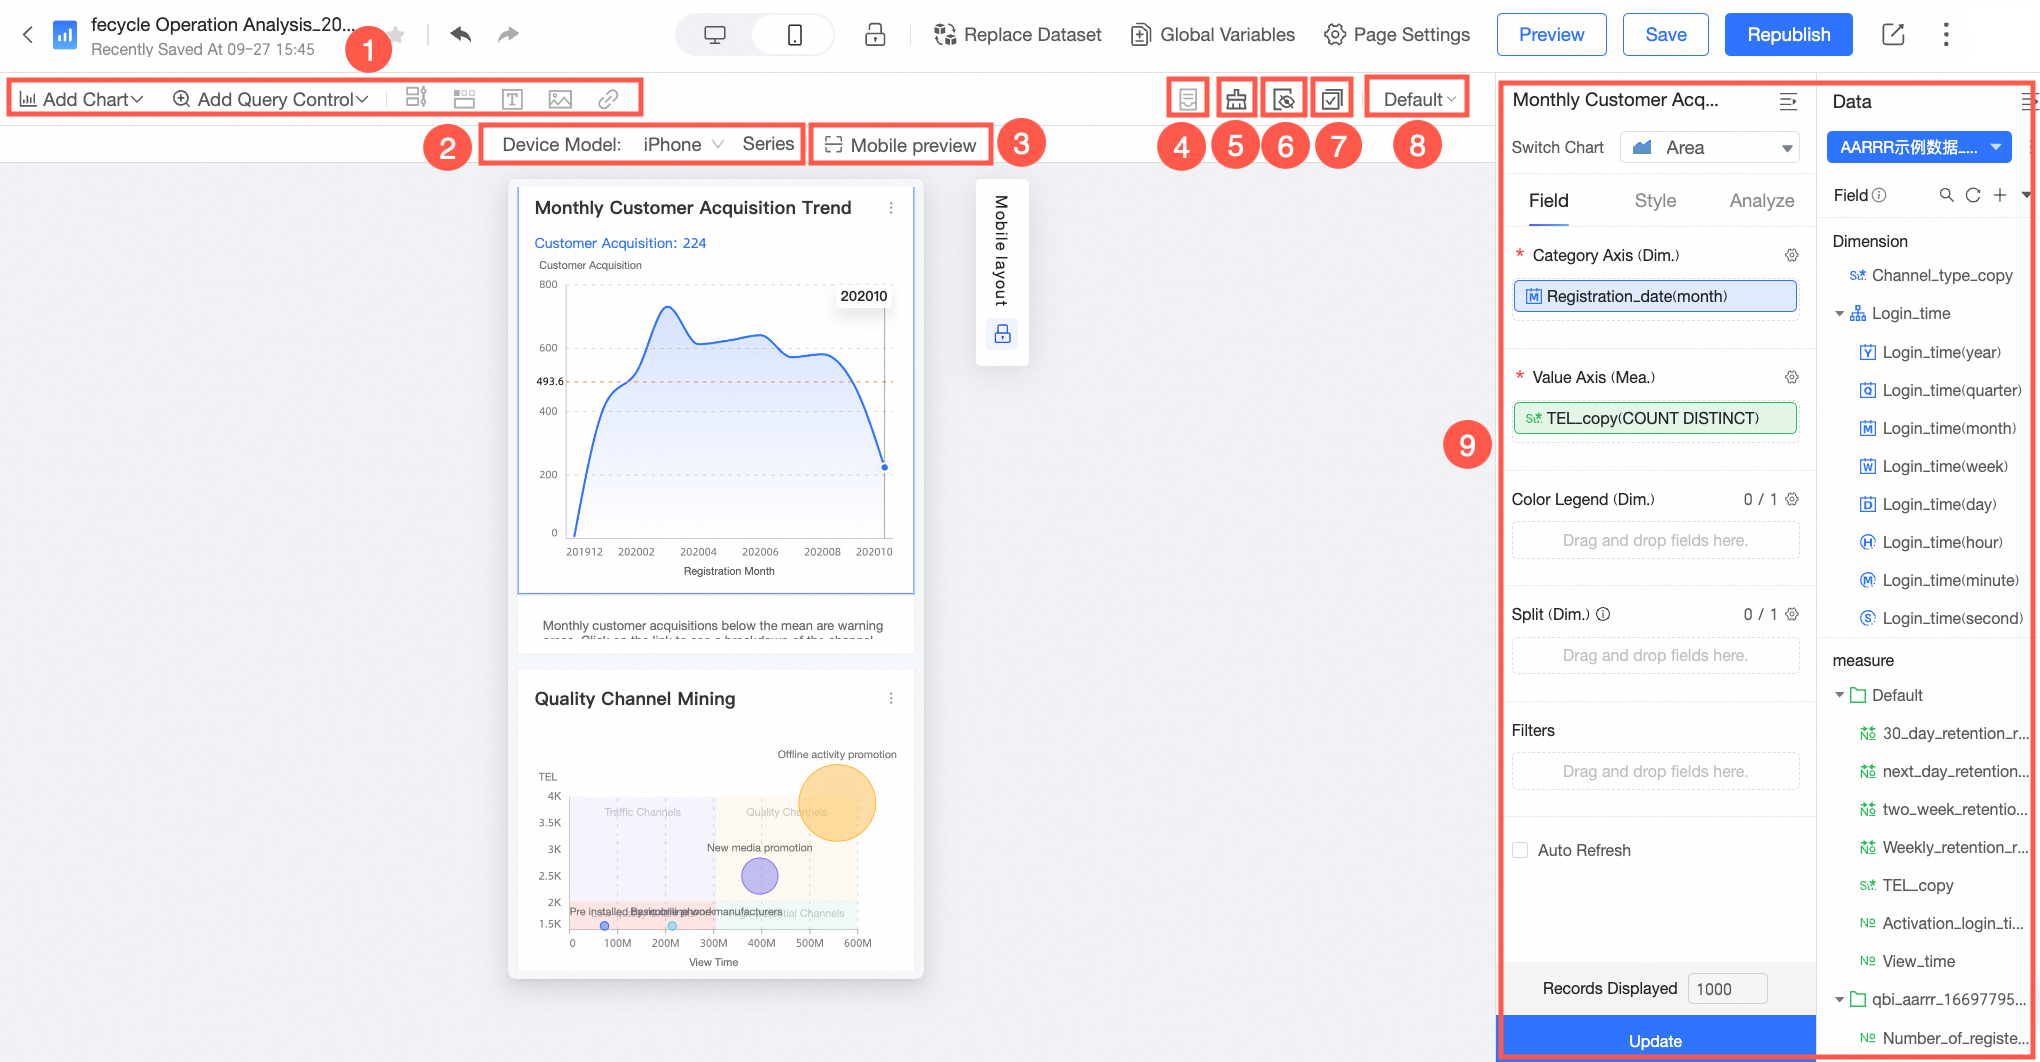
The mobile editing interface allows you to:
Note that some editing operations are restricted when the mobile layout lock is closed. Unlock it to access all editing features.
Feature | Description |
① Component addition | Add components on the mobile editing page. Supported components include the following:
Note Composite query controls are not supported for addition on the mobile terminal. |
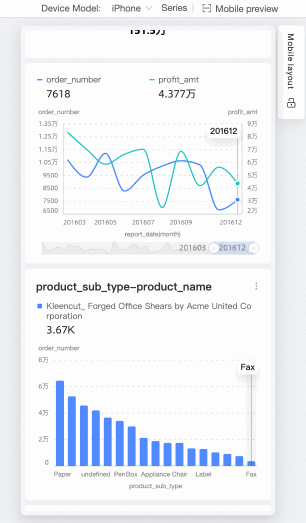
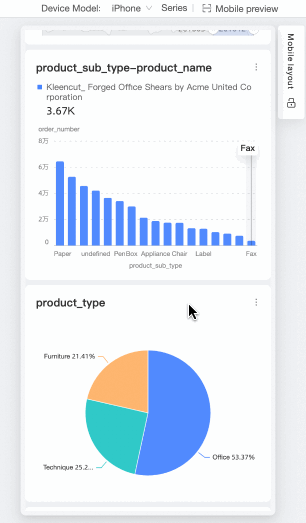
② Mobile model preview on PC | Preview the mobile report on various phone models. Supported models include the following: Once you select a mobile model, you can preview the effect. The supported mobile models currently include the following:
Note Should the Mobile Model you require be unavailable, you can scan the QR code with your phone to preview the effect. |
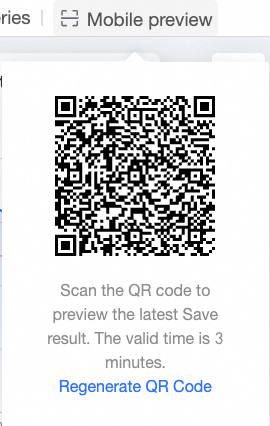
③ Mobile QR code | Scan the QR code on the mobile terminal with your phone to preview the effect on your device. Scan the QR code with your phone to preview the effect on your mobile device. This QR code remains active for 3 minutes; upon expiration, click Regenerate QR Code to create a new one. |
④ Reuse components from other dashboards | Within the same workspace, you can repurpose components from other dashboards for use in the current one, thereby saving time and effort.
|
⑤ Format painter | The format painter allows for swift synchronization of an existing chart's style across other charts, streamlining the editing process. For more information, see Format Painter.
|
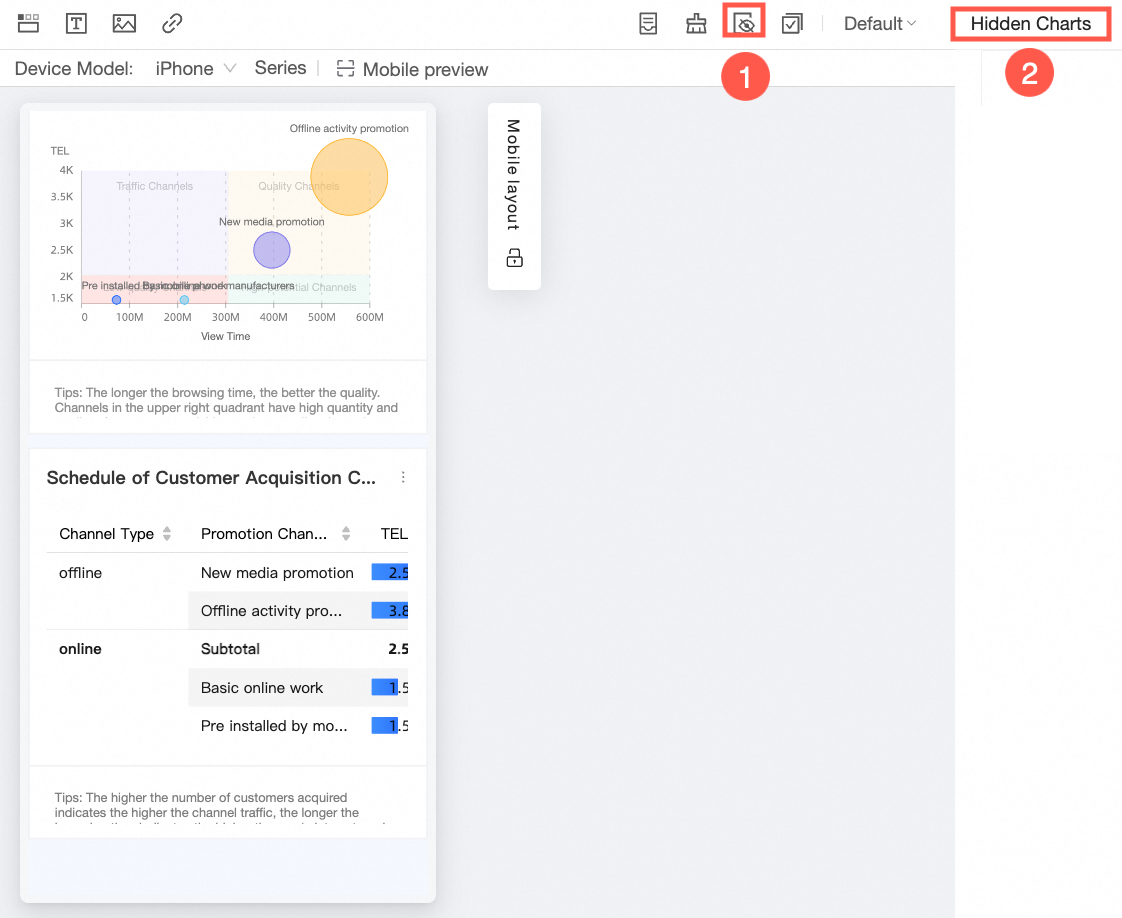
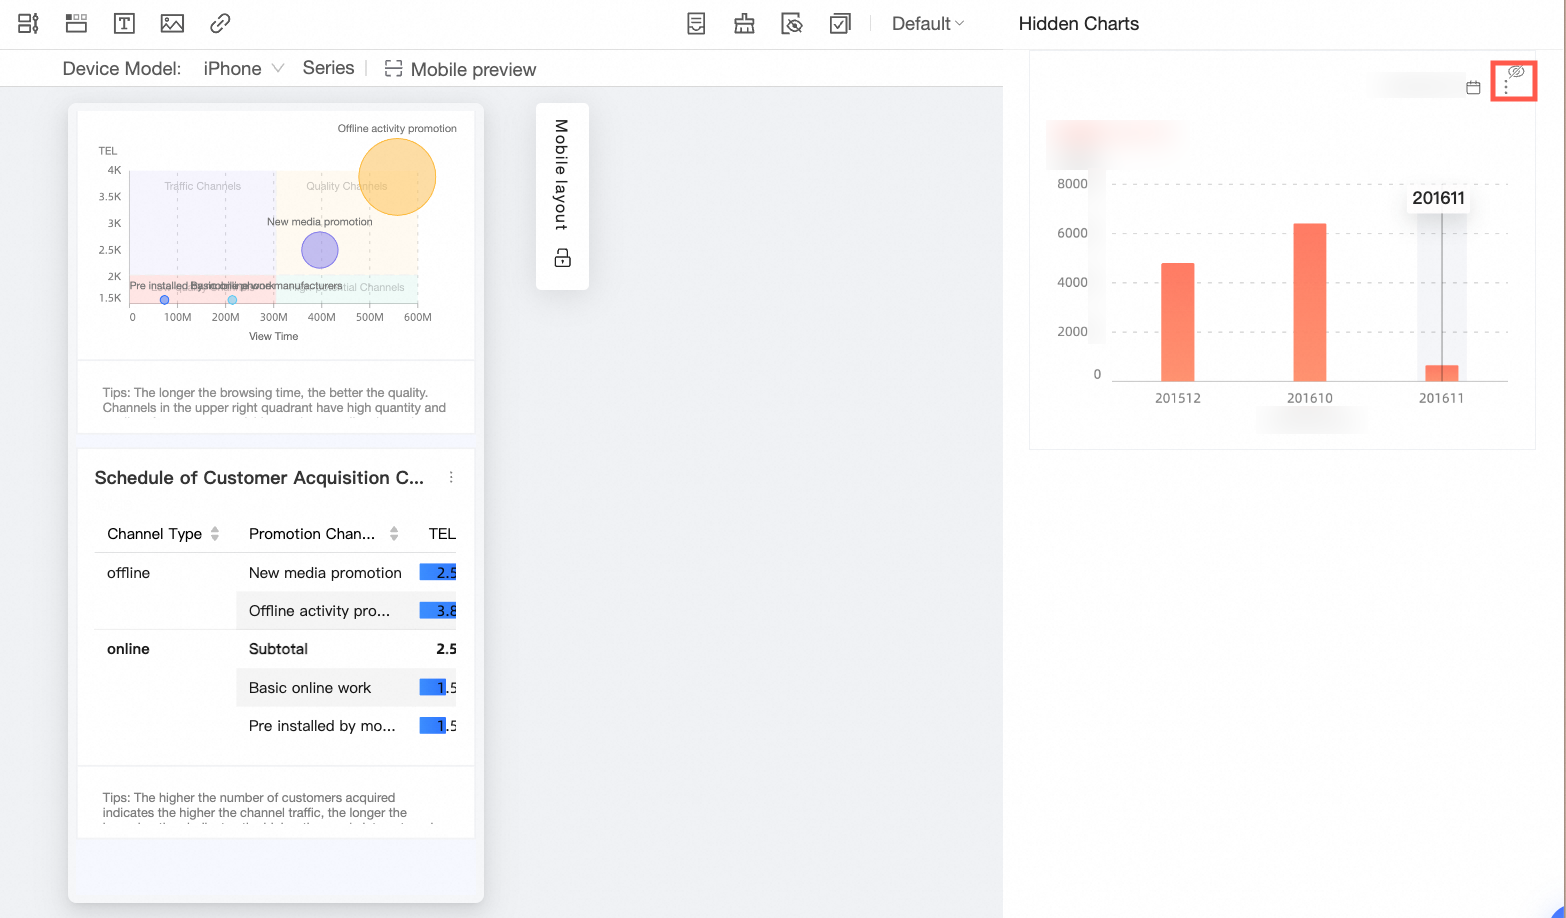
⑥ Hidden charts | Modify the chart display components for mobile devices. Any chart that is hidden on mobile will appear in the right sidebar on a desktop.
To restore the hidden chart, click the
Note Hidden charts will not be visible on the mobile terminal when viewing the report. |
⑦ Batch operation | The system allows for batch customization of chart styles within the same dashboard. When selecting multiple charts, it will display common configuration items by default, enabling you to tailor the settings to your requirements.
|
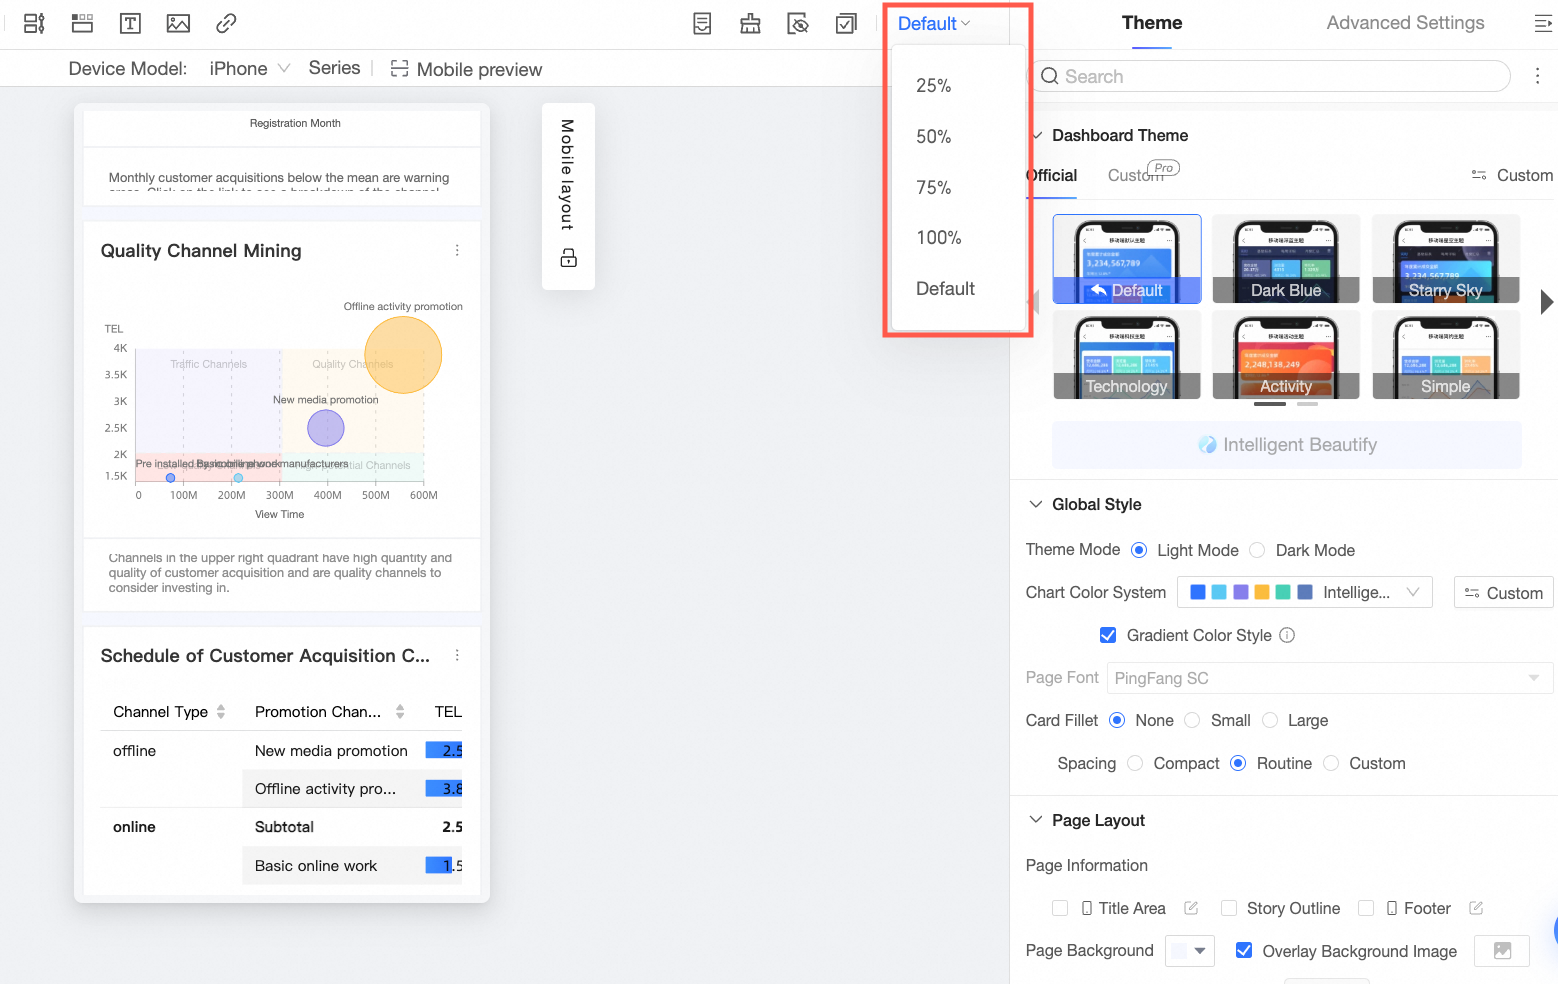
⑧ Layout scaling | Adjust the layout ratio through specific entry points, with options for 25%, 50%, 75%, and 100% scaling. Reduce the ratio to fit more content on the screen and adjust chart positions as needed. |
⑨ Component settings | Within this area, you can adjust the fields, styles, and advanced configurations for dashboard components. Changes to configuration items in mobile mode will directly influence the report's mobile presentation, eliminating the need to switch to PC mode for style modifications.
Note After transitioning to the mobile edit mode, the component settings may vary based on the mobile device. Please consult the actual interface for reference. |

 For detailed instructions, see Operations on the mobile canvas.
Operations on the Mobile Canvas
Adjustments on the mobile canvas affect only the mobile terminal display and not the PC chart display.
Ensure the mobile layout lock is unlocked for seamless chart layout adjustments on the mobile terminal.
In the unlocked state: Freely adjust the size and position of mobile chart components.
In the locked state: Adjust the size and position of components without altering their sequence.
When locked, you cannot add, move, copy, paste, embed, or delete blocks on the current canvas. The mobile layout will adhere to the PC configuration.
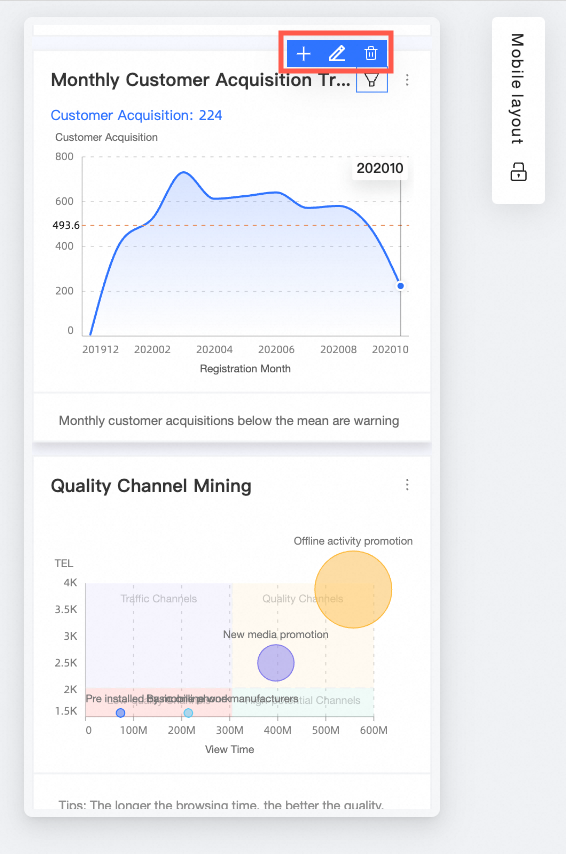
Horizontal component layout adjustment
Arrange multiple chart components in a single row for flexible layout options on the mobile terminal.
Vertical component layout adjustment
Fine-tune the size and position of components for versatile operations on the mobile terminal.
Select a component and drag its bottom edge to adjust its height.
Select and drag a component to reorder them.
Manage mobile components
Add query controls to components directly on the canvas.
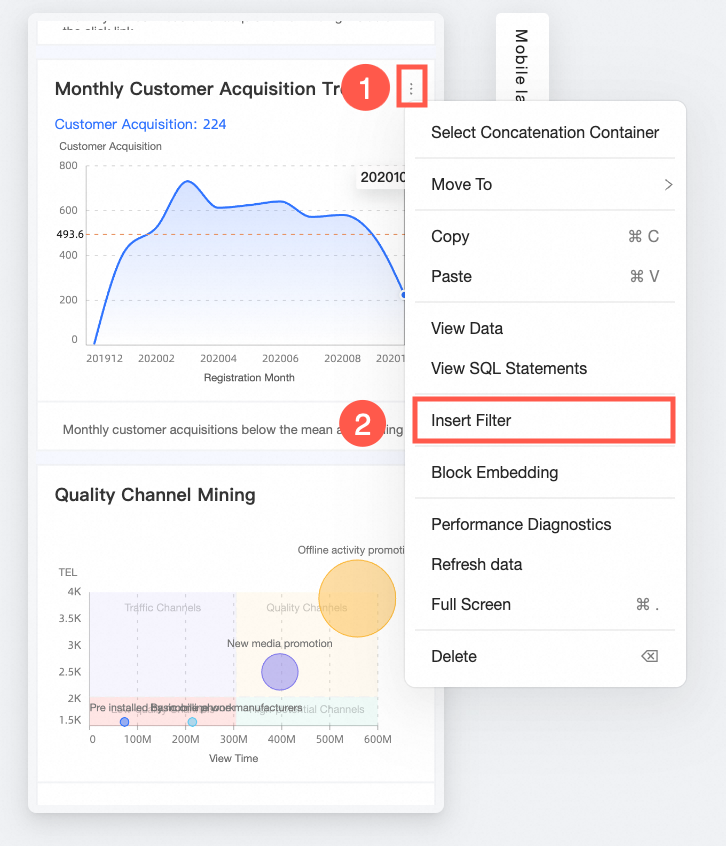
Once you've selected the added query control chart, you can add, edit, or query data as needed.
Once you've selected a chart with query controls, you can add, edit, or query data directly.
For additional chart operations, refer to Dashboard operations.