Report viewers can dynamically filter and query data by entering or selecting text field values in a text control. A text query control allows dashboard viewers to filter chart data based on specific text conditions and focus on key content.
The main advantages of a text query control are:
High flexibility: It supports three display types, such as drop-down list, text input box, and tree drop-down. It also provides extensive configuration options for different business scenarios and user preferences.
High precision: It supports multiple match conditions for entered content, such as contains, does not contain, starts with, and ends with. This allows for precise data retrieval.
Quick BI supports three types of text controls: Drop-down list, Text input box, and Tree drop-down. This topic describes the scenarios and configuration steps for each display type.
Prerequisites
You have created a dashboard, and the charts on it contain text fields.
You have added an empty query control to the dashboard. For more information, see Create a query control.
Configure query conditions
Navigate to the dashboard edit page. For more information, see Create a dashboard.
In the dashboard list, find and click the target dashboard.
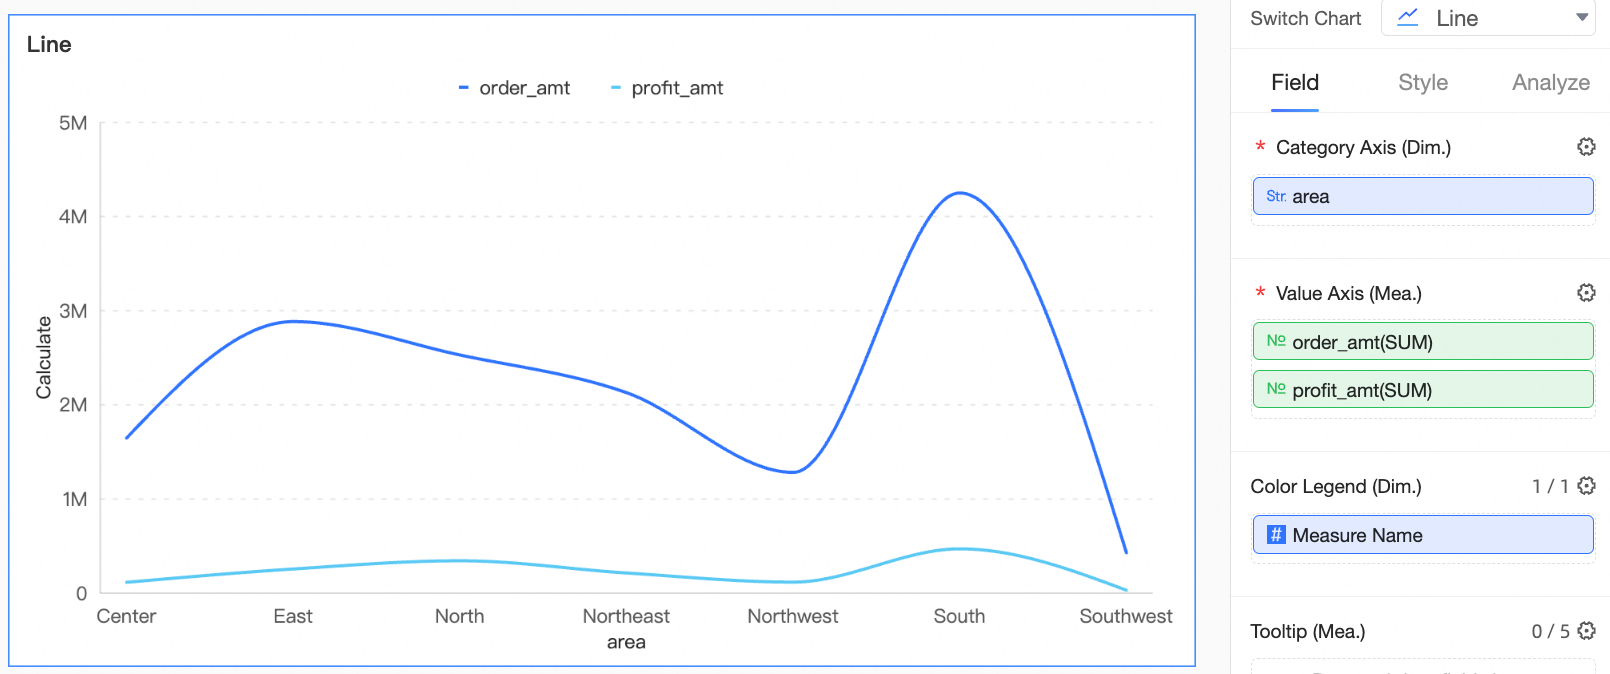
The charts on the dashboard must contain text fields to configure a text query control. This topic uses a line chart as an example. For more information, see Line chart.
Add a query control as shown in the following figure.
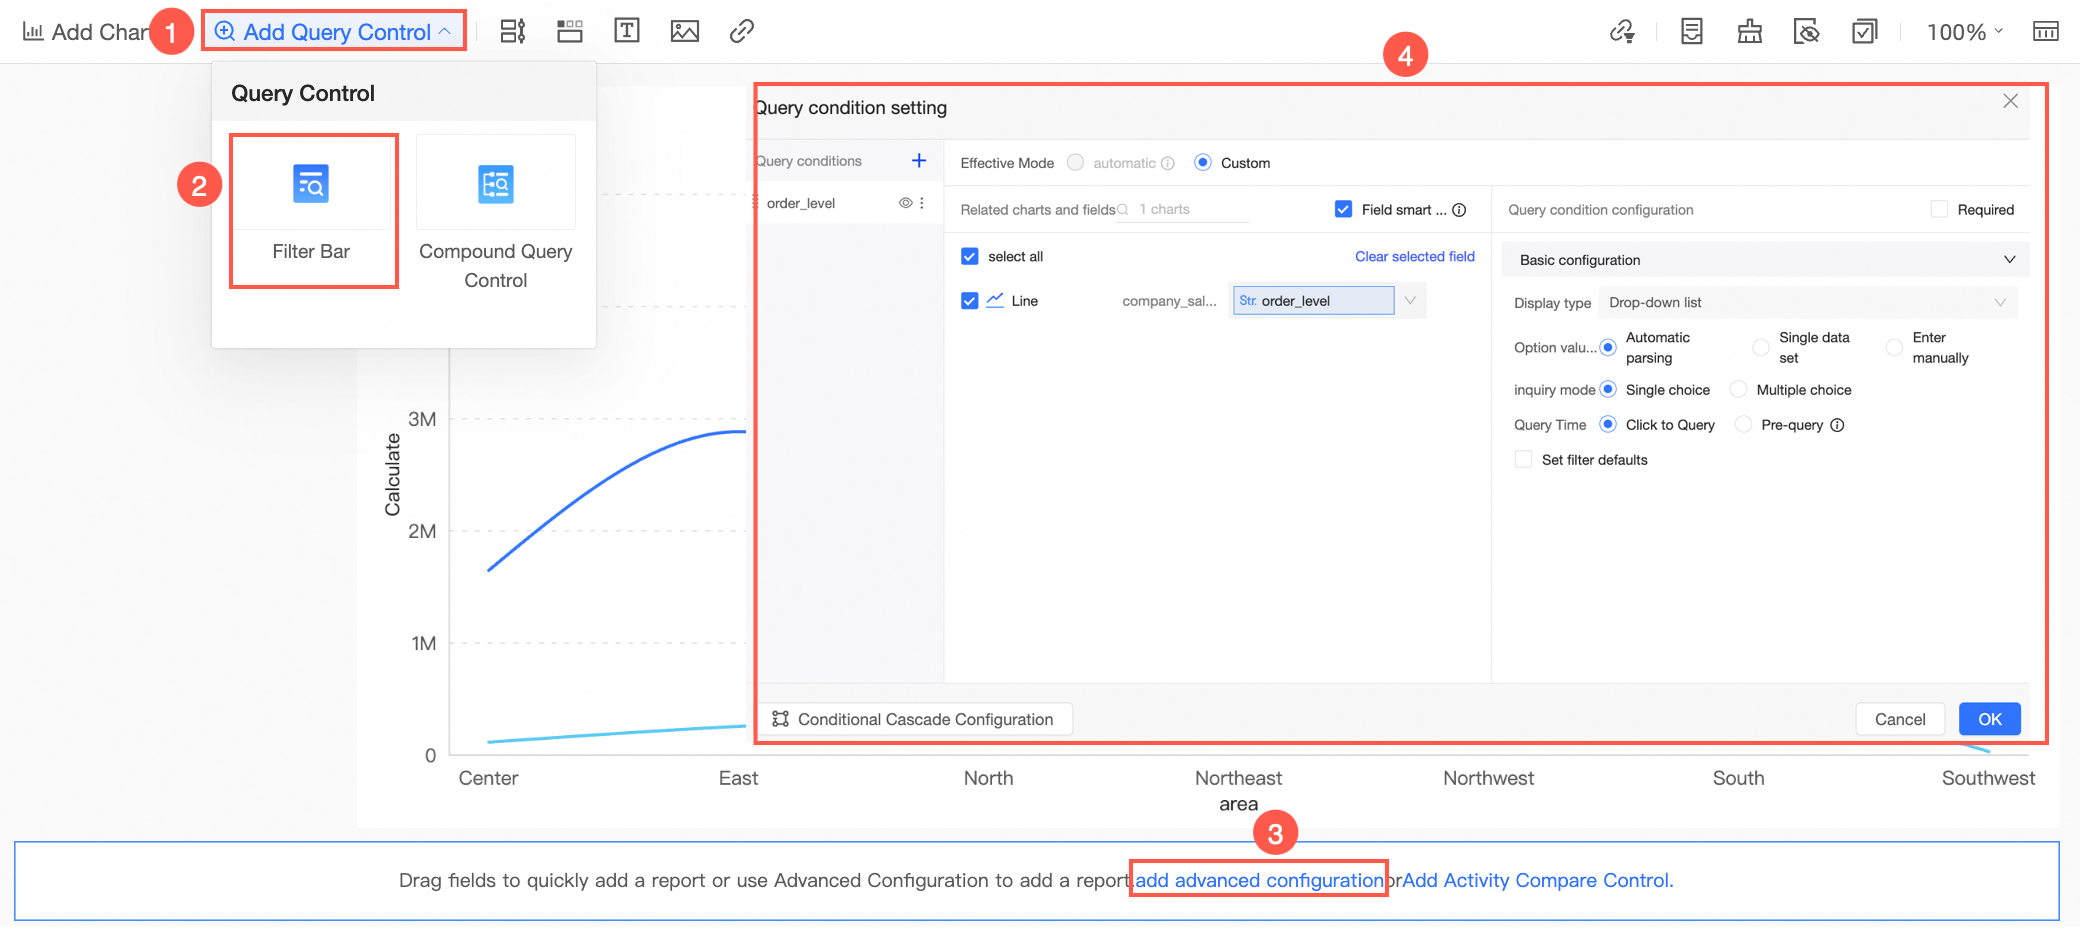
Configure the query control.
Set the name of the query condition to Level Query.
Select the Line Chart and the foreign key field Order level.
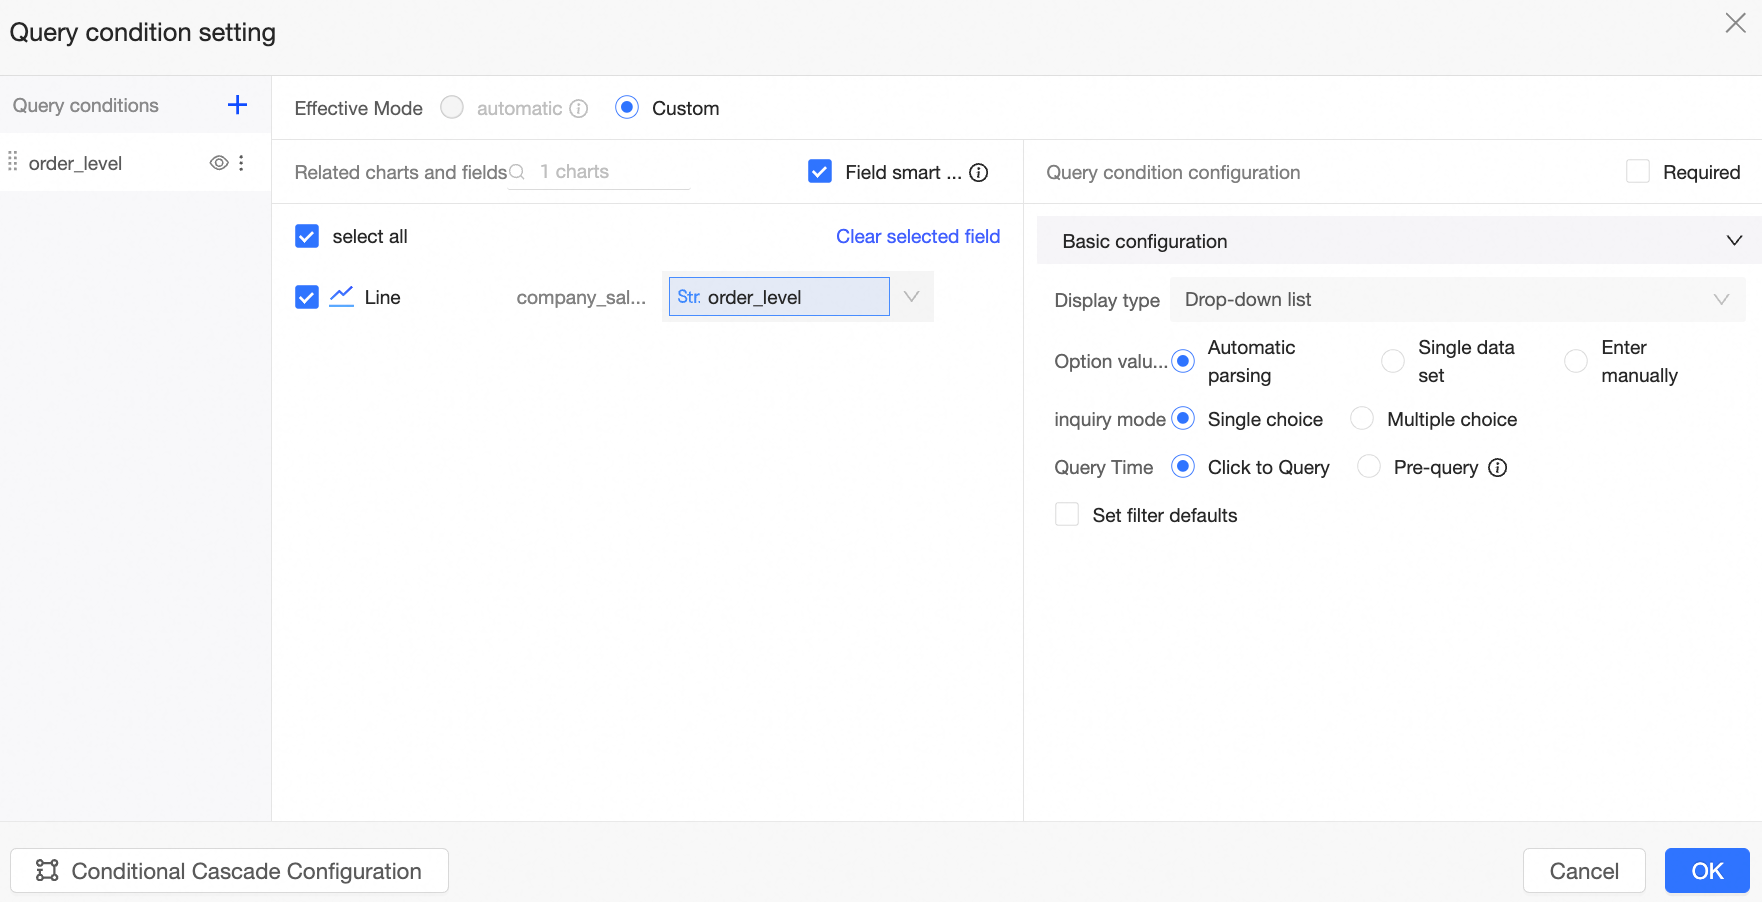
Set the display type and complete the query condition configuration.
If you set Display Type to Drop-down List, see the example in Drop-down list.
If you set Display Type to Text Input Box, refer to Text input box for an example.
If you set Display Type to Tree Drop-down, see the example in Tree drop-down.
Click OK.
Drop-down list
The drop-down list display type allows report creators to define a set of predefined options and present them in a list for viewers to select. When you set the display type to Drop-down List, the source of the option values can be Automatic Parsing, Single Dataset, or Manual Input.

Automatic parsing
When you select automatic parsing, Quick BI automatically identifies the values of all associated foreign key fields and displays them as a union of options for the query control.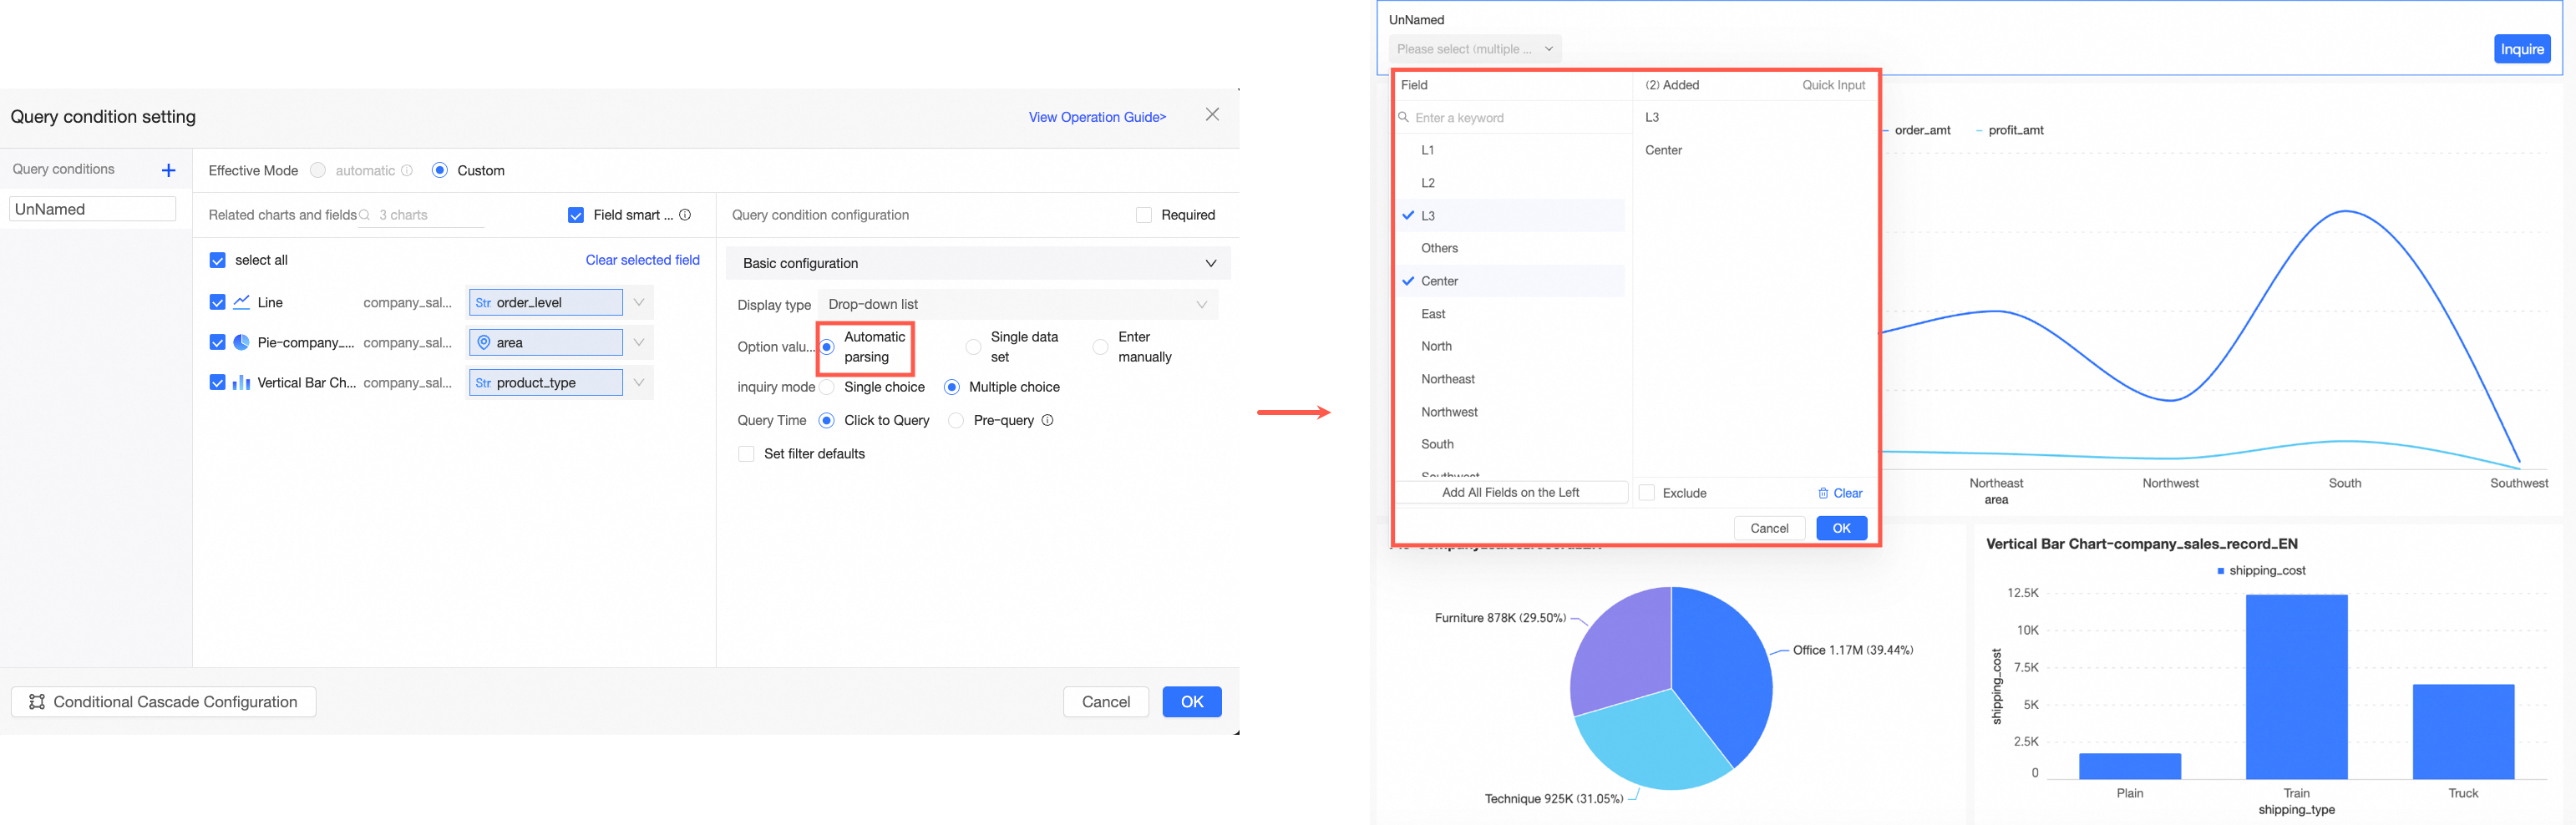
If charts in the Associated Chart And Field section use the same dataset, values are automatically parsed from it.
If the charts selected in the Associated Chart And Field section use multiple datasets, the system automatically parses values from all of them and displays their union in the drop-down list.
Configuration item | Description | Example |
Query Mode | Supports Single Selection and Multiple Selection. |
|
Query Time | Supports Click To Query and Pre-query.
| |
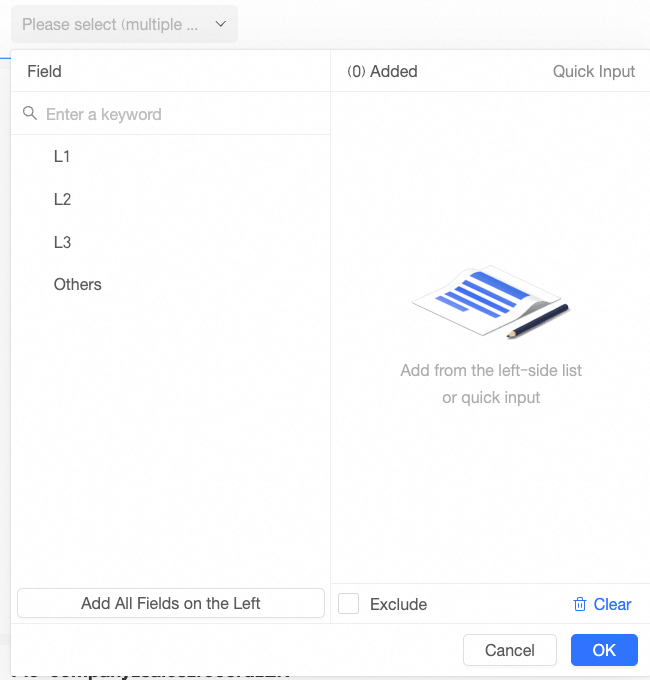
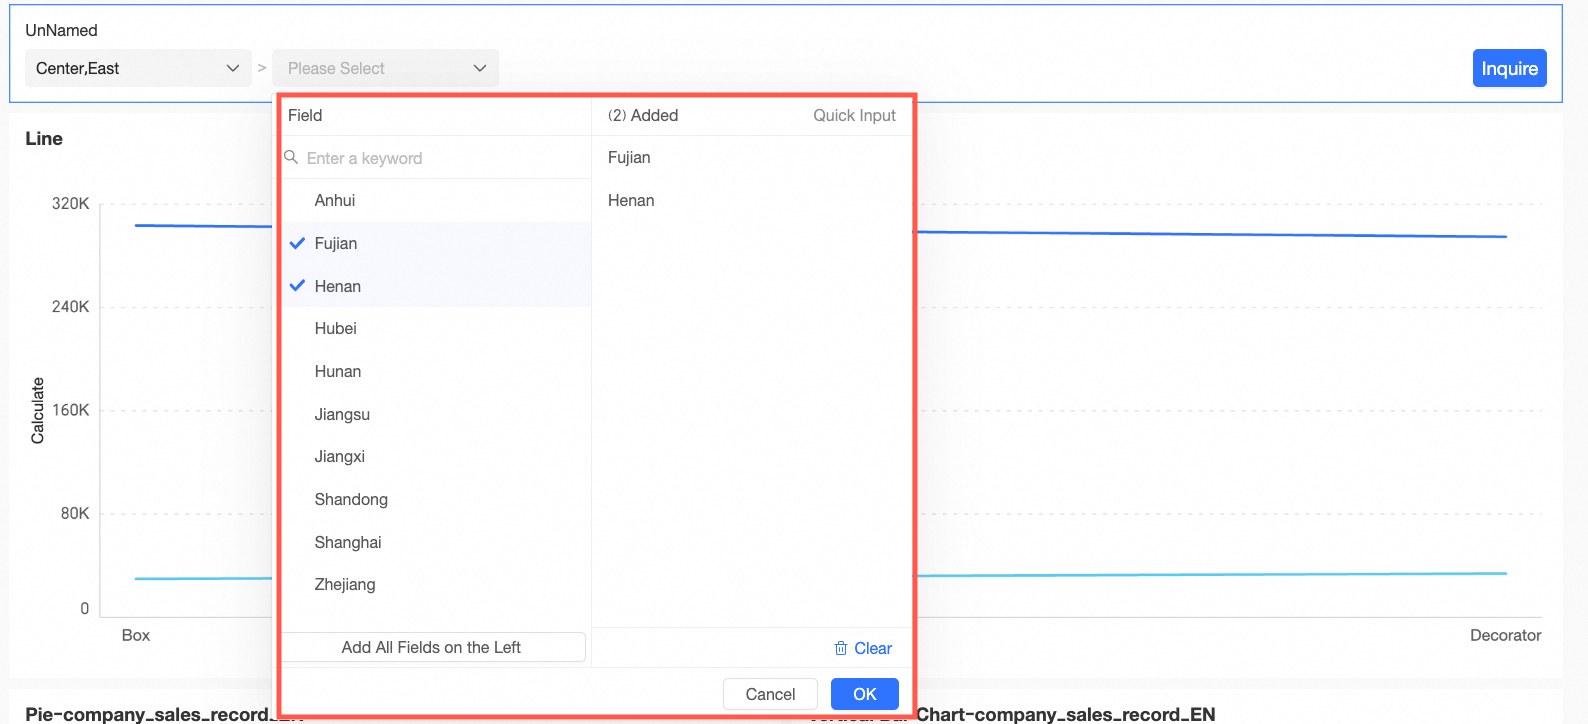
Set Default Filter Value | Select this option. The query condition box displays Please select. Click the query condition box to configure default values in the Field dialog box. In this dialog box, you can perform the following operations:
Note If the number of filter items is greater than 1,000, the first 1,000 option values are displayed by default. You can directly search for values that are not displayed. |
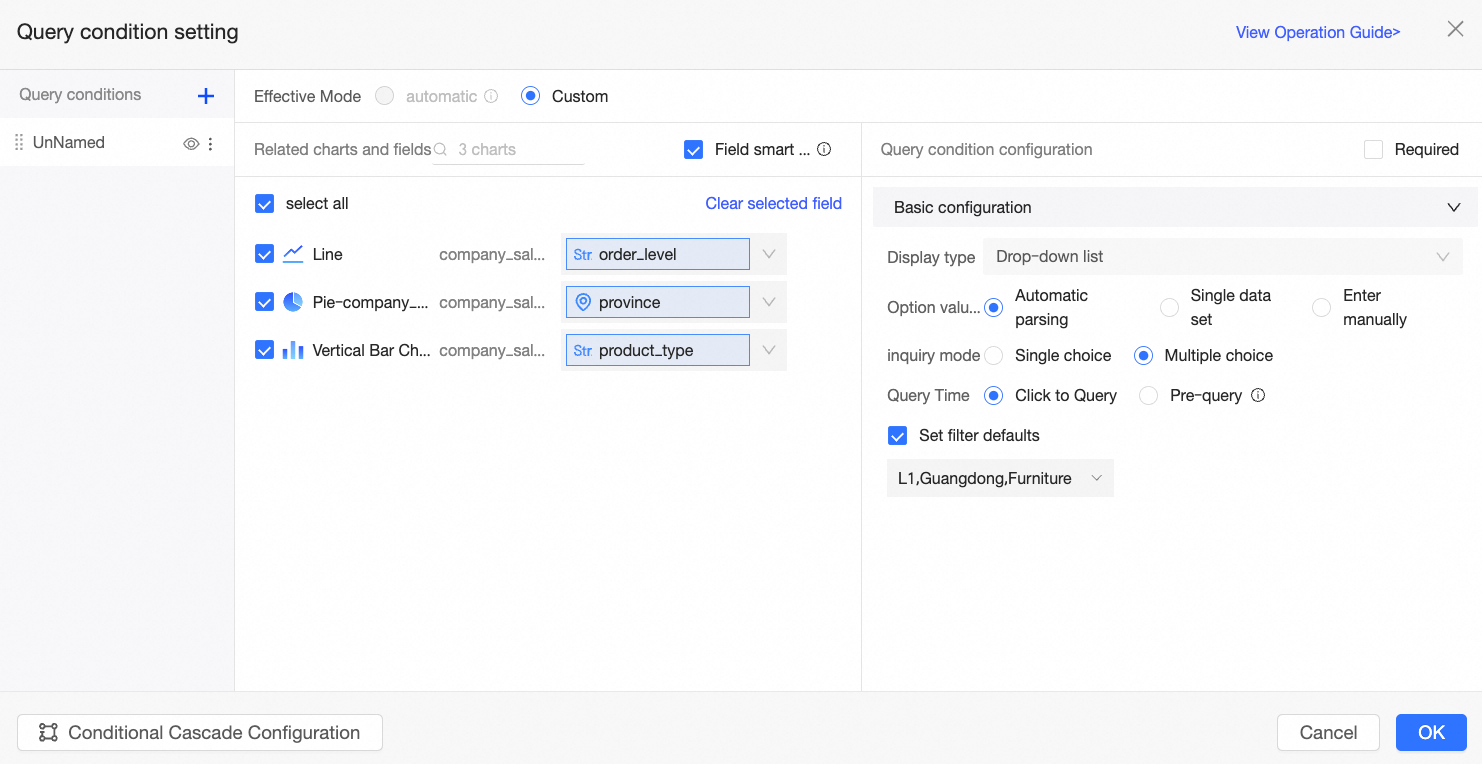
In this example:
In the Associated Chart and Field section, different fields from multiple datasets are selected. The query control's drop-down list displays a union of all foreign key field values.
Query mode is set to Multiple selection, which means you can select multiple options in the query control.
Query time is set to Click to query, which means the report viewer must click the query button to trigger a conditional query.
Set default filter value is set to Advanced, Guangdong Province, and Furniture product. When a report viewer opens the report, the query results for an advanced order level, Guangdong province, and furniture product type are displayed by default.
The following figure shows the result.
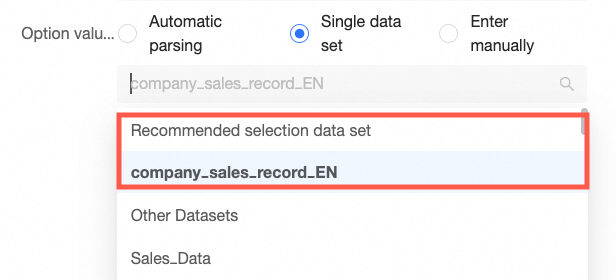
Single dataset
When the option value source is a single dataset, the options in the query control depend on the values of a specific field in that dataset.
Configuration item | Description | Example |
Select Dataset | You can select any dataset in the workspace where the current dashboard is located. We recommend that you select the dataset that is the data source for the chart. |
|
Query Value Field | The field in the selected dataset that must match the foreign key field. This field is used for the actual query. The report viewer can select one or more options from the values of this field to query data. | |
Display Name Field | The field whose values are displayed as options in the query control. This field is typically used to improve the user experience of the query control and help report viewers better understand the meaning of the option values.
| |
Sort Field | Supports sorting by the selected field. This parameter is optional. If you do not specify this parameter, the data is sorted by the default order in the dataset. To sort by a specific field, you can select the sort field in the drop-down list. For example, you can sort by measure or by date. The supported sorting methods are Ascending, Descending, and Custom sorting. When you select custom sorting, you can drag the field values to change their order in the Custom sorting dialog box. After the settings take effect, they can affect the sorting of the drop-down list in the query control but do not affect the sorting of dimension values in the chart. The sorting of dimension values in the chart is still managed by the dataset or the data panel in each chart. | |
Query Mode | Supports Single Selection and Multiple Selection. | |
Query Time | Supports Click To Query and Pre-query.
| |
Set Default Filter Value | Select this option. The preset values are displayed in the query condition. Note If the number of filter items is greater than 1,000, the first 1,000 option values are displayed by default. You can directly search for values that are not displayed.
|
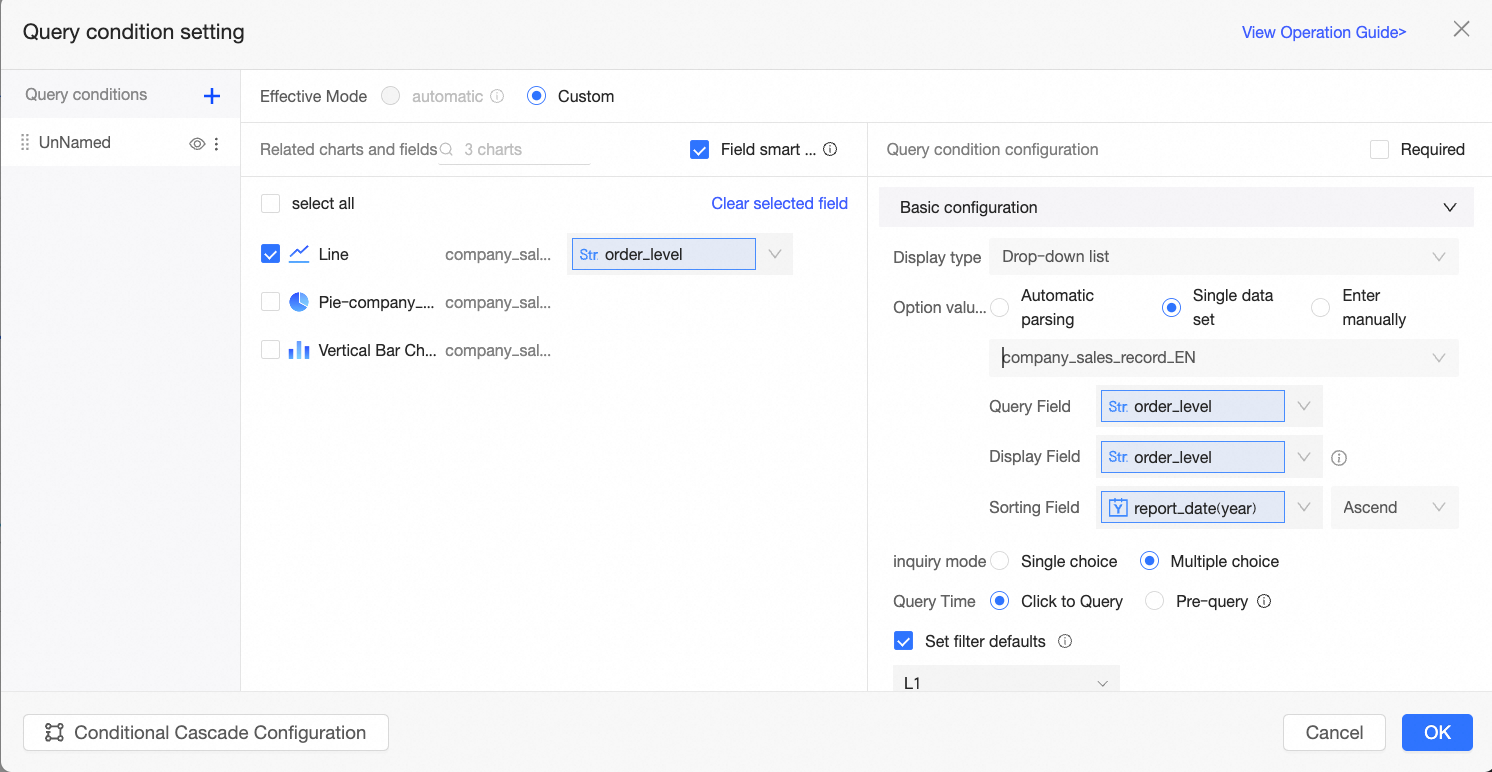
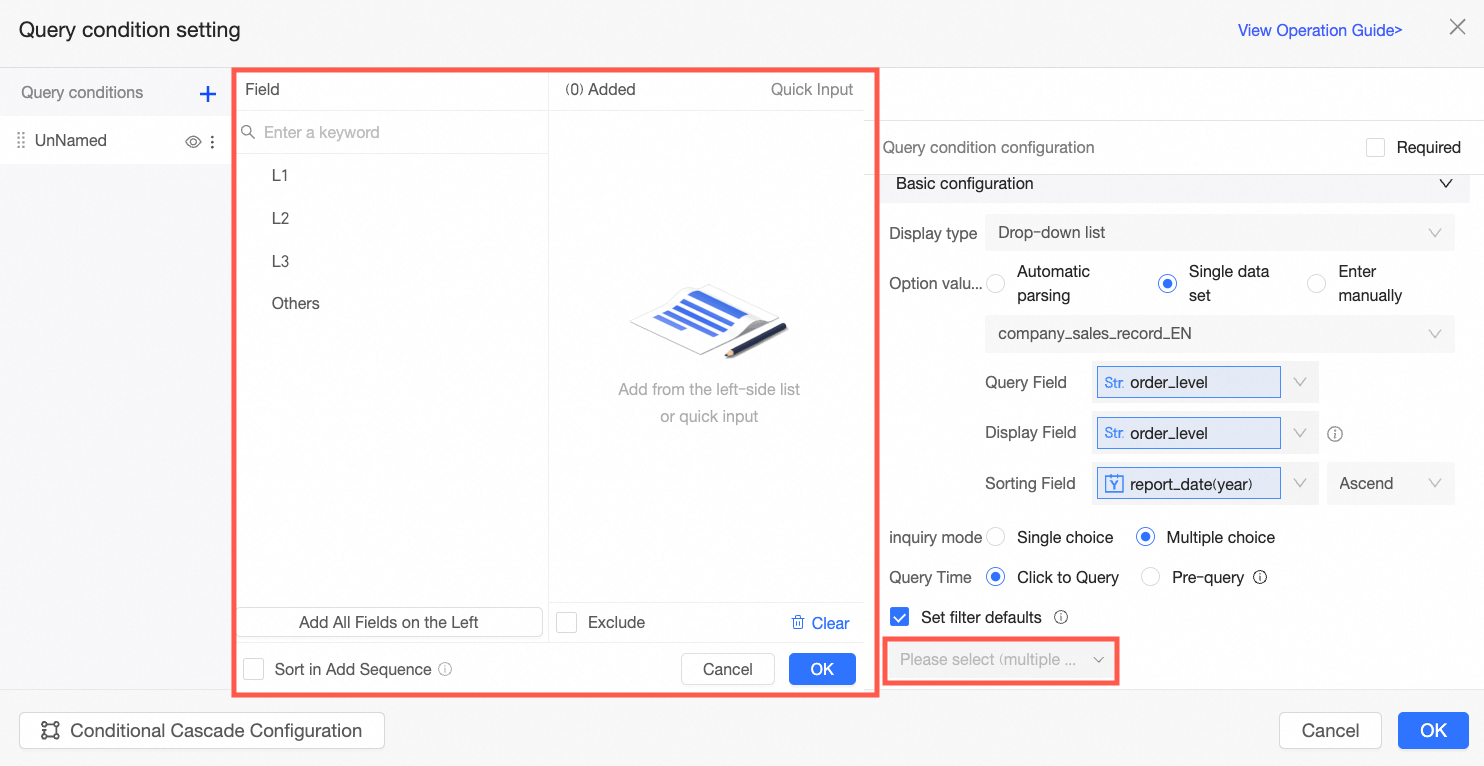
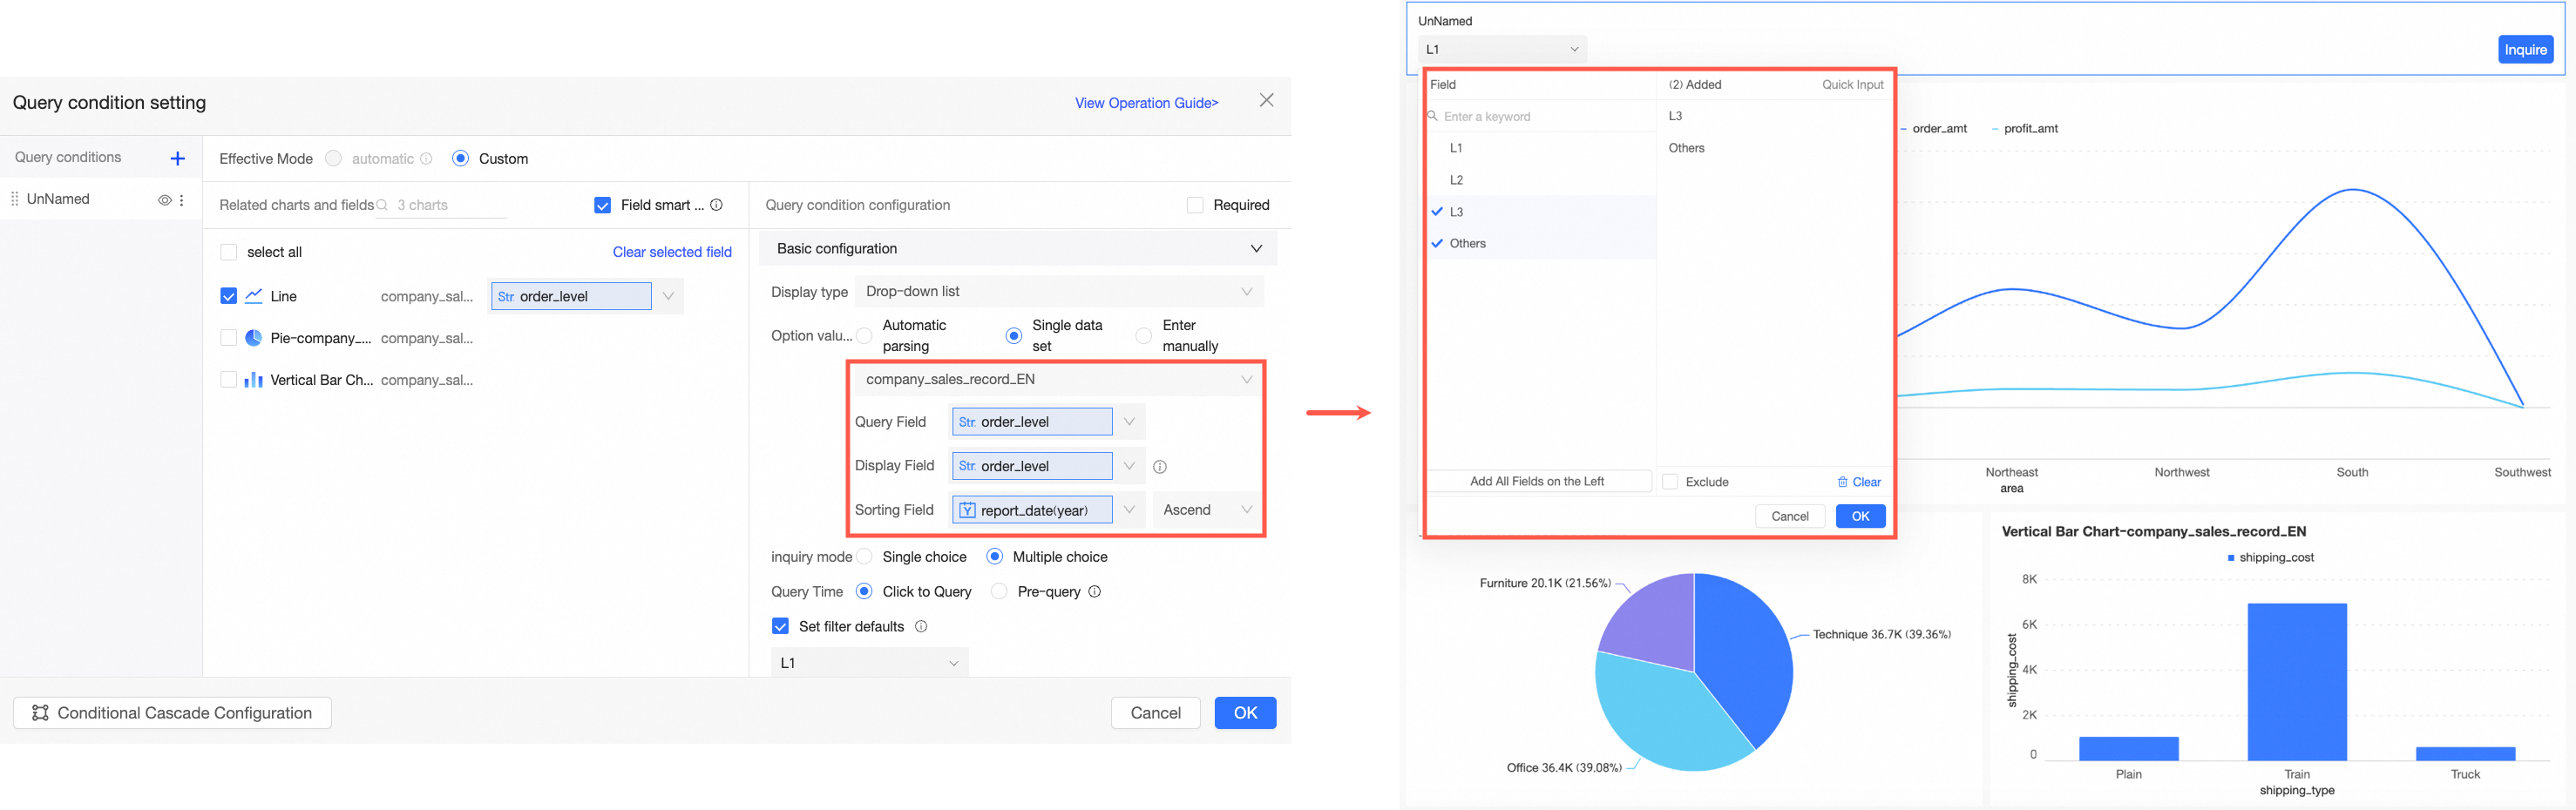
In this example:
The Dataset is set to company_sales_record, which is the source dataset for the current chart.
The Query value field is set to Order level, which is the same as the foreign key field and will be used for the actual query.
The Display name field is also set to Order level.
The Sort field is set to Order date, which sorts the option values in the control.
Query mode is set to Multiple selection, which means the report viewer can select multiple option values in the query control.
Query time is set to Click to query, which means the report viewer must click the query button to trigger a conditional query.
Set default filter value is set to Advanced. When a report viewer opens the report, the query results for the advanced order level are displayed by default.
The following figure shows the result.
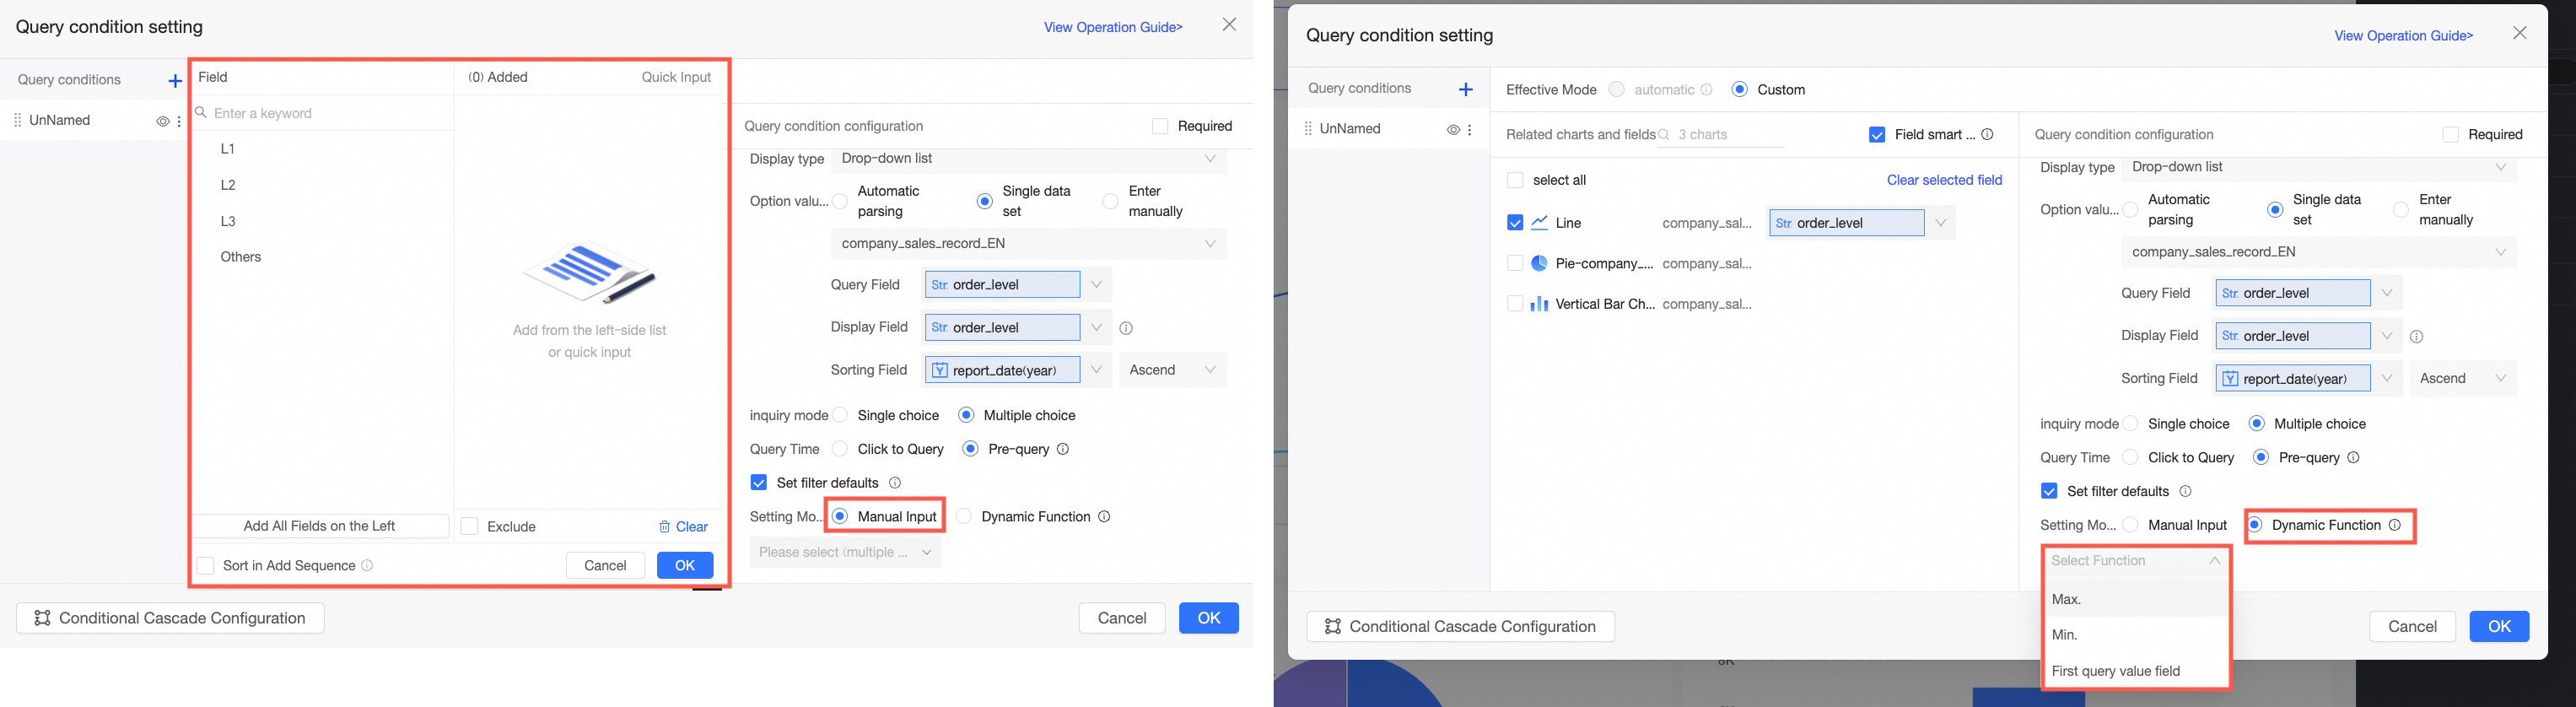
Manual input
When the option value source is manual input, the report creator can customize the options in the query control based on the field values used in the chart.
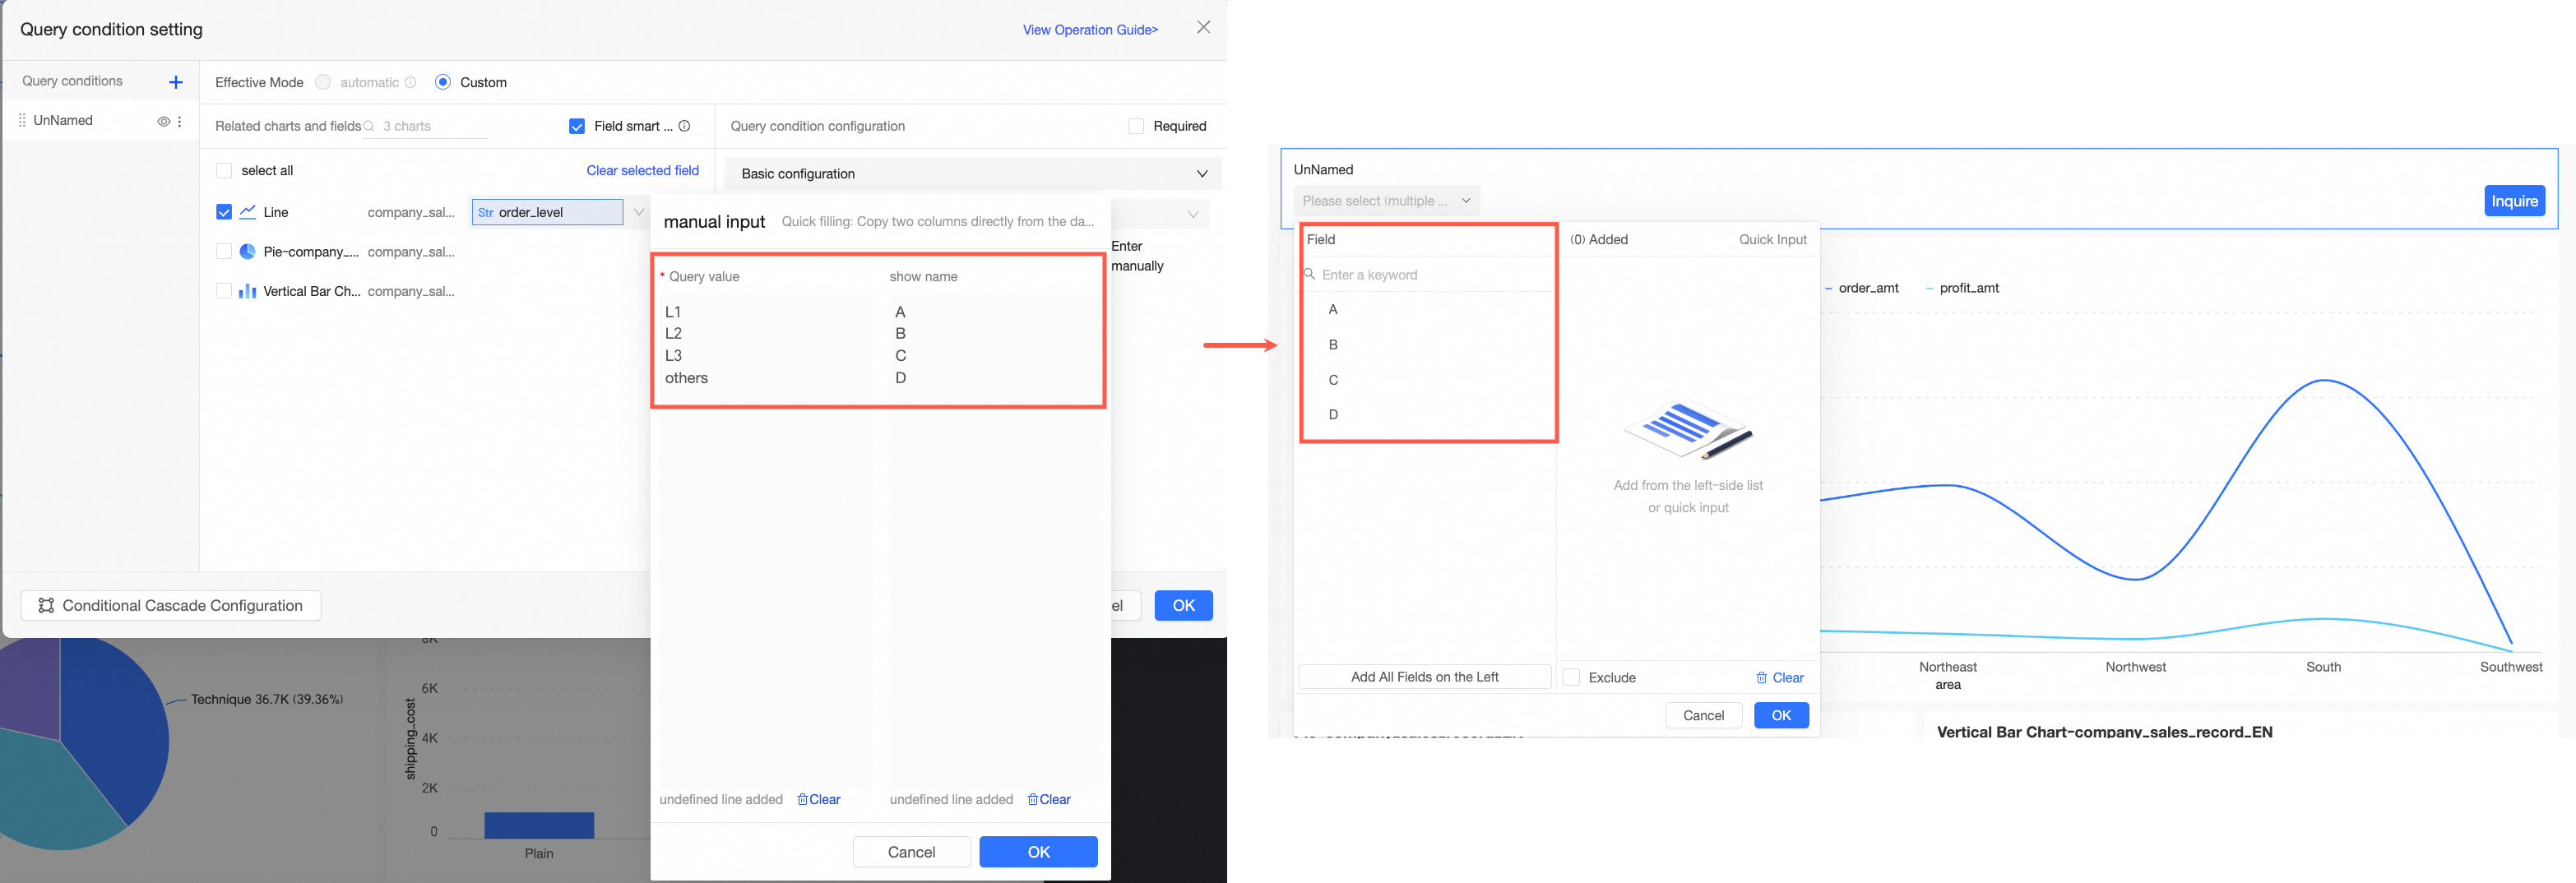
Configuration item | Description | Example |
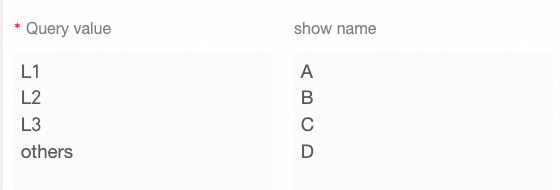
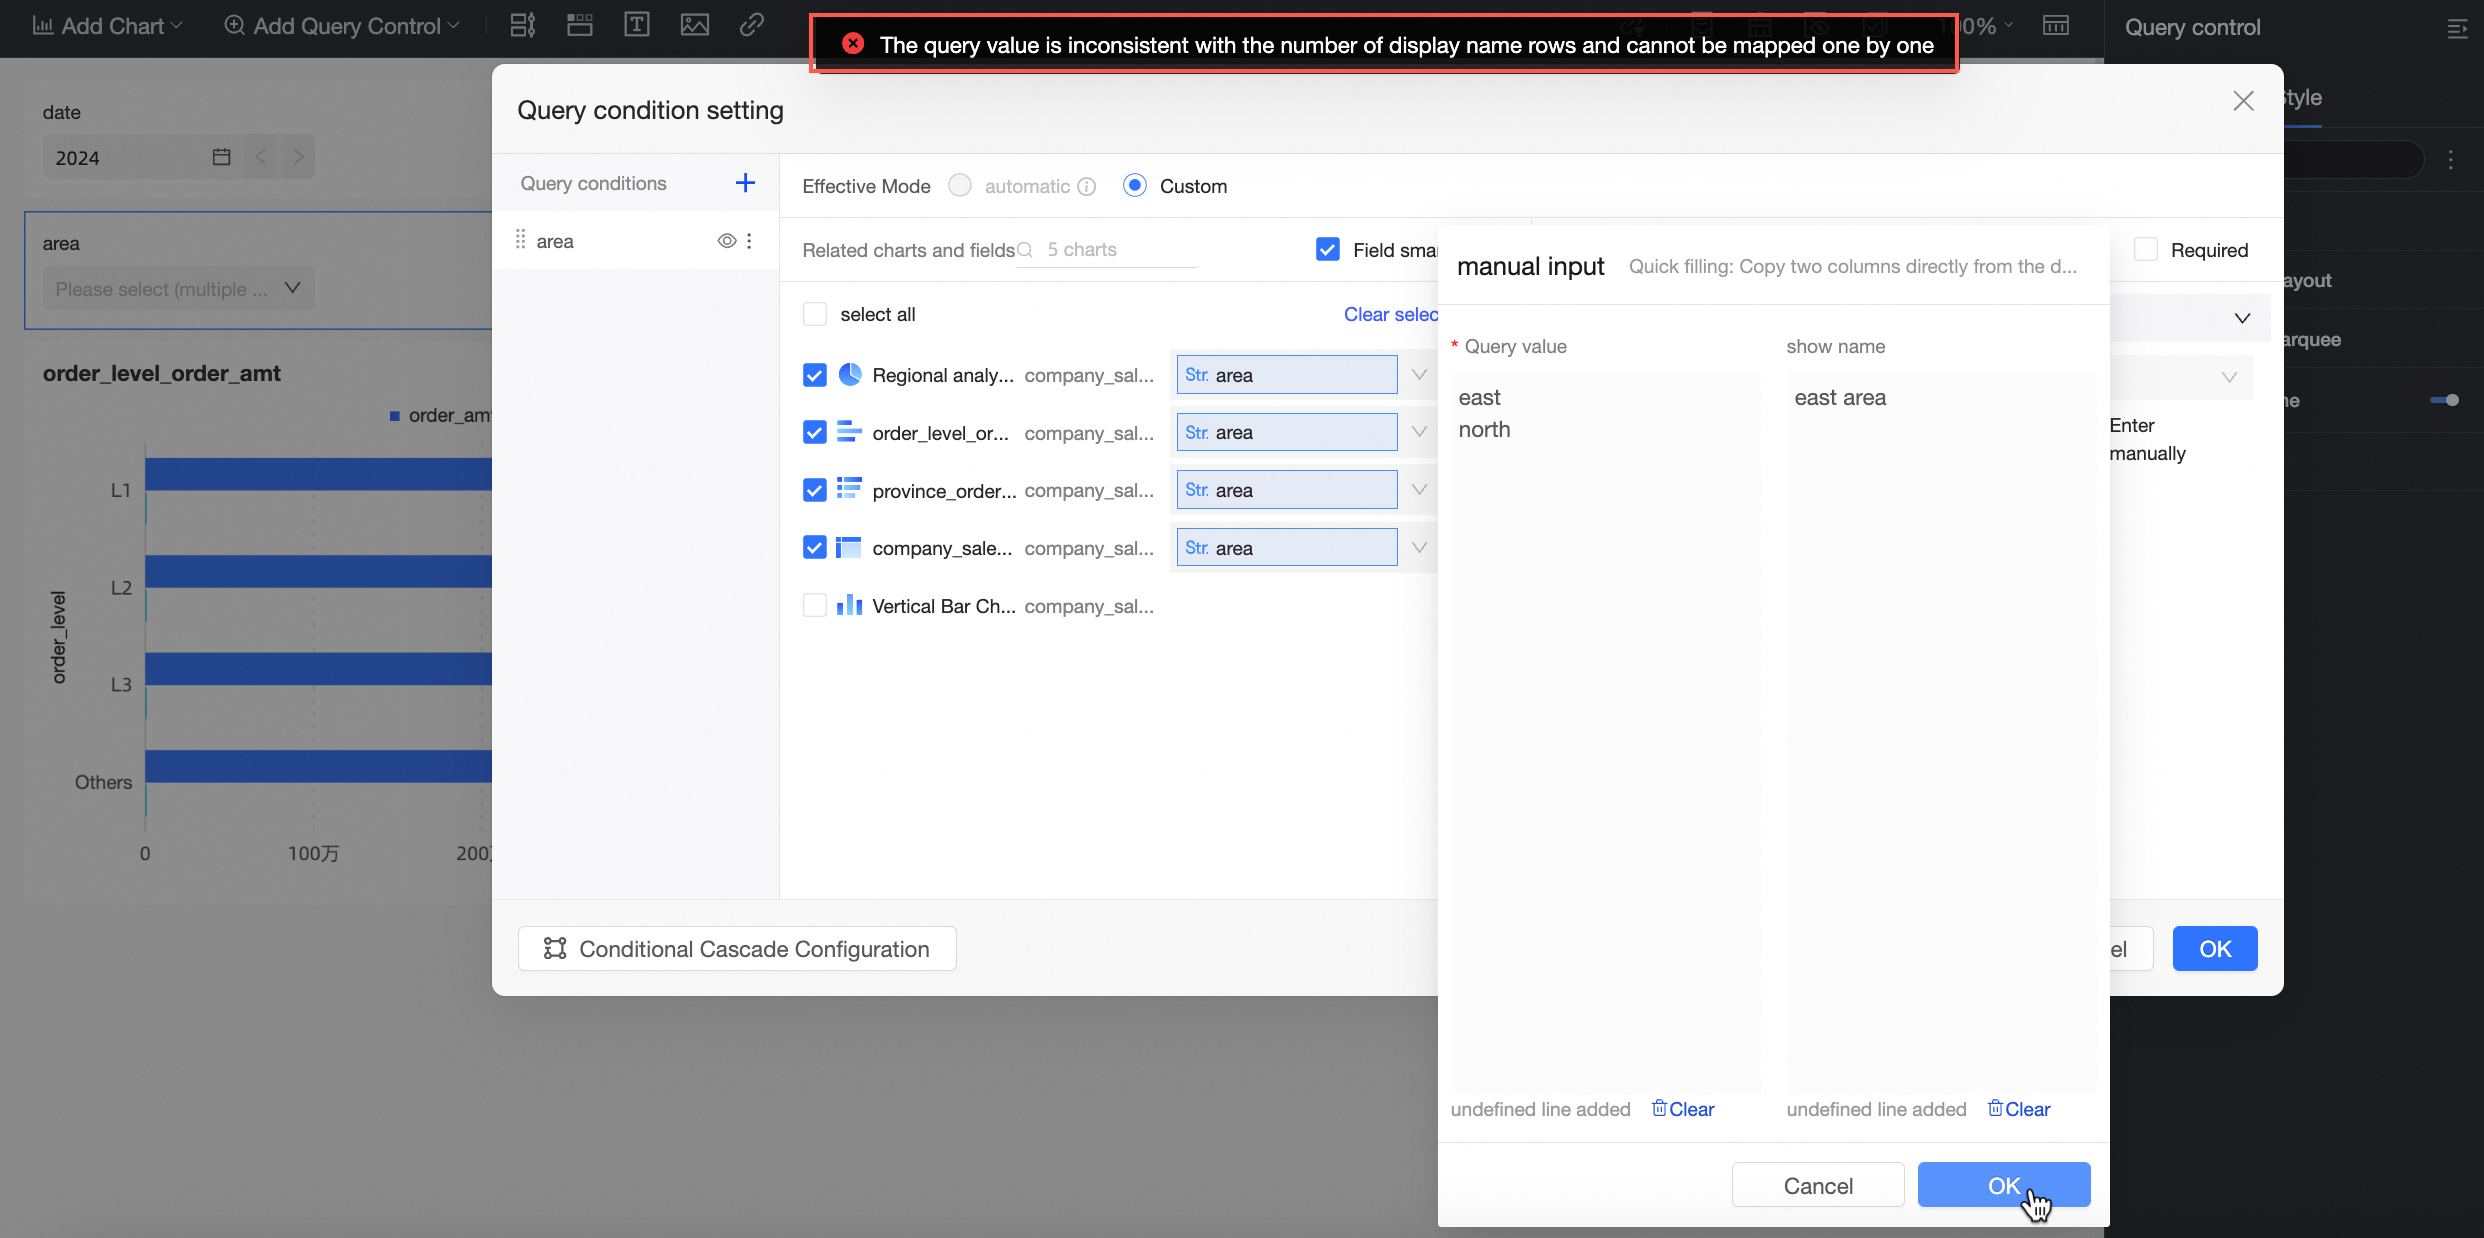
Manual Entry | Click Manual entry. In the Manual entry dialog box, enter the Query Value and Display Name.
Note
|
|
Query Mode | Supports Single Selection and Multiple Selection. | |
Set Default Filter Value | Select this option. The preset values are displayed in the query condition. |
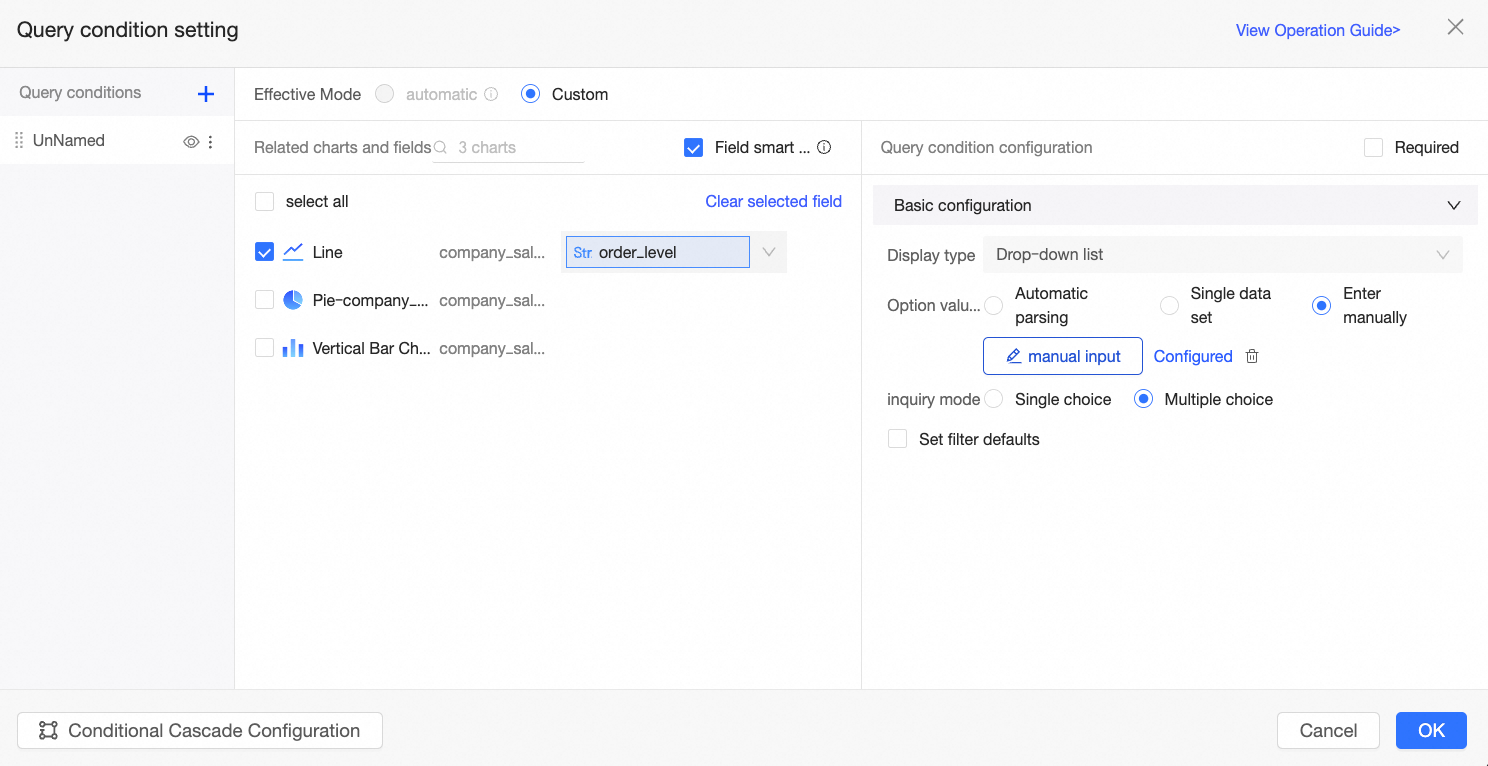
In this example:
For Manual entry, the Order level field values are mapped to display values: Advanced to A level, Intermediate to B level, Low to C level, and Others to D level.
Query mode is set to Multiple selection, which allows the report viewer to select multiple options.
Set default filter value is set to Advanced. When a report viewer opens the report, the query results for the advanced order level are displayed by default.
The following figure shows the result.
Search
When you perform a filtered query, you can search for specific conditions to quickly locate the data you need.
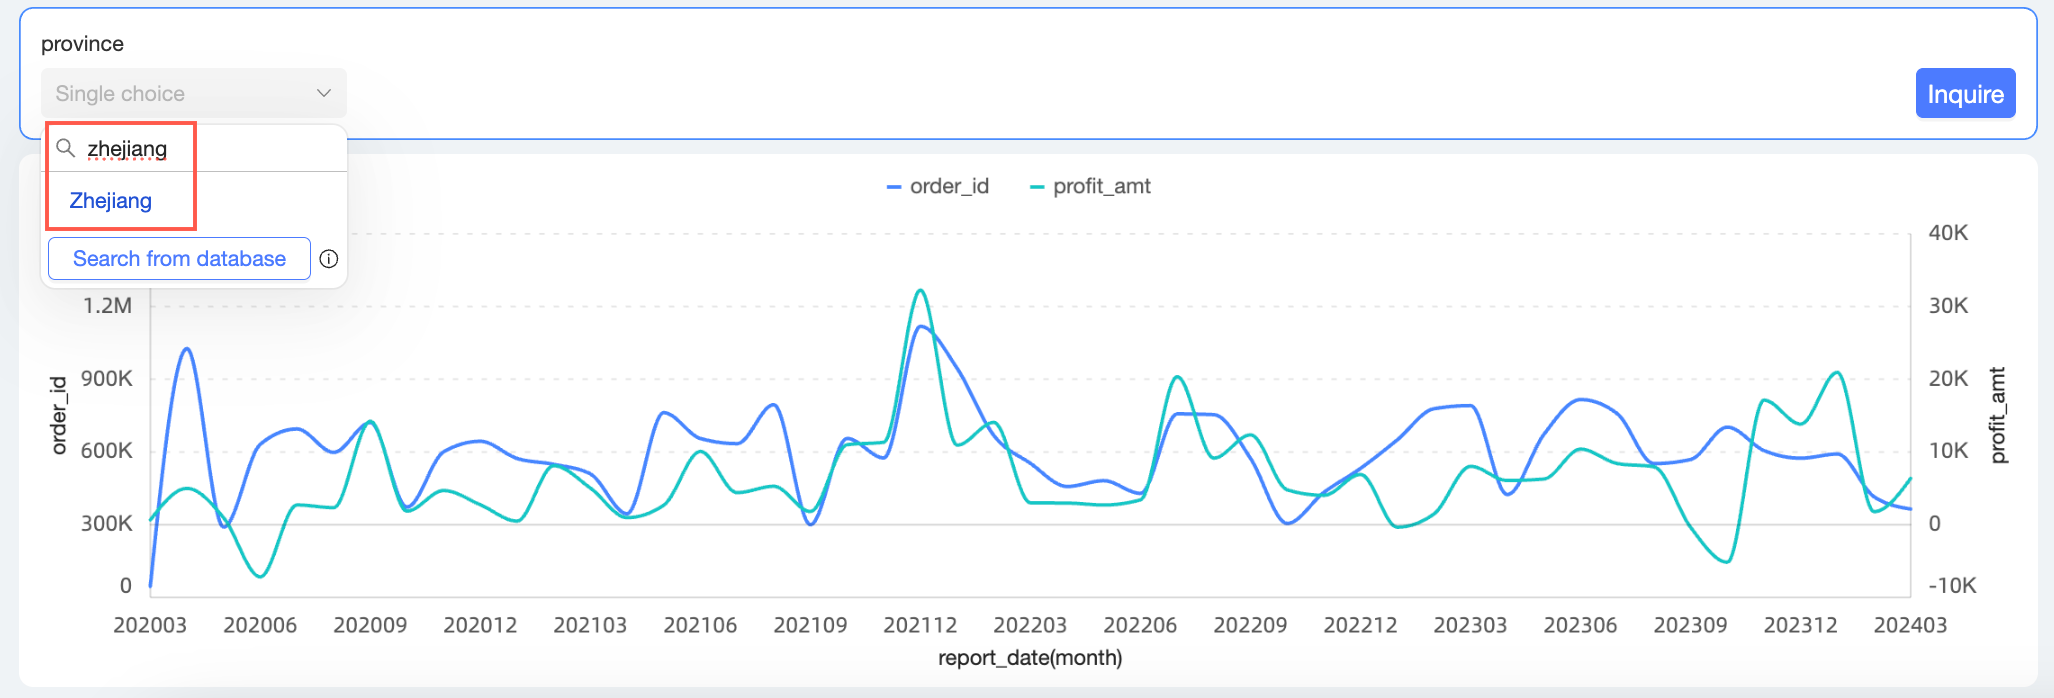
If you cannot find the desired option value, you can select Search from database.
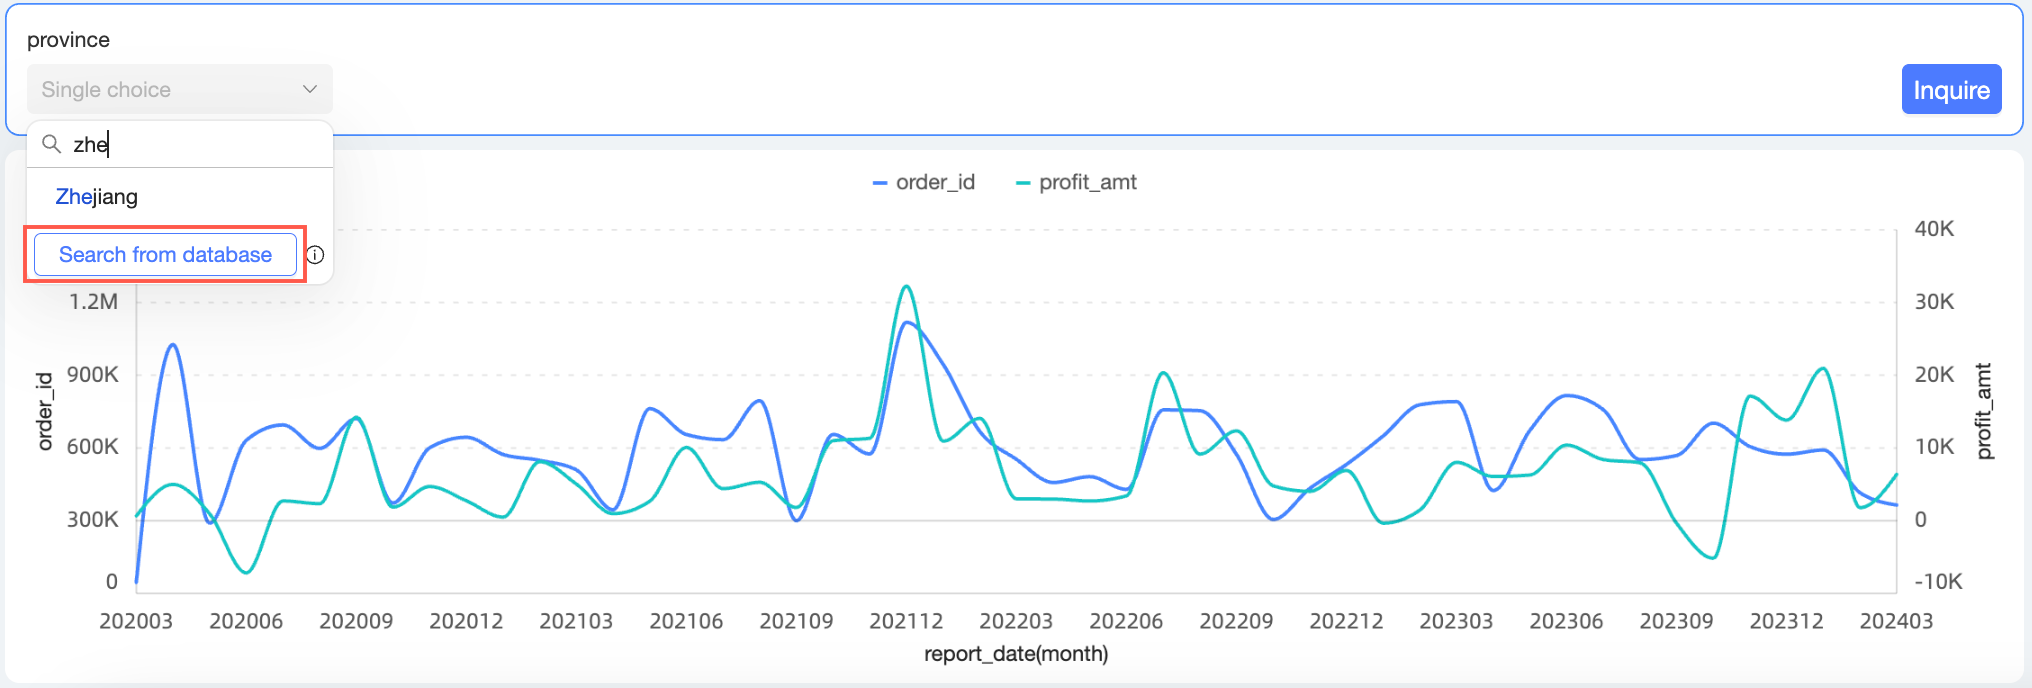
If there are more than 1,000 filter items, only the first 1,000 are displayed by default. You can search for items that are not displayed. If you still cannot find the desired option value, select Search from database.
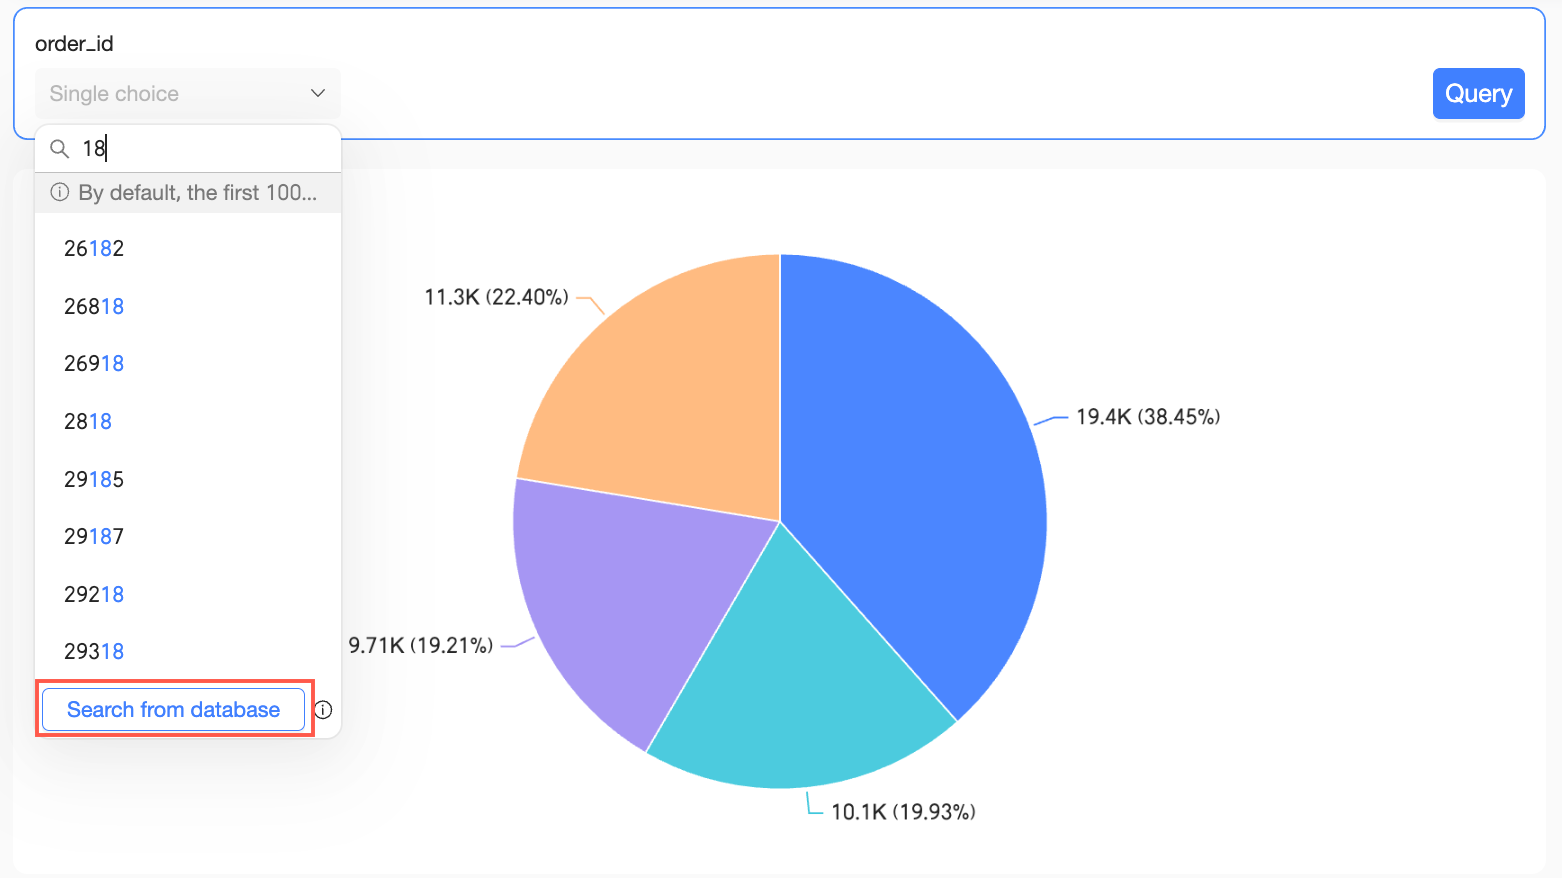
Searching from the database is supported only when Display type is set to Drop-down list and the option value source is Automatic parsing or Single dataset.
Text input box
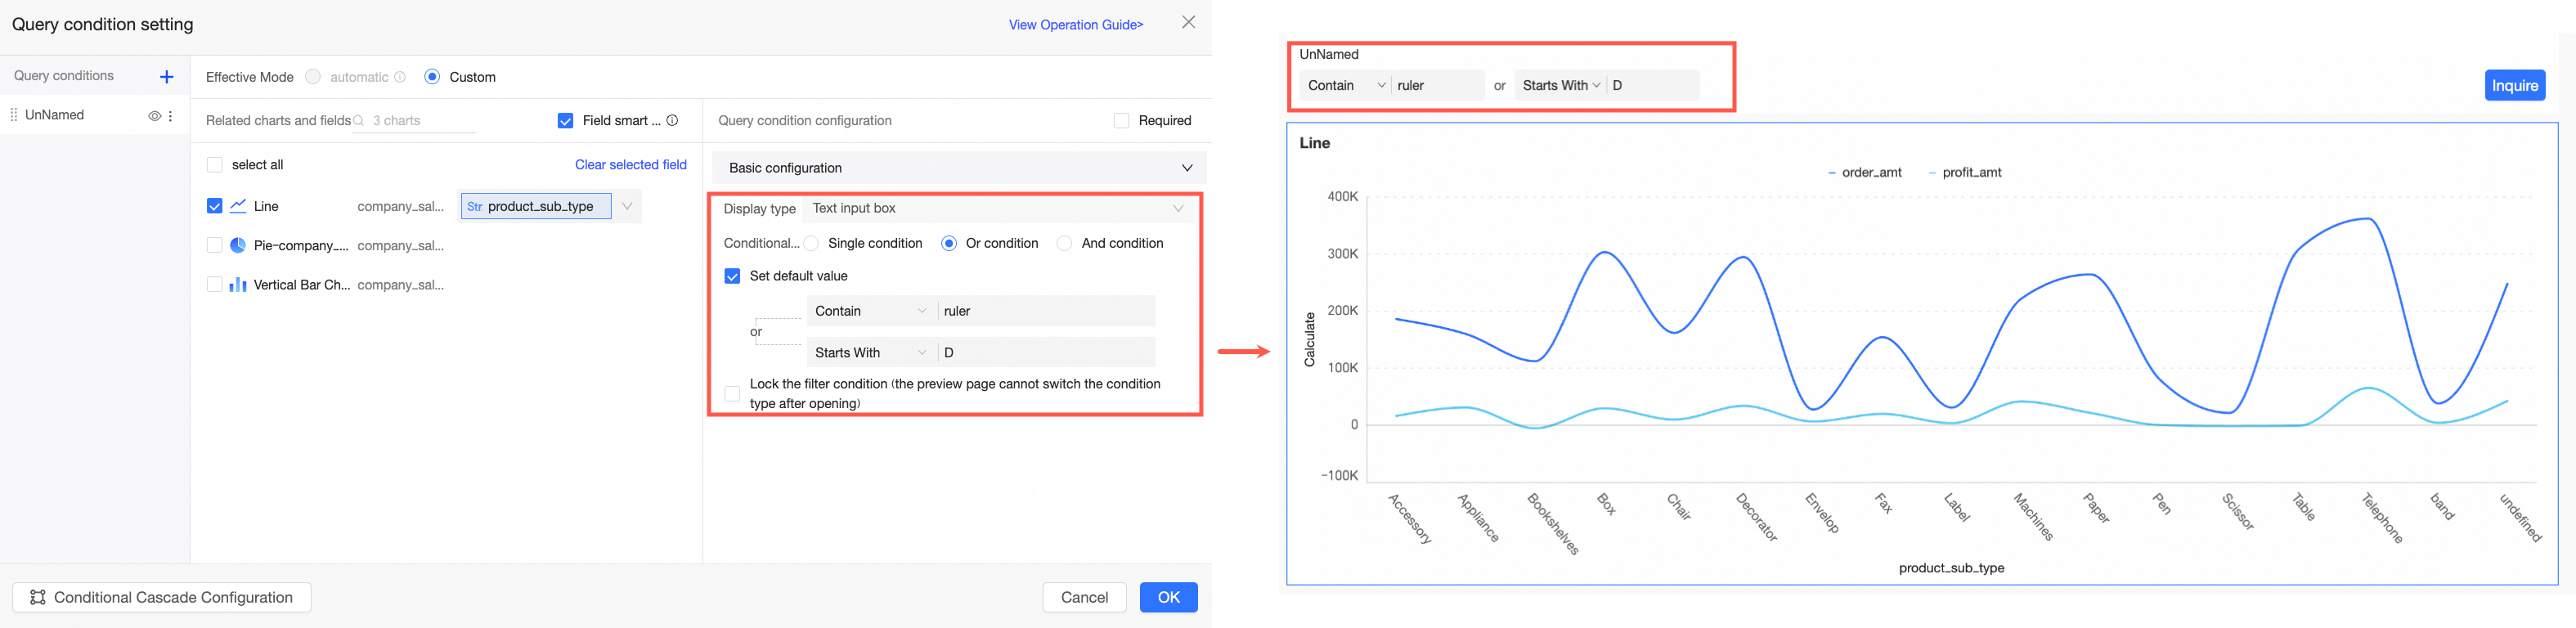
The text input box display type allows report viewers to quickly retrieve the data they need by typing keywords into the query box. This makes data queries more precise and flexible. When you set the display type to Text Input Box, the supported conditions are Single Condition, Or Condition, and And Condition. The following example uses the Or Condition.
Configuration item | Description | Example |
Conditional Form | Supports Single Condition, Or Condition, and And Condition.
|
|
Set Default Value | The values vary based on the selected conditional form. For example, to set a default value for the Product type field, the rules and corresponding SQL syntax are as follows:
| |
Lock Filter Condition | If you enable this option, you cannot switch the conditional form on the preview page. Note This option appears only when Set Default Value is selected. |
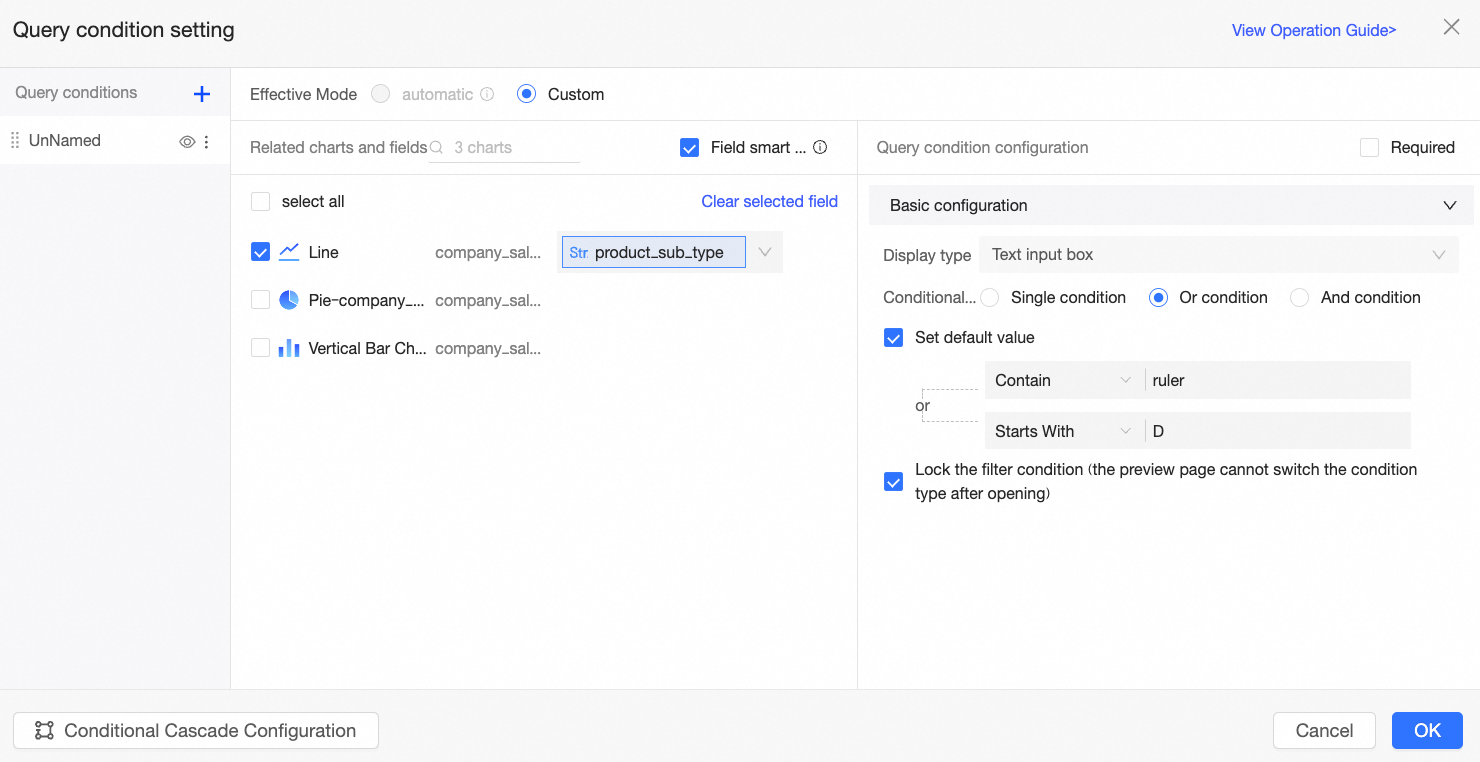
In this example:
When Conditional form is set to Or Condition, data that meets any of the query conditions is displayed.
Set default value is configured to Contain the character "Ruler", or Start with the character "Table". When a report viewer opens the report, the query results for product types that contain "Ruler" or start with "Table" are displayed by default.
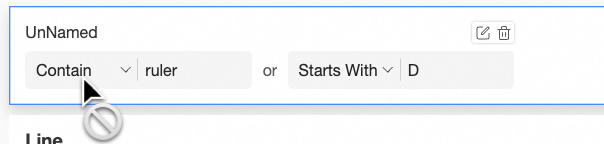
Lock filter condition is selected. This prevents report viewers from switching the conditional form in the query control on the report page.
The following figure shows the result.
Tree drop-down
The tree drop-down display type allows report viewers to filter data that has a parent-child relationship, such as organizational structures, geographical areas (Country-Province-City), or product categories (Main Category-Subcategory). It allows users to locate and filter data in a hierarchical structure by expanding and selecting items at each level.
If the associated chart uses a dataset union and multiple foreign key fields are selected, you cannot set the display type to tree drop-down.
Configuration item | Description | Example | |
Select dataset | You can select any dataset in the workspace where the current dashboard is located. We recommend that you select the dataset that is the data source for the chart. |
| |
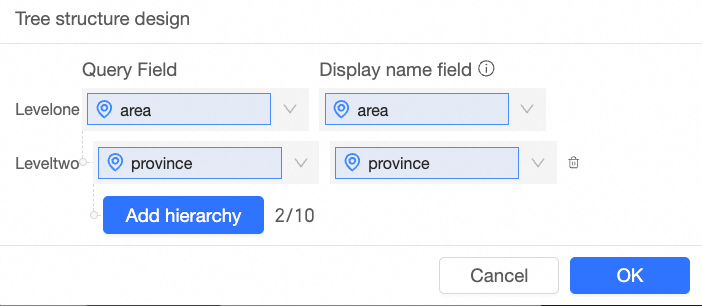
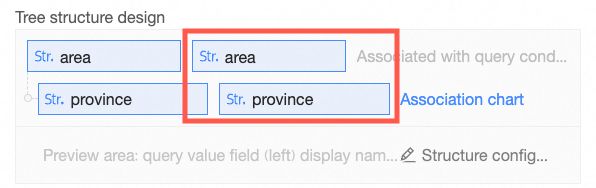
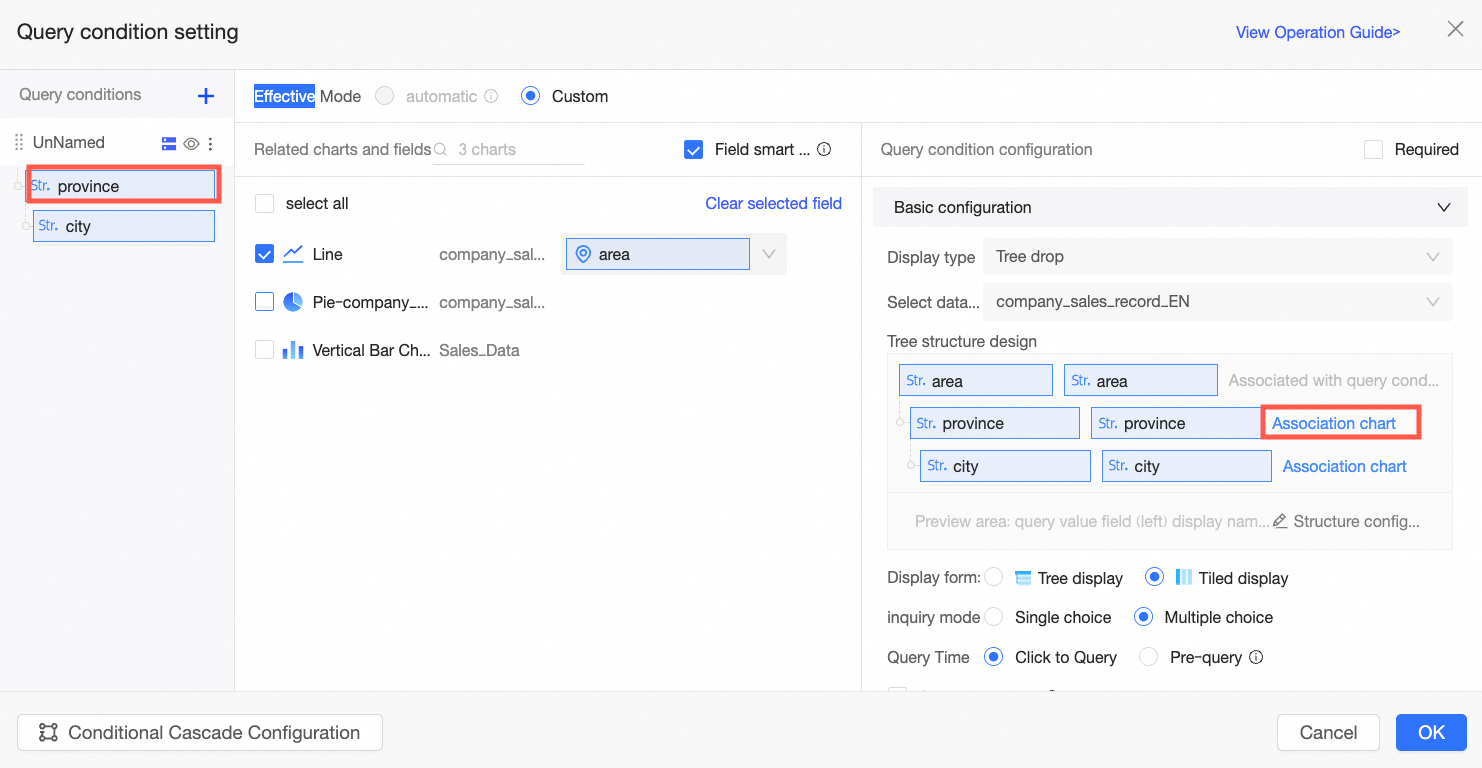
Tree structure design | Click Start configuration. In the Tree structure design dialog box, configure the Query field and Display field for each level in the query control.
Note
| ||
Display form | Supports Tree display and Tile display. Note When the data exceeds 1,000 entries, we recommend that you select Tile Display as the display form. |
| |
Query mode | Supports Single selection and Multiple selection. | ||
Query time | Supports Click to query and Pre-query.
| ||
Set default value | Select this option and set the relevant values. The preset values are displayed in the query control when the report page loads. Note The default value here is the display name field in the tree structure design. | ||
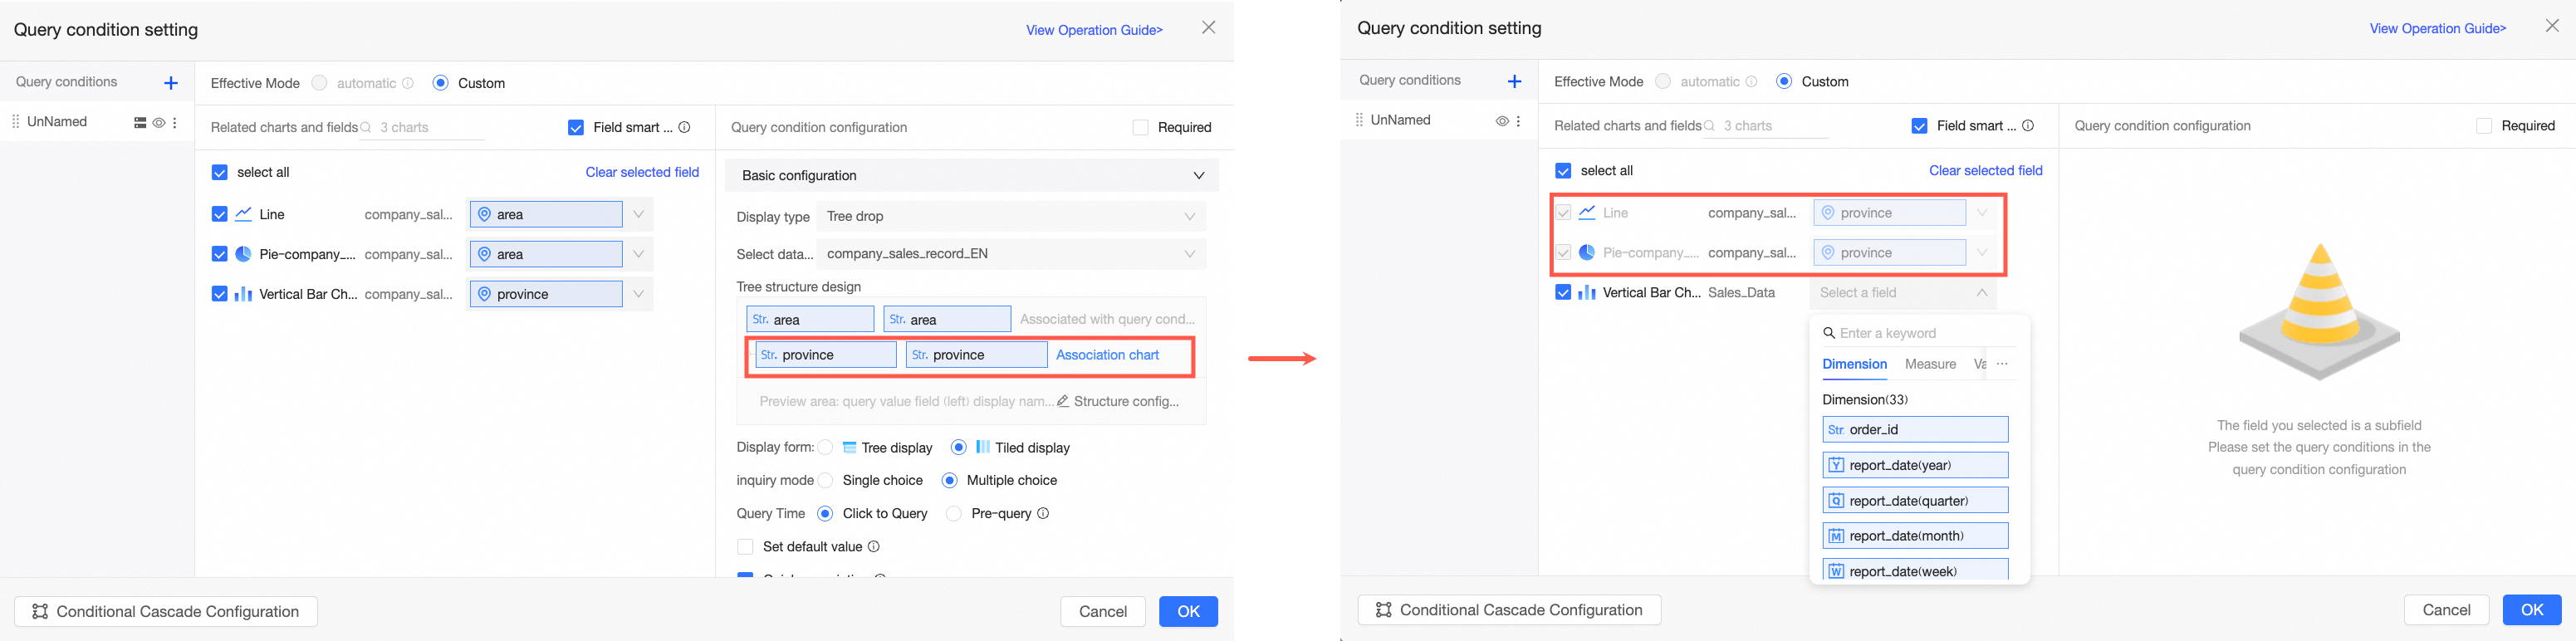
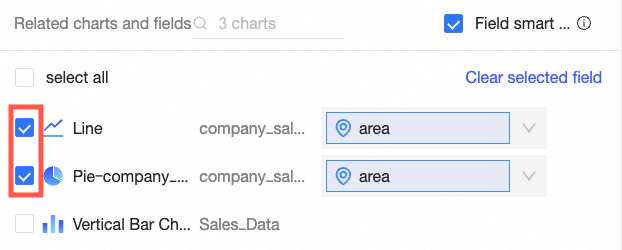
Quick association | After you select Quick Association, the sub-level fields in the tree structure are automatically added to the Associated chart and field section for charts from the same dataset. This improves the efficiency and accuracy of query control configuration. For example, in the following figure, when you configure the associated chart and field for the second-level Province, the system automatically fills the province field into the foreign key fields of the Line Chart and Column Chart from the same dataset. The foreign key field for the Pie Chart, which is from a different dataset, must be entered manually.
Note Only the charts selected in the Associated chart and field section of the main level support automatic synchronization of sub-level fields. You can click Associated Chart in the tree structure or click the name of the sub-level in the query items on the left to associate the sub-level with charts and fields from other datasets. | ||

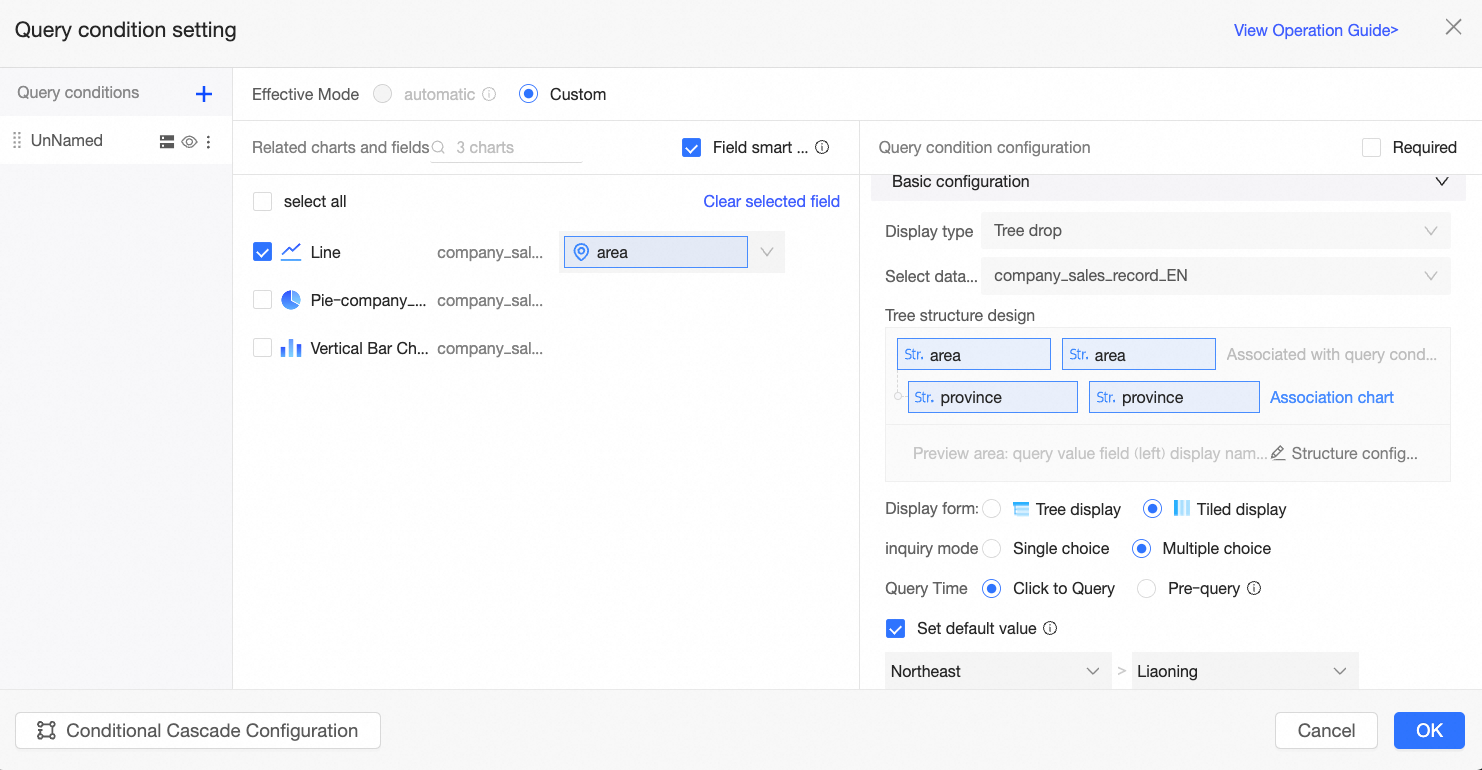
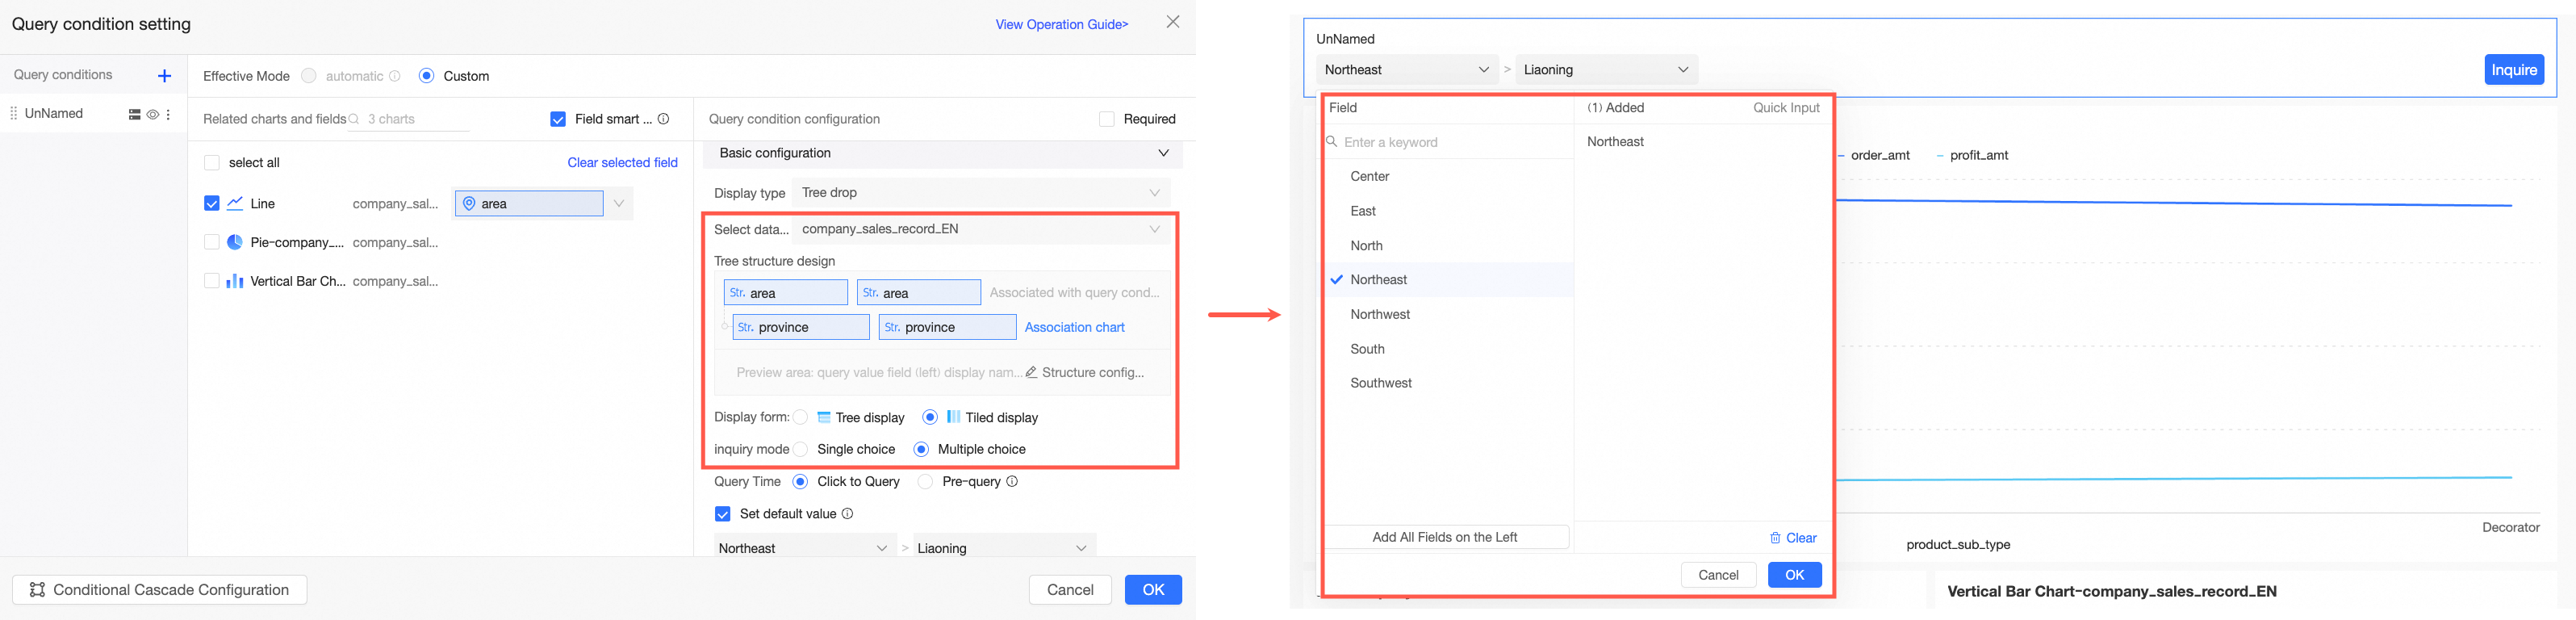
In this example:
Select dataset is set to the current chart's source dataset, company_sales_record.
For the Tree structure design, the region field is configured for level one and the province field for level two. Because the query field values are clear and easy to understand, the query field and the display name field are set to the same fields.
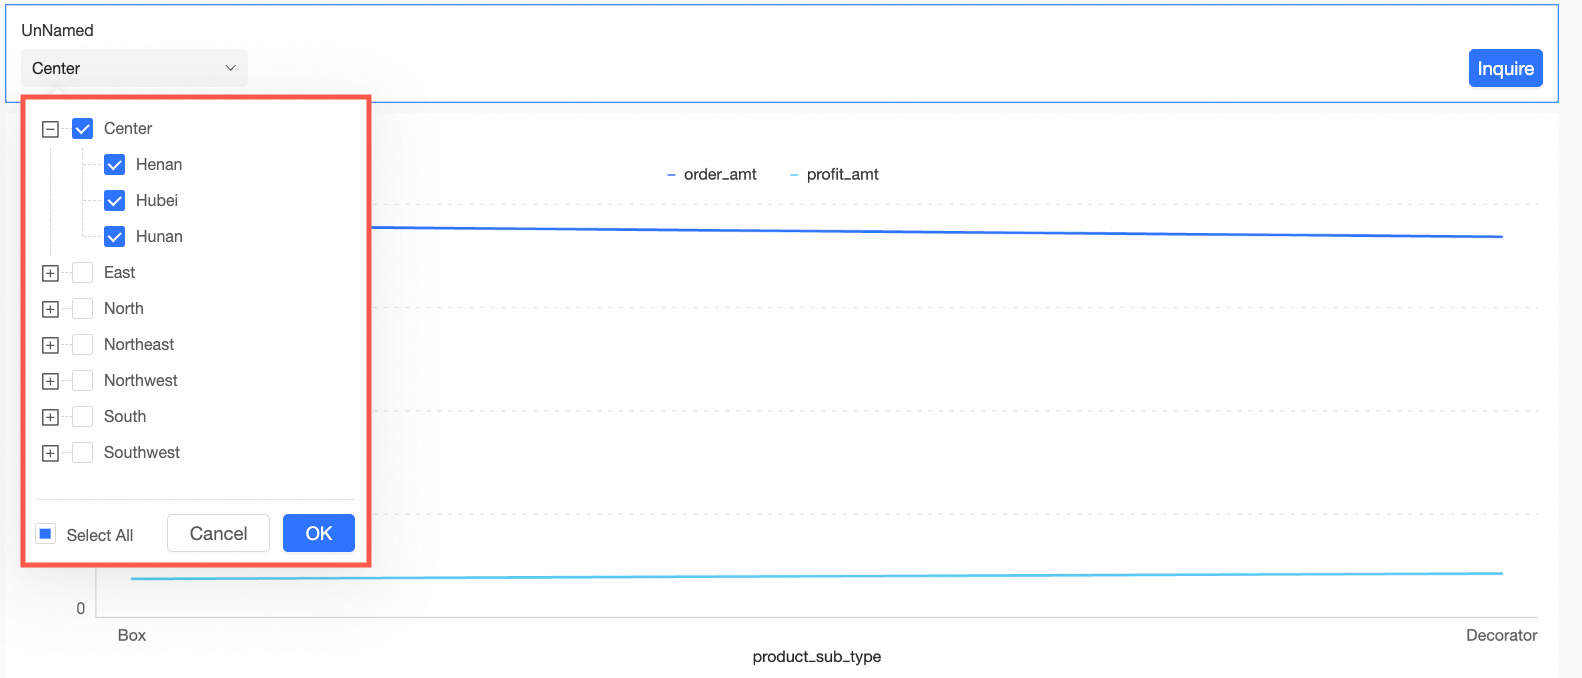
Display form is set to Tile display.
Query mode is set to Multiple selection, which means the report viewer can select multiple option values in the query control.
Query time is set to Click to query, which means the report viewer must click the query button to trigger a conditional query.
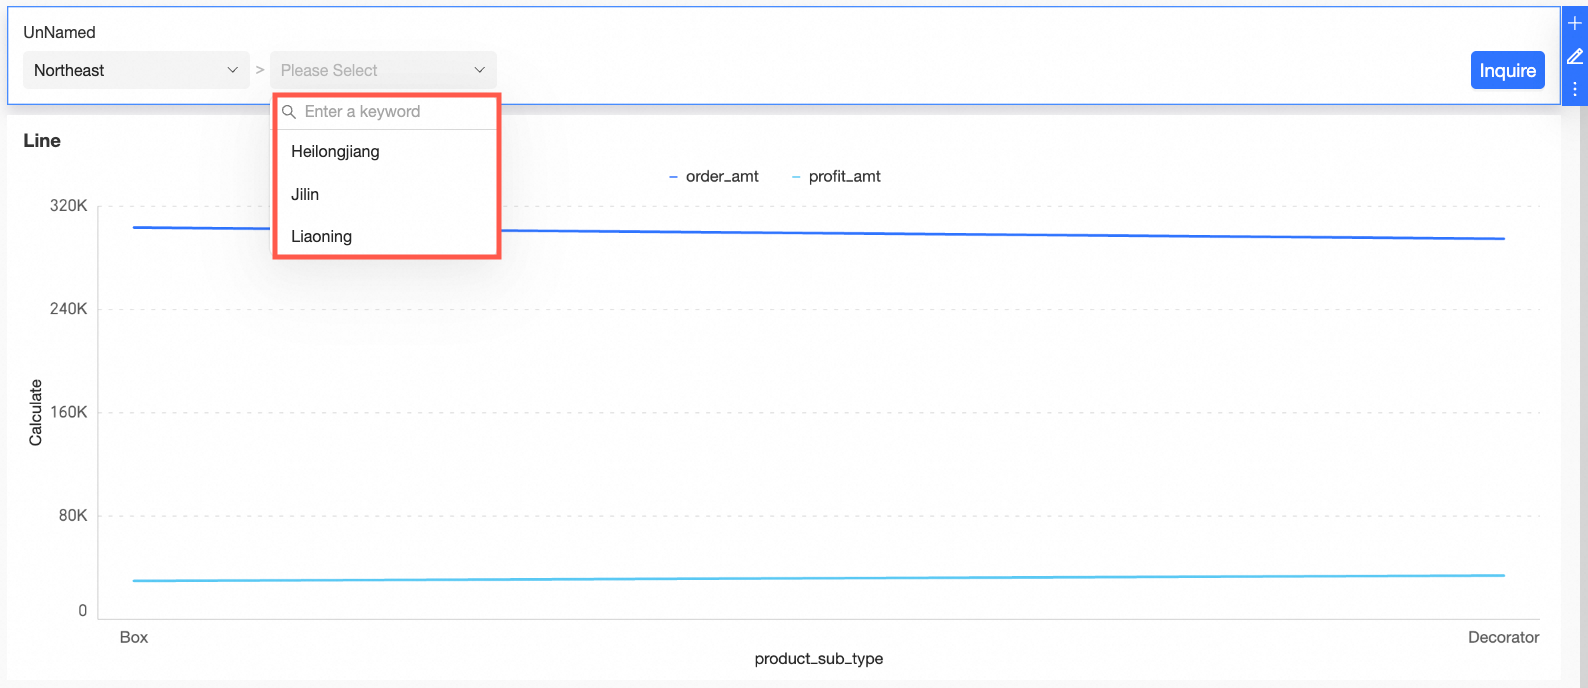
Set default value is set to Northeast > Liaoning. When a report viewer opens the report, the query results for the Northeast region and Liaoning province are displayed by default.
Quick association is selected.
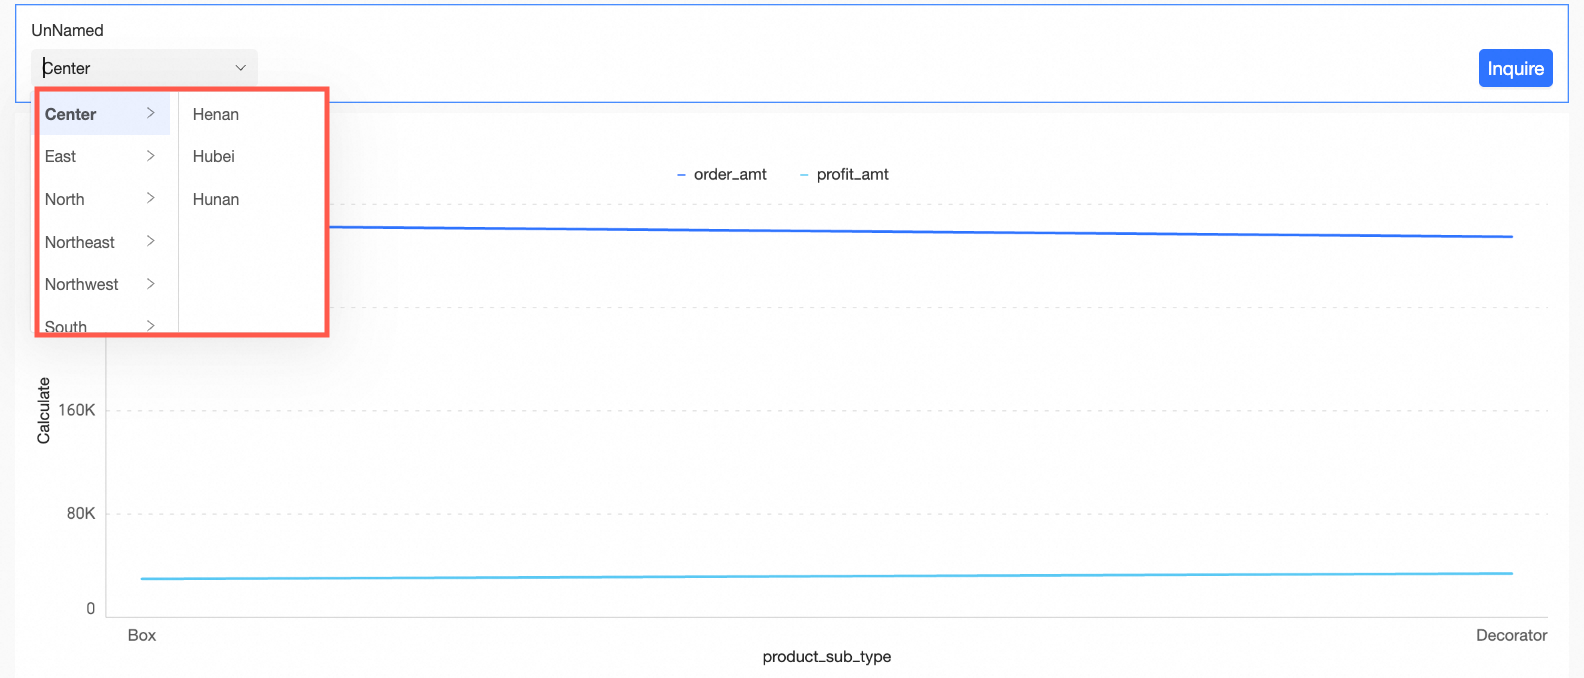
The following figure shows an example of the result.