After configuring monitoring alerts, open the Metric Monitoring center to see an alert overview for all metrics, or drill into a specific metric to review its alert details.
View the monitoring alert overview
Open the metric monitoring center
You can open the metric monitoring center from two entry points:
From the navigation bar
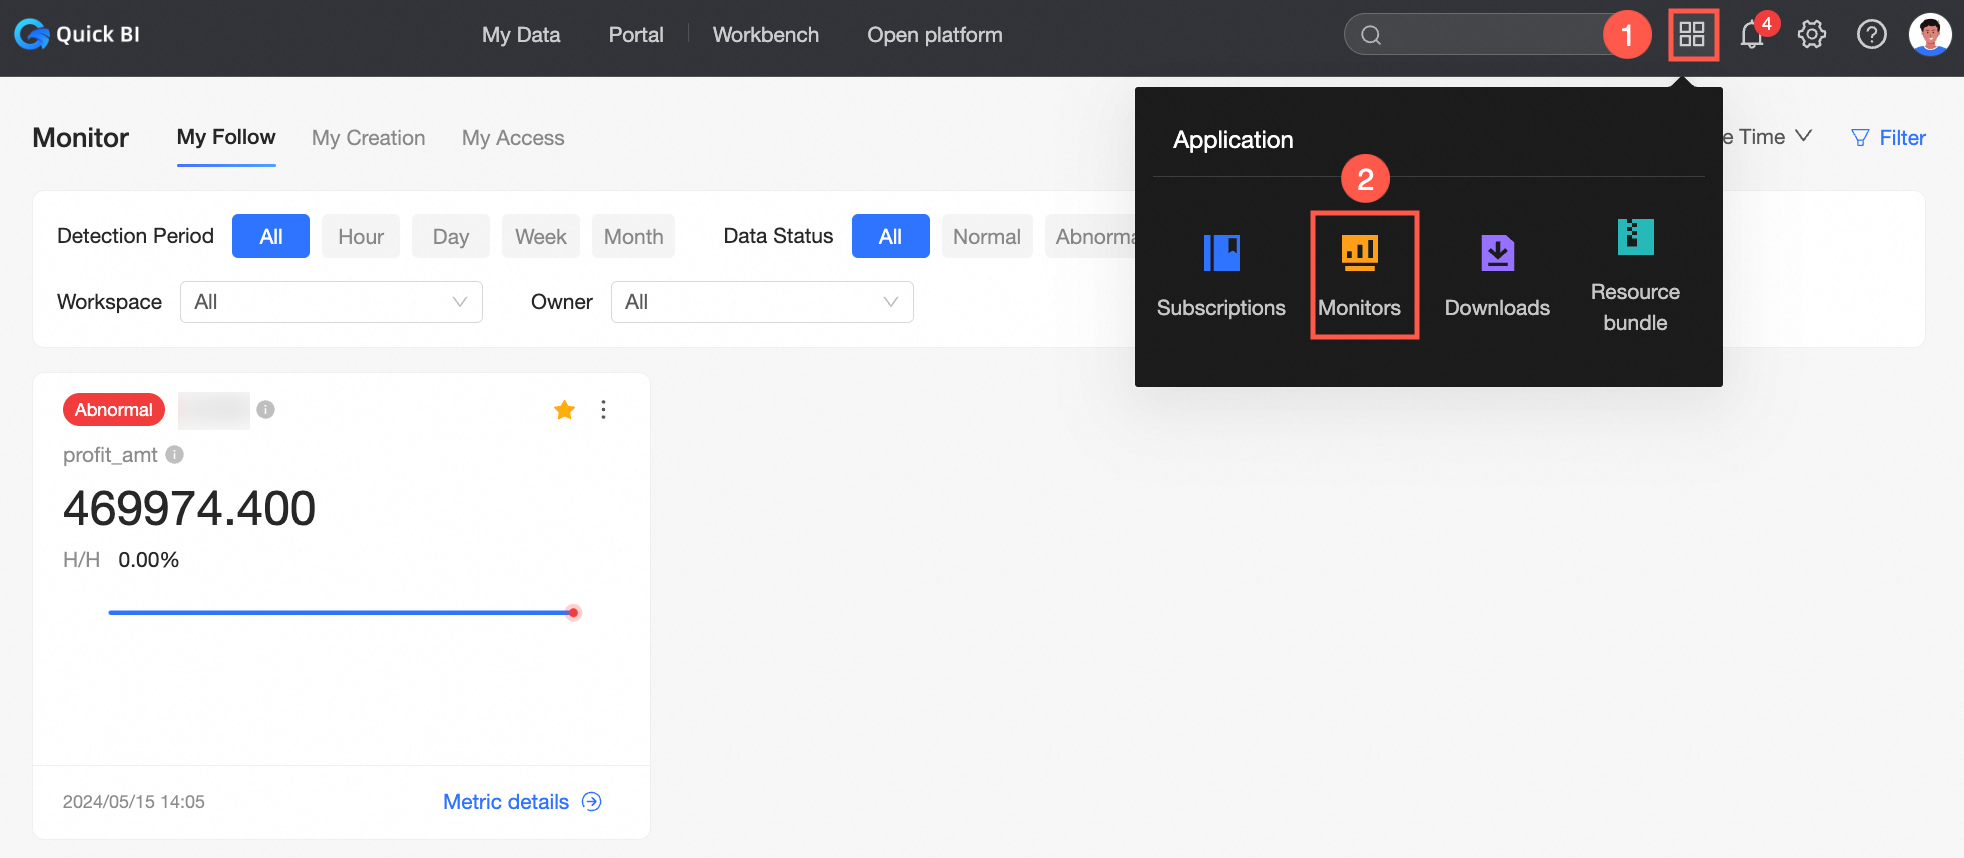
On the home page, click the navigation bar icon in the top-right corner, then select  Metric monitoring from the application list. The metric monitoring center opens, displaying an overview of all active metric monitoring items.
From a chart preview page
-
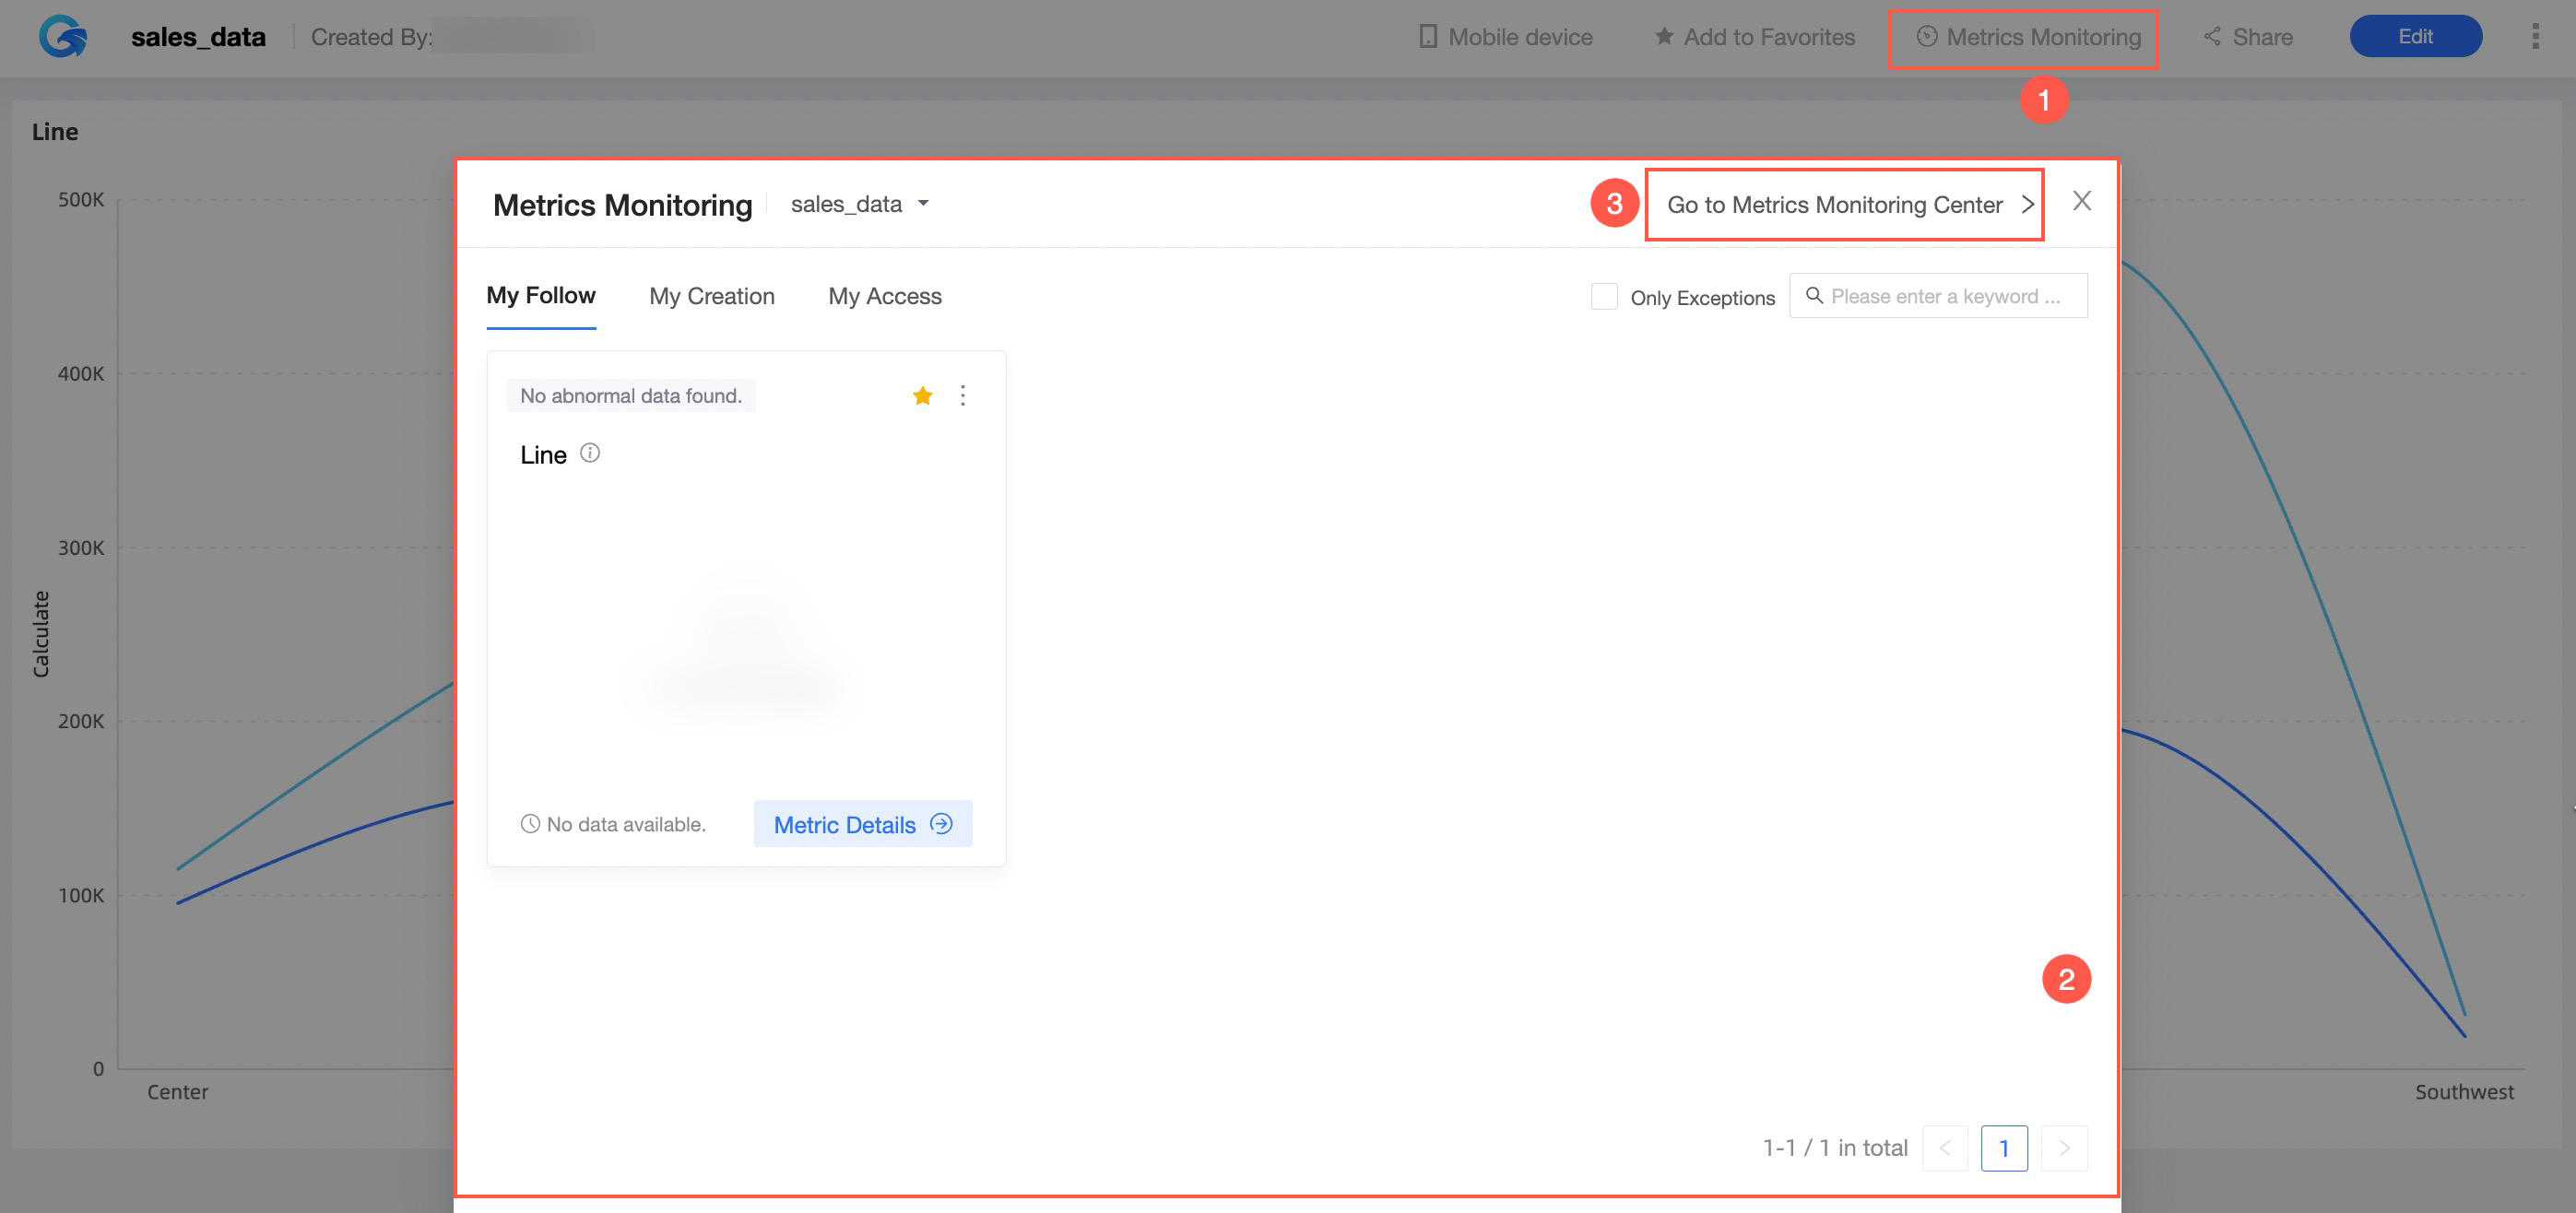
On a dashboard chart's preview page, click Metric monitoring (①) in the top-right corner. A popup shows the current alert settings for that chart (②). Click Go to metric monitoring center (③) to open the metric monitoring center and view the alert overview for all monitored metrics.
-
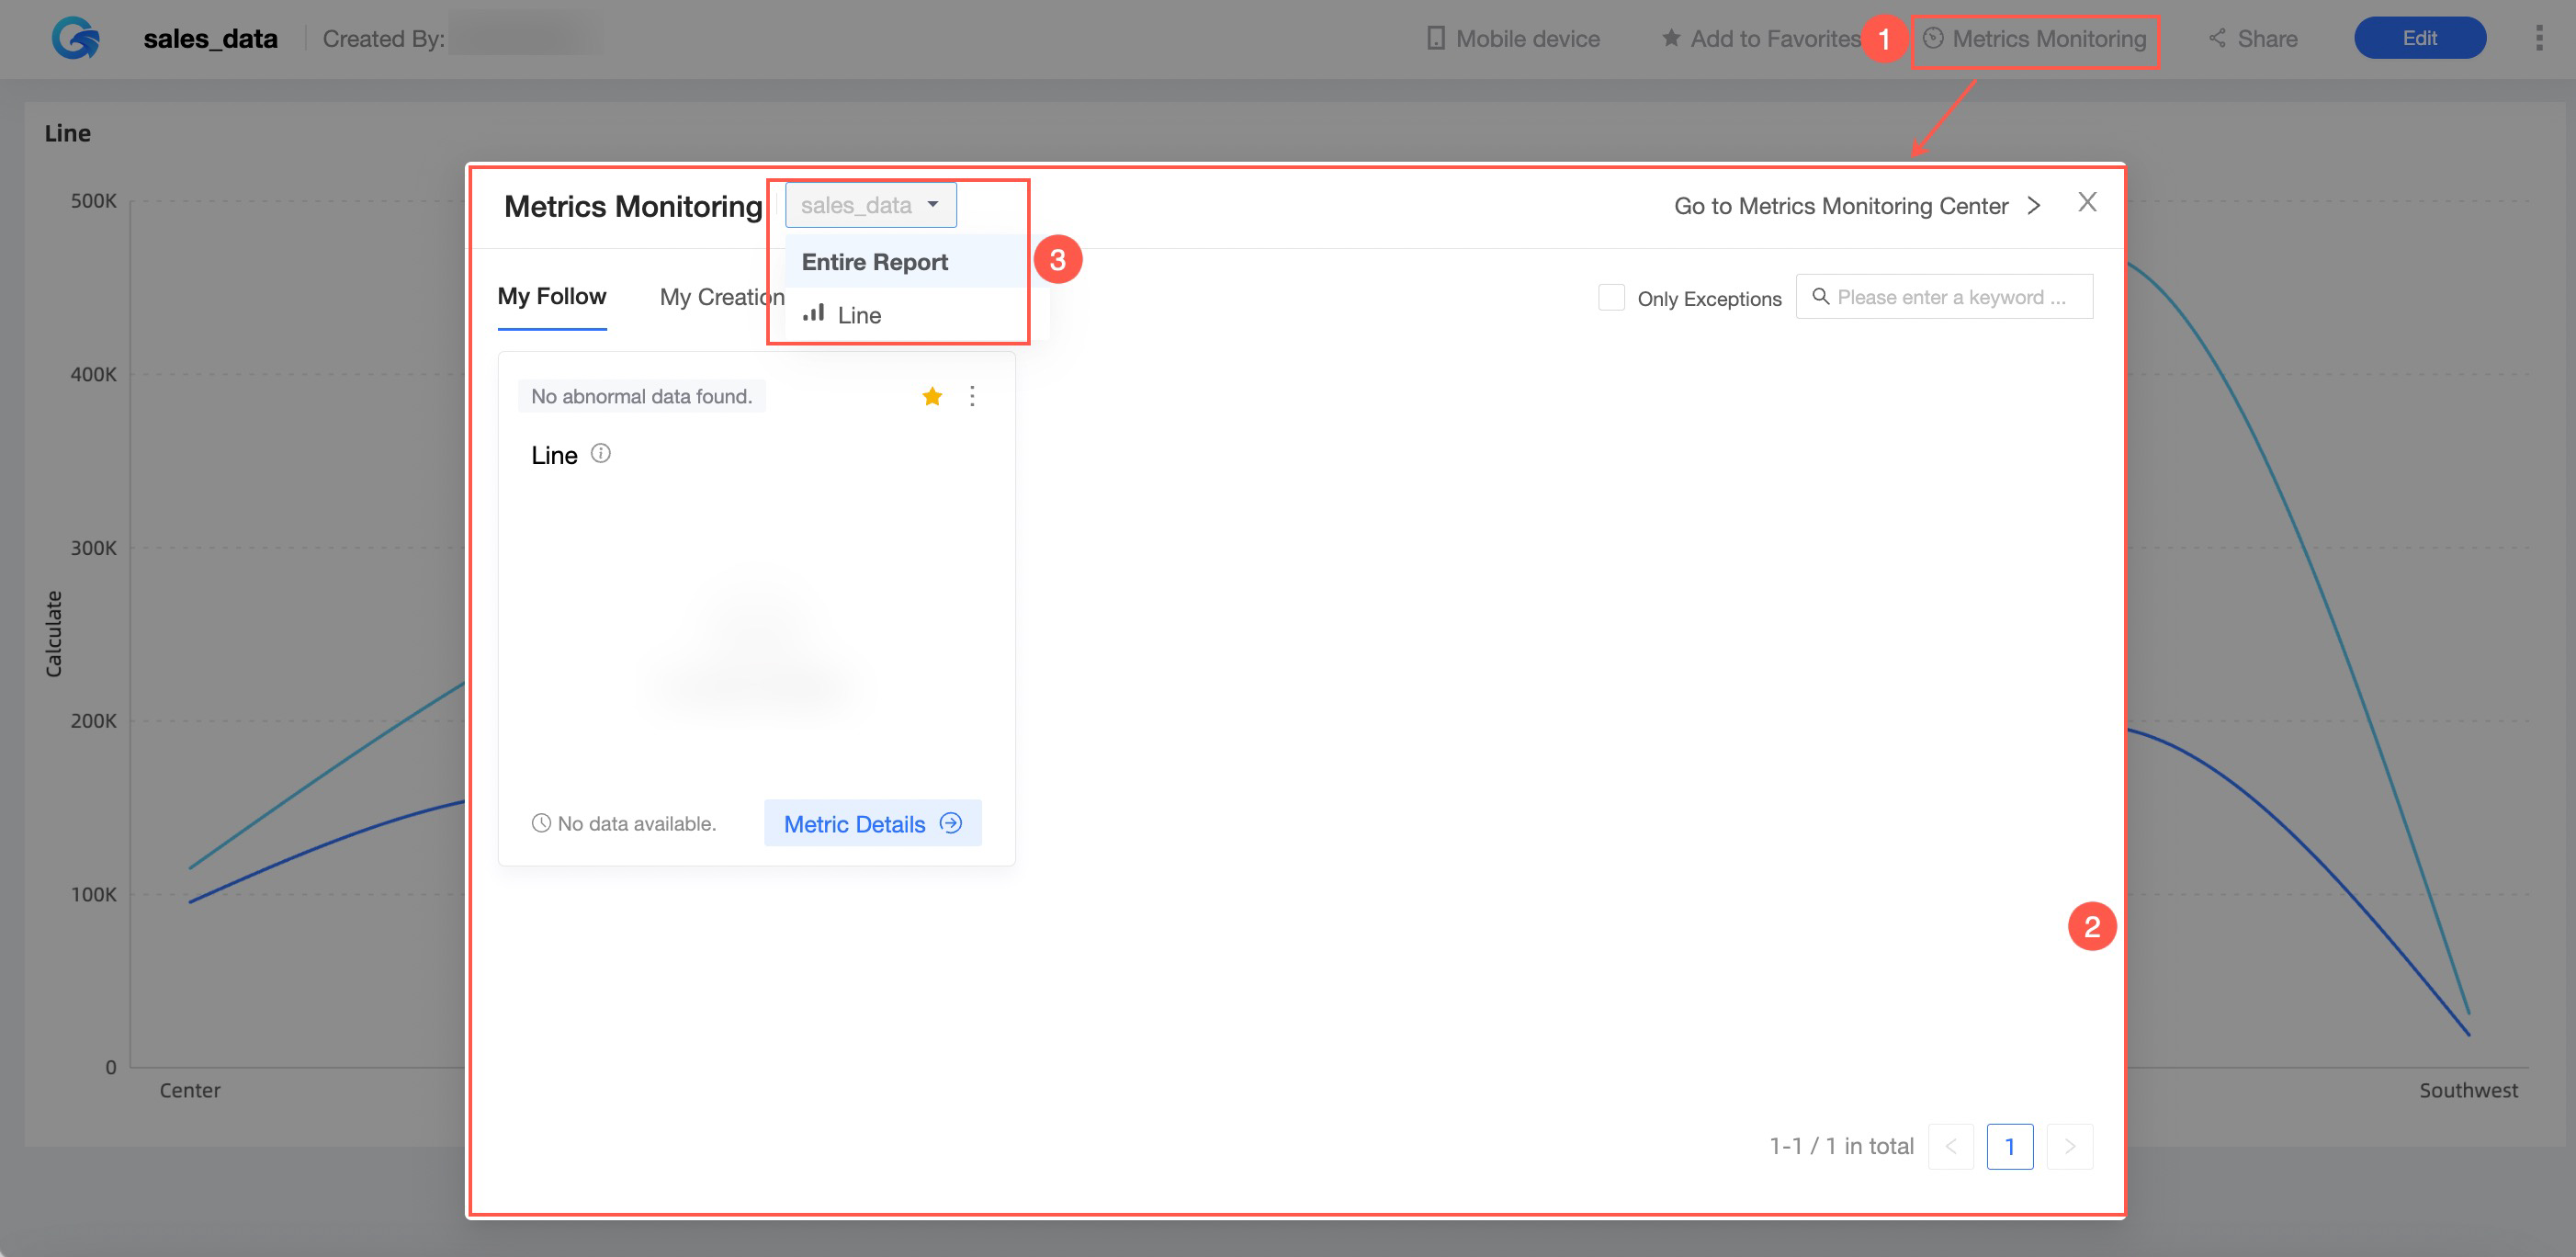
To check the current dashboard's monitoring status without leaving it, browse the details inside the metric monitoring popup. Use the dropdown to switch chart granularity and review the monitoring status for each chart.
Metric monitoring overview content
Tabs
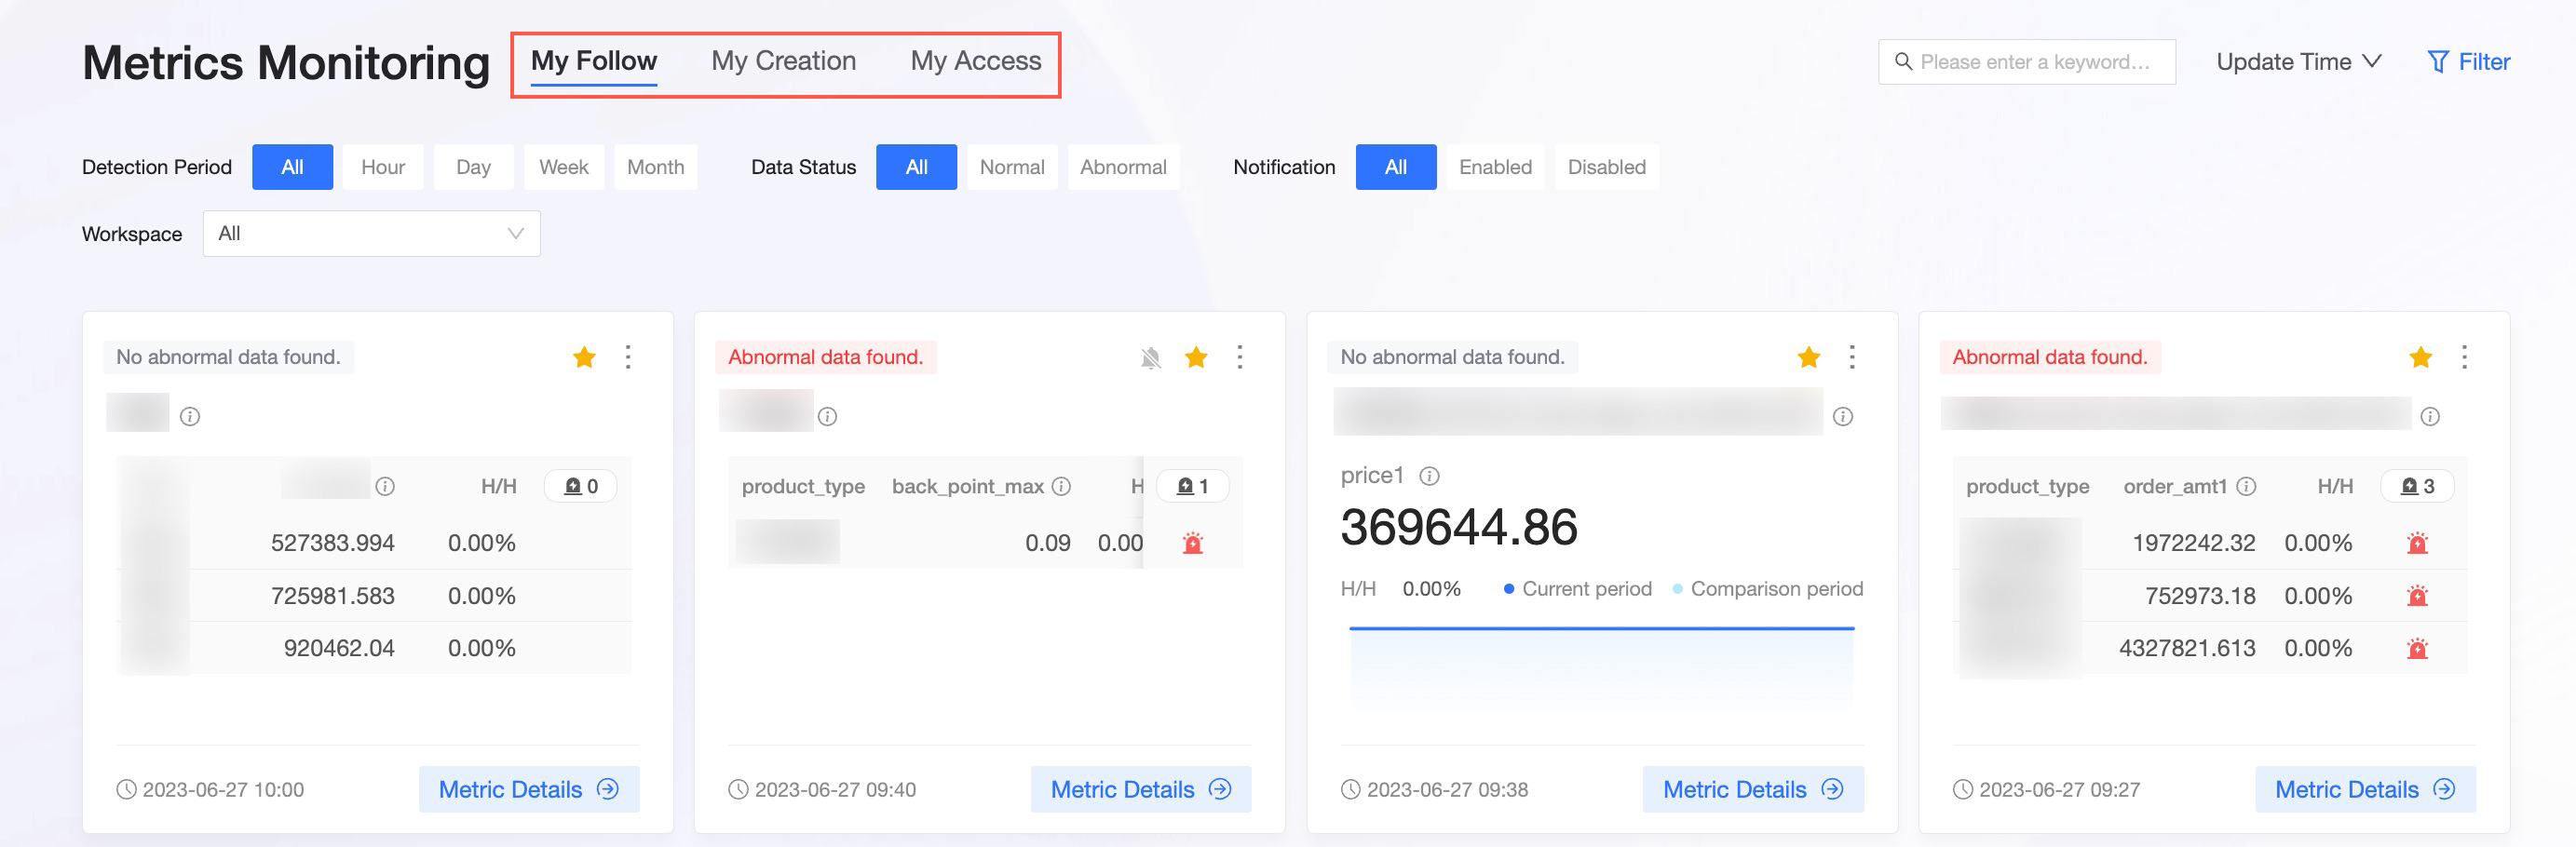
The metric monitoring center organizes alerts into three tabs:
Followed by me: Lists all metric monitoring items you follow. When message notifications are enabled for a metric monitoring item, the message recipient is added as a follower by default. To unfollow, click the
 icon in the top-right corner of the metric card.
Created by me: Lists all metric monitoring items you have created.
Authorized to me: Lists all metric monitoring items you have permission to view.
Search
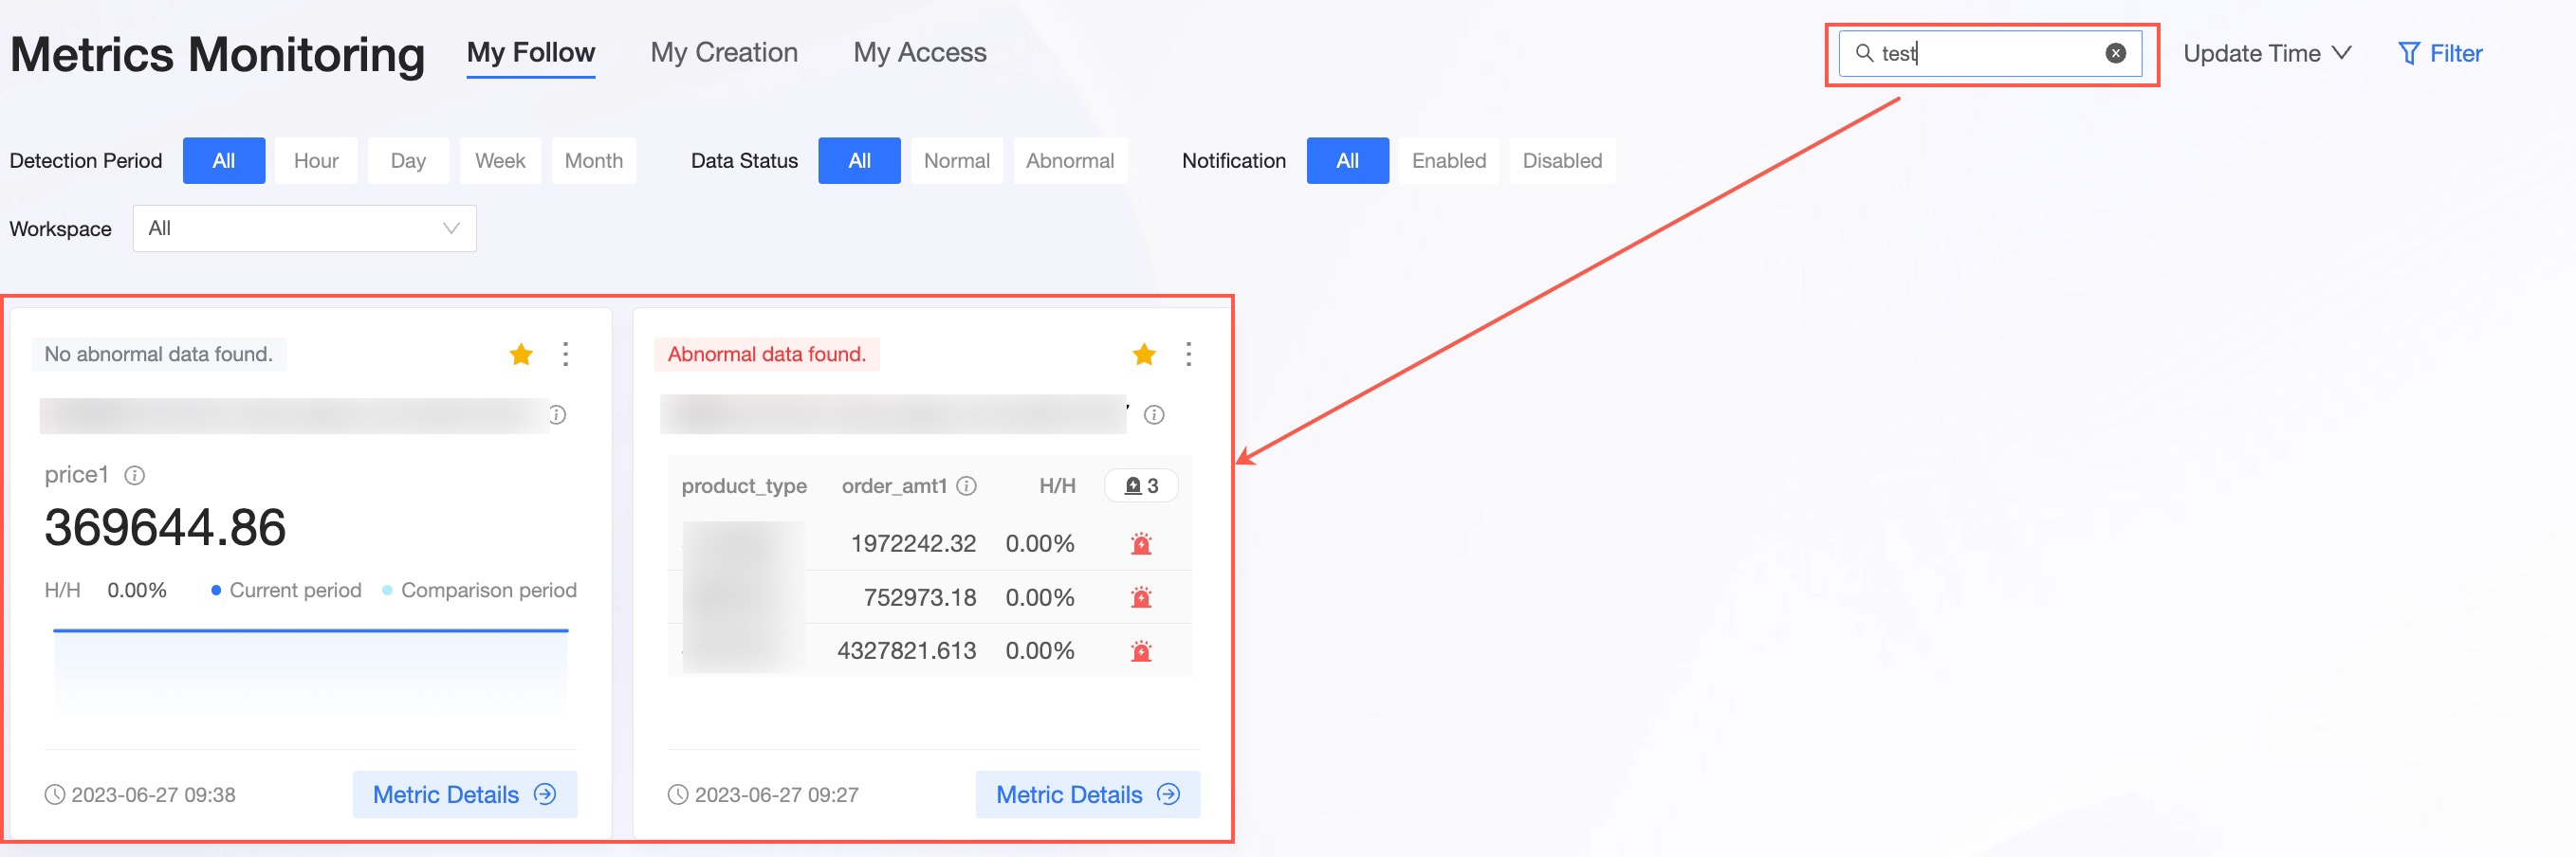
To find a specific metric monitoring alert, enter its name in the search box at the top right of the overview page.
Filter panel
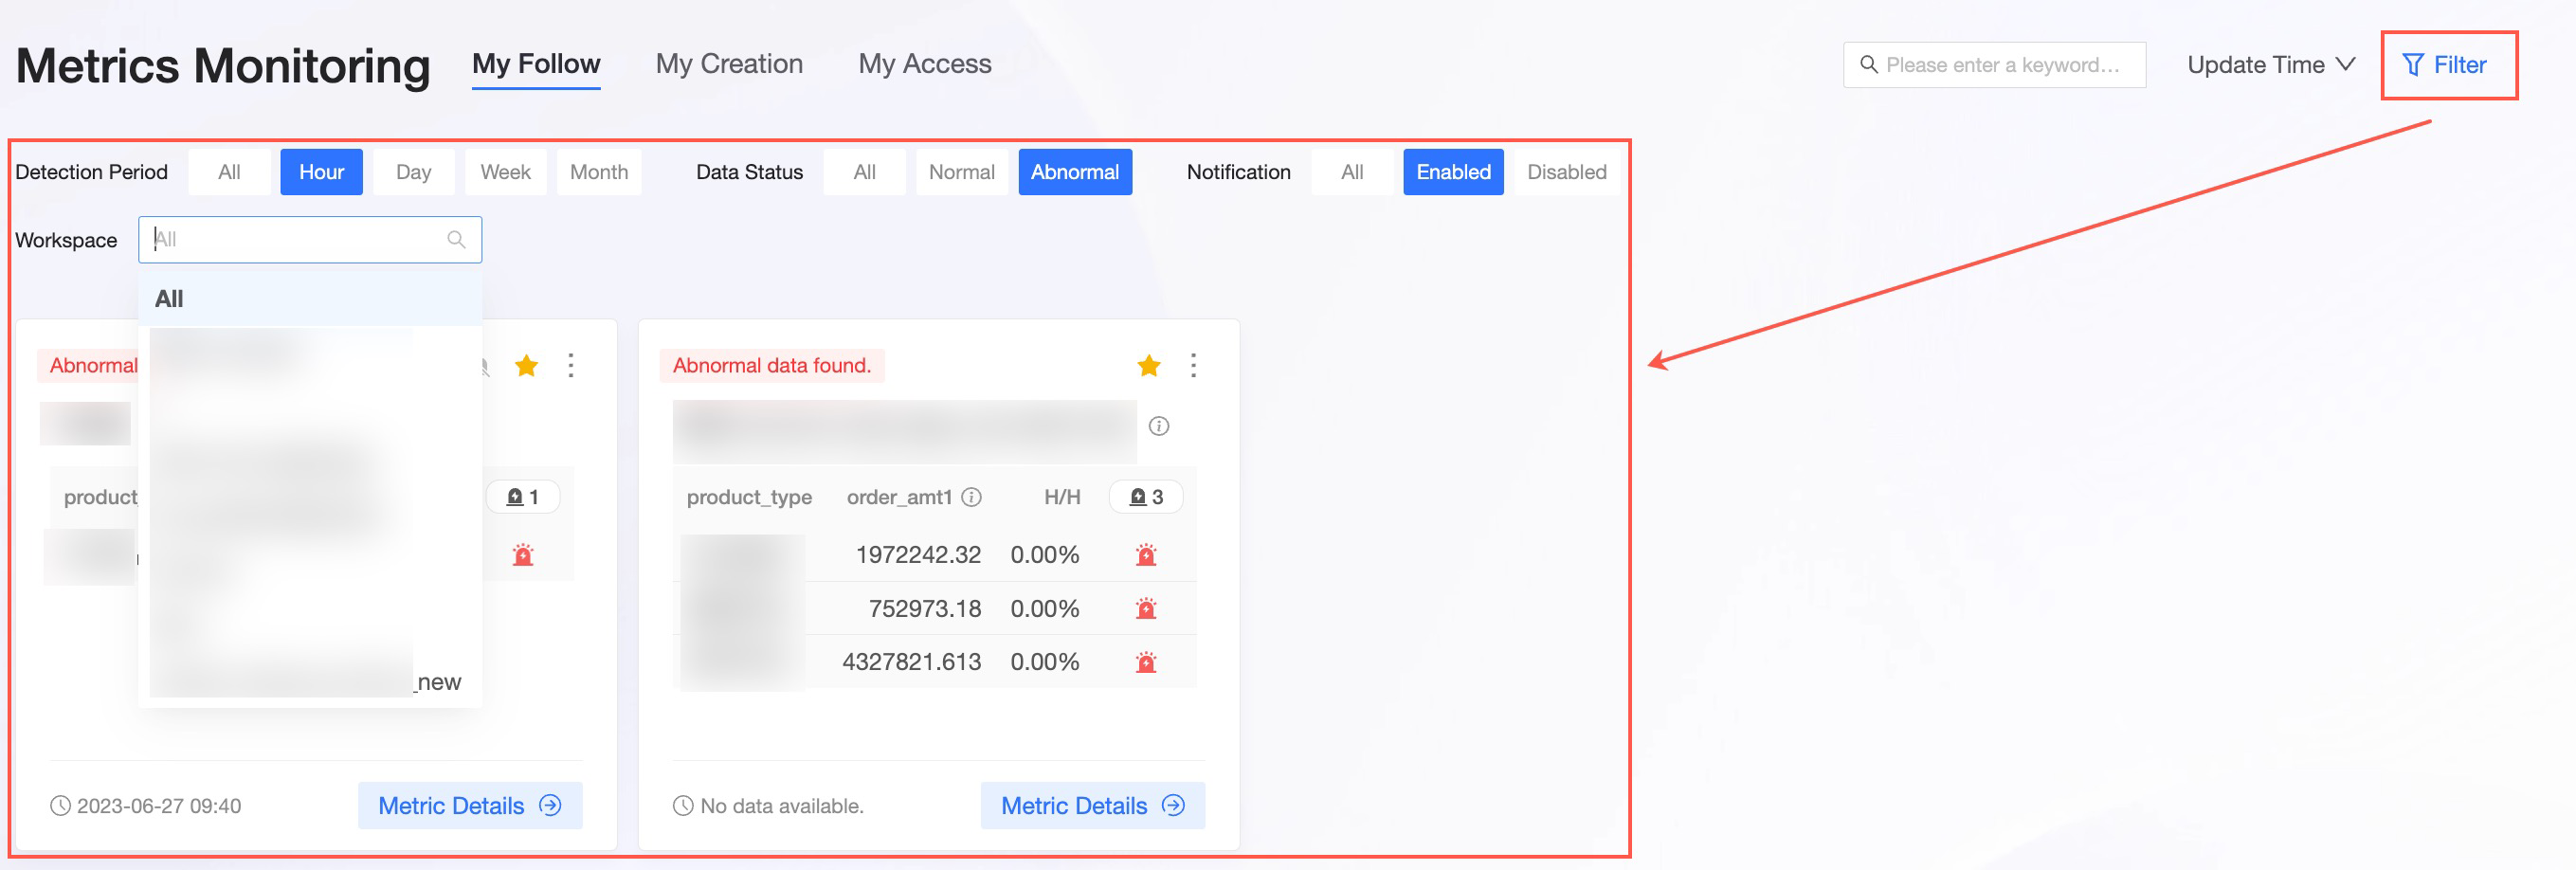
Click the Filter button at the top right of the overview page to expand the filter panel and narrow the list by dimension.
To show only alerts with anomalies, set Status to Anomaly.
To scope the list to a specific area, select a Workspace, then choose a Report type and an Associated report.
Metric card
Each metric card shows the alert status for a monitored metric at a glance.
-
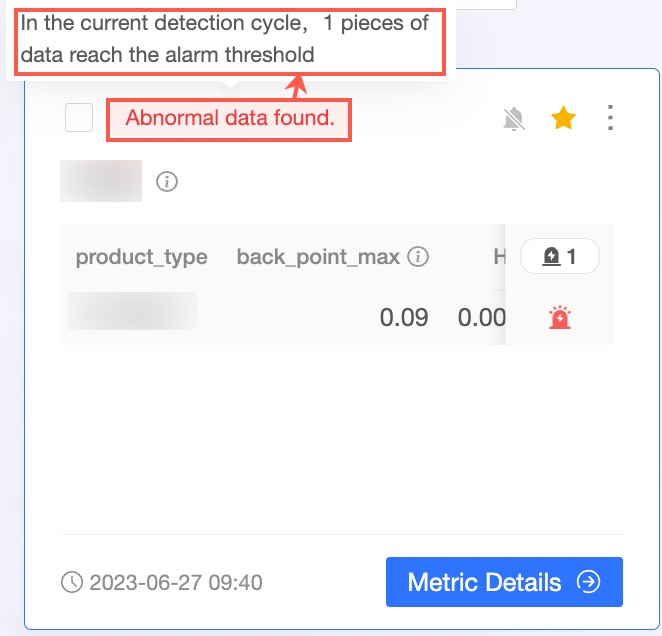
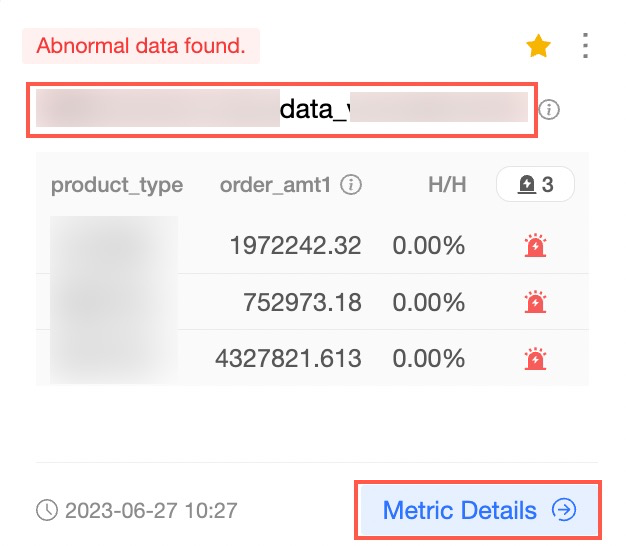
Anomaly detected: When monitoring detects anomalous data, an alert label appears in the top-left corner of the card. Hover over the label to see a summary of the anomalies.
-
Metric alert details: Click the metric name or the metric details button in the bottom-right corner of the card to view detailed metric alert information in a pop-up window on the right.
-
Metric settings: Hover over the metric name to reveal the
 icon, which shows the settings for that metric monitoring item.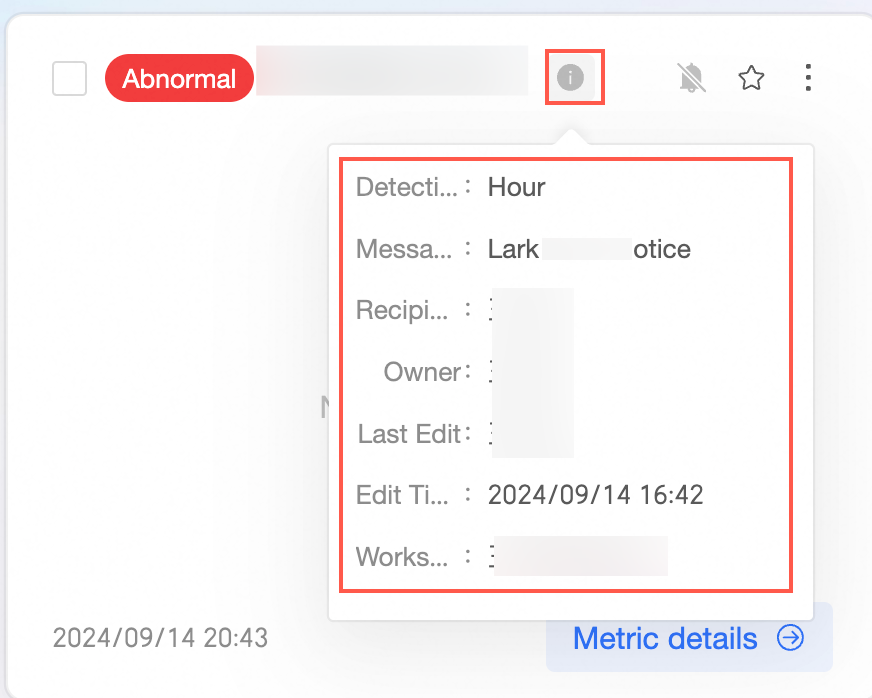
-
Follow/Unfollow:
Click the
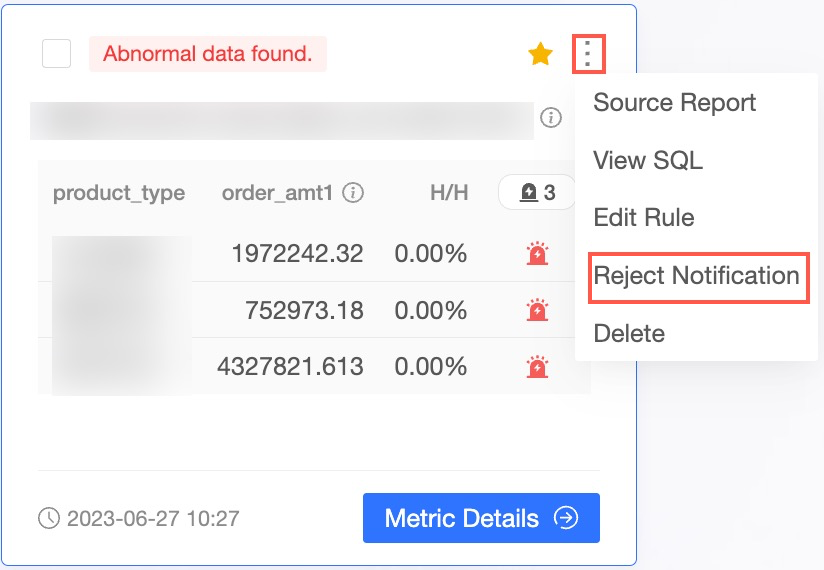
 icon in the top-right corner of the metric card to follow the metric and receive message notifications. To stop receiving notifications, click the
  icon and select Reject message push from the More operations list.
-
When message notifications are enabled for a metric monitoring item, the message recipient is added as a follower by default. To unfollow, click the
icon in the top-right corner of the metric card.Note: Unfollowing does not stop message notifications. Disable them separately.
View monitoring alert details
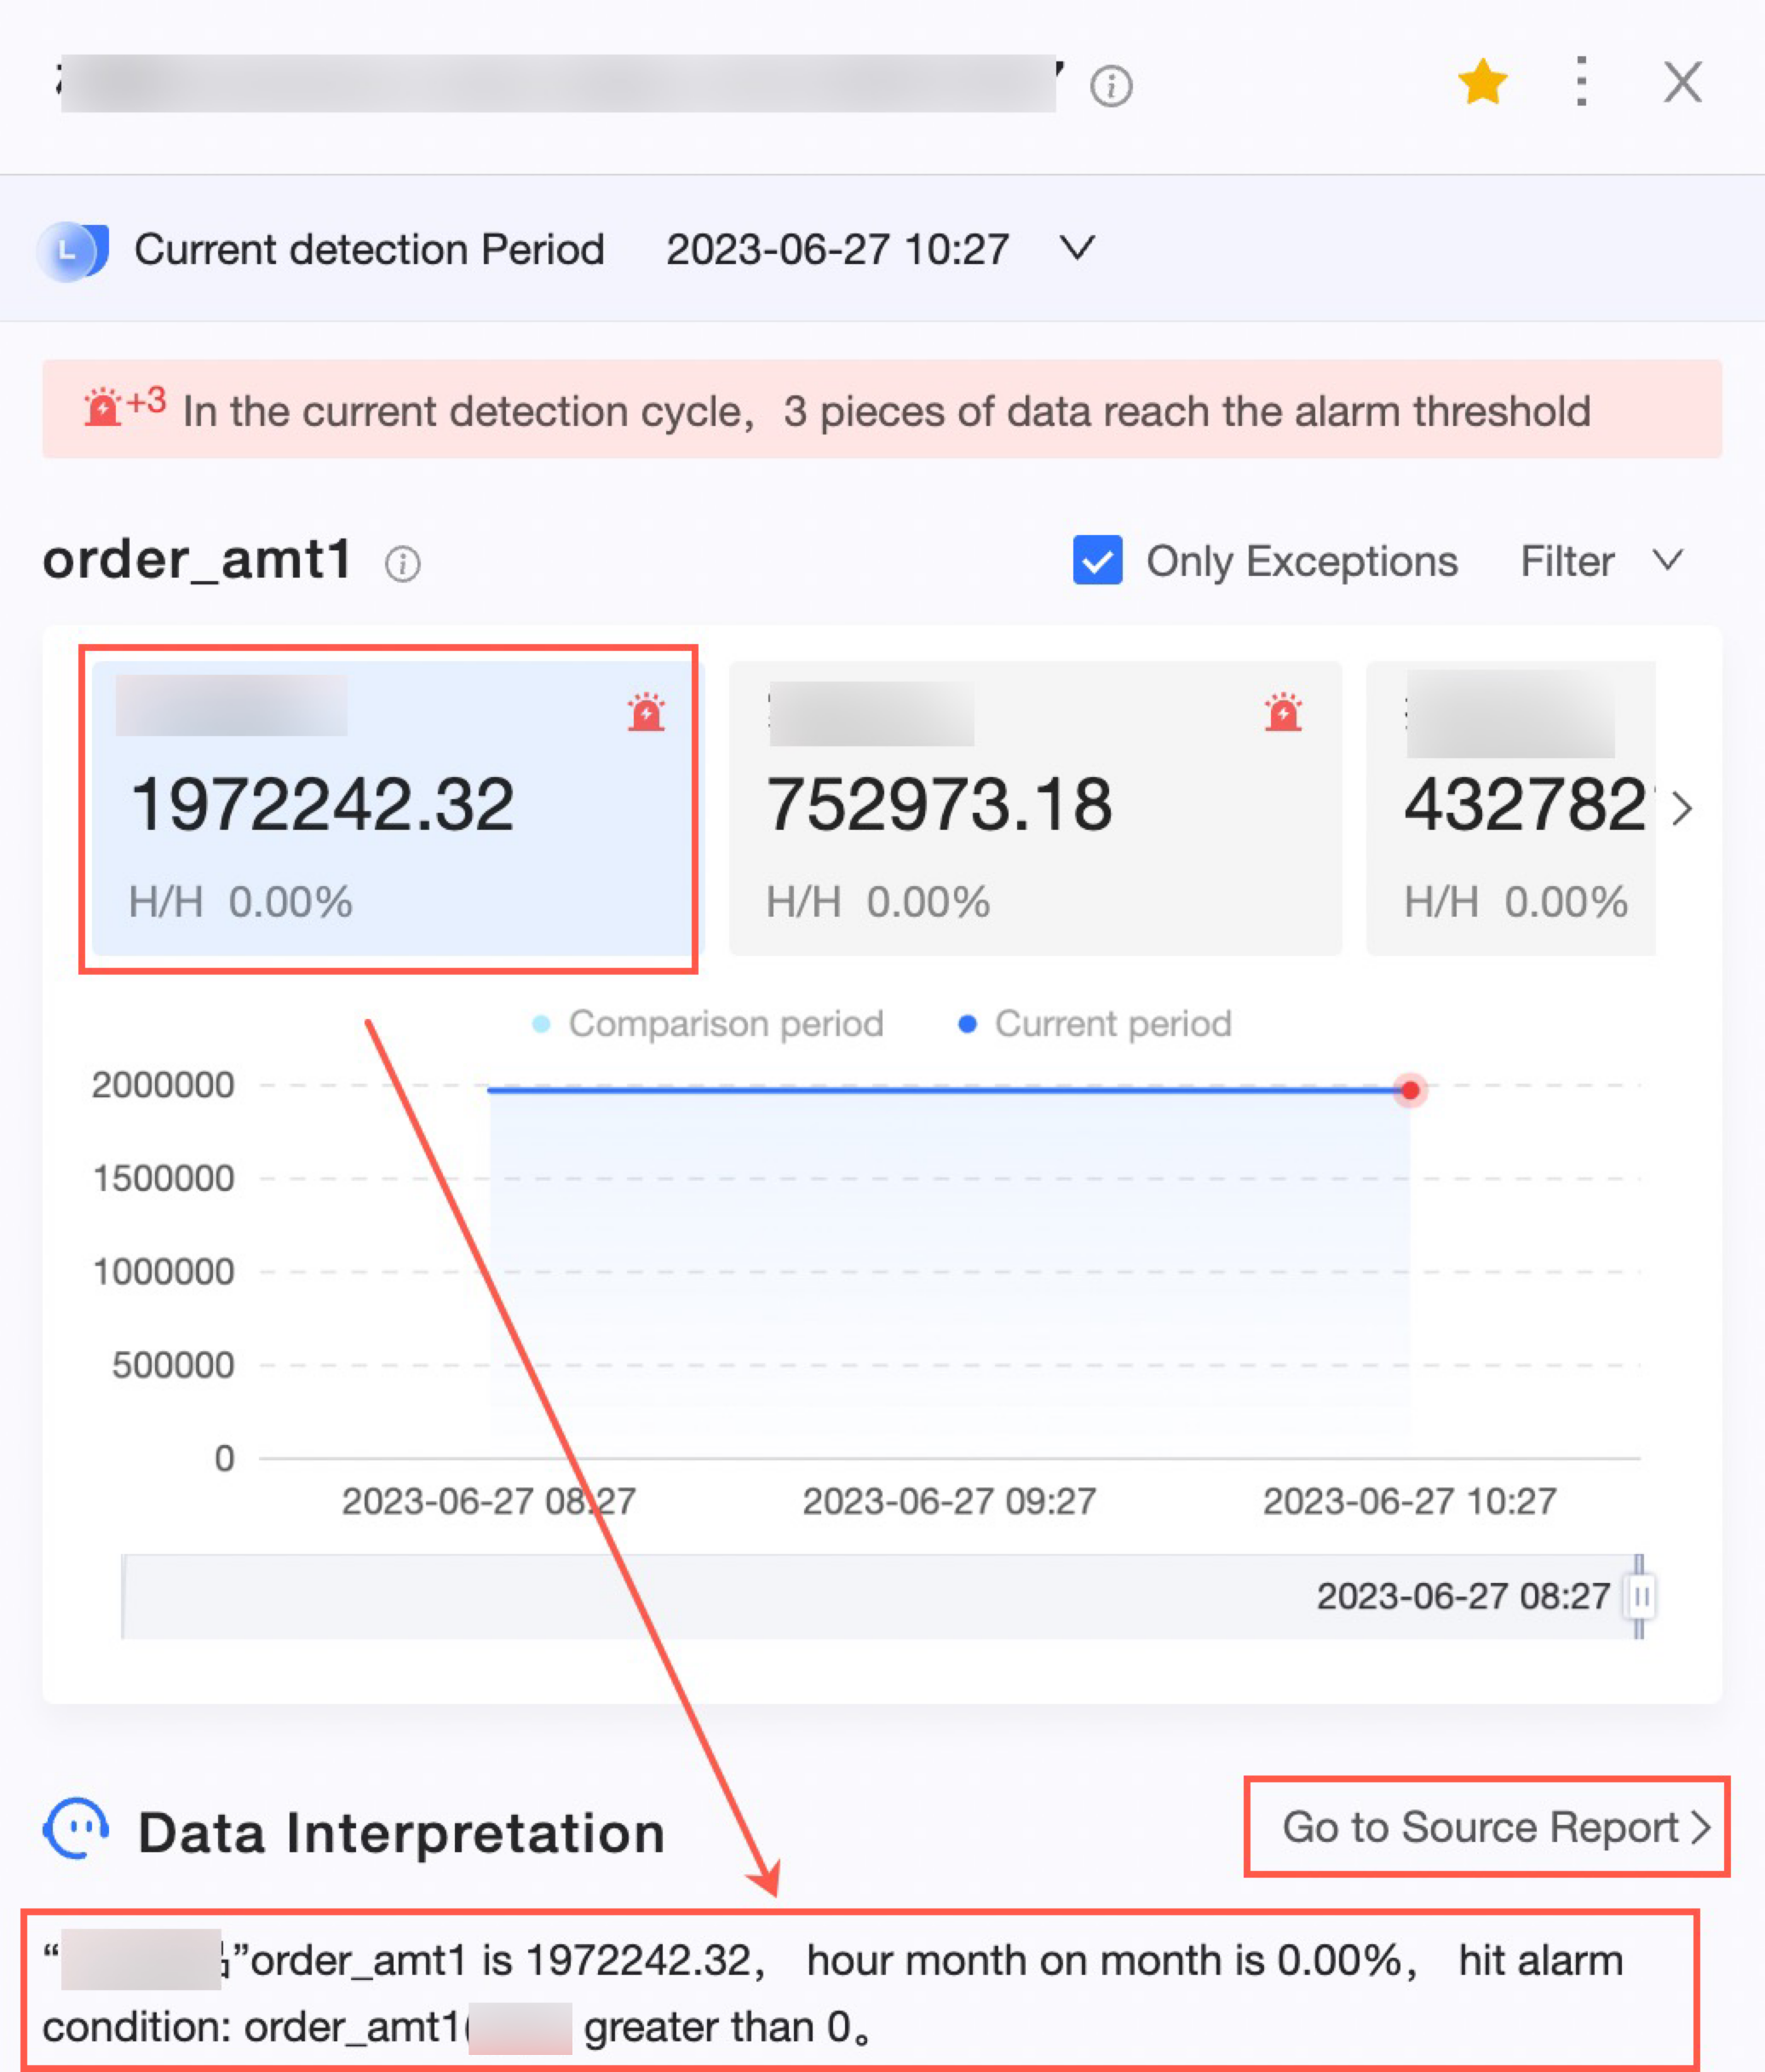
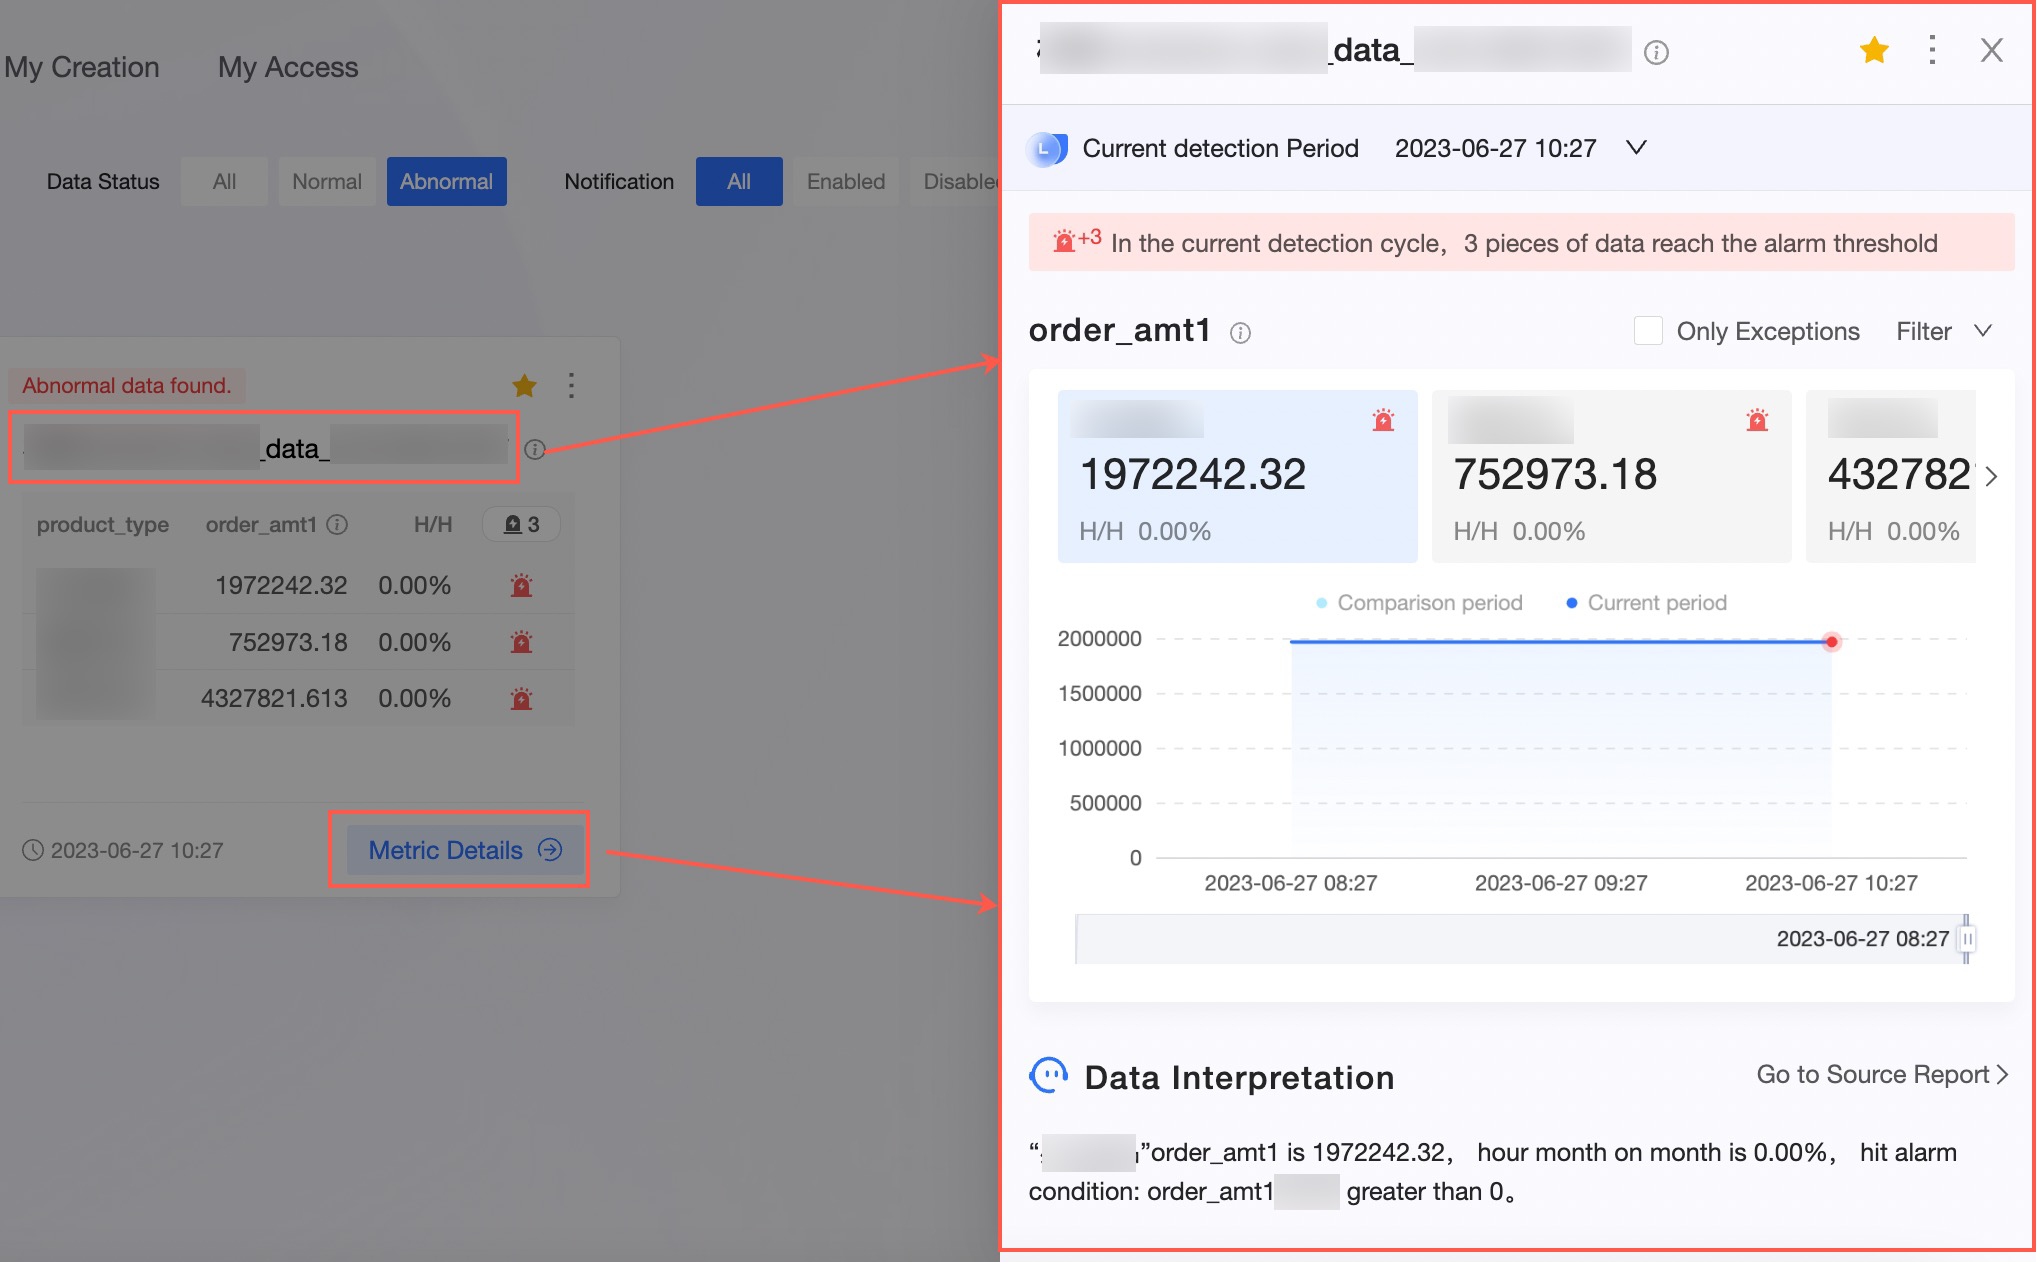
In the metric monitoring center, click the metric name or the metric details button on a metric card to view detailed metric alert information in a pop-up window on the right.
Metric alert overview
The metric alert overview shows detection history, metric anomalies by dimension, and alert trends.
Detection history
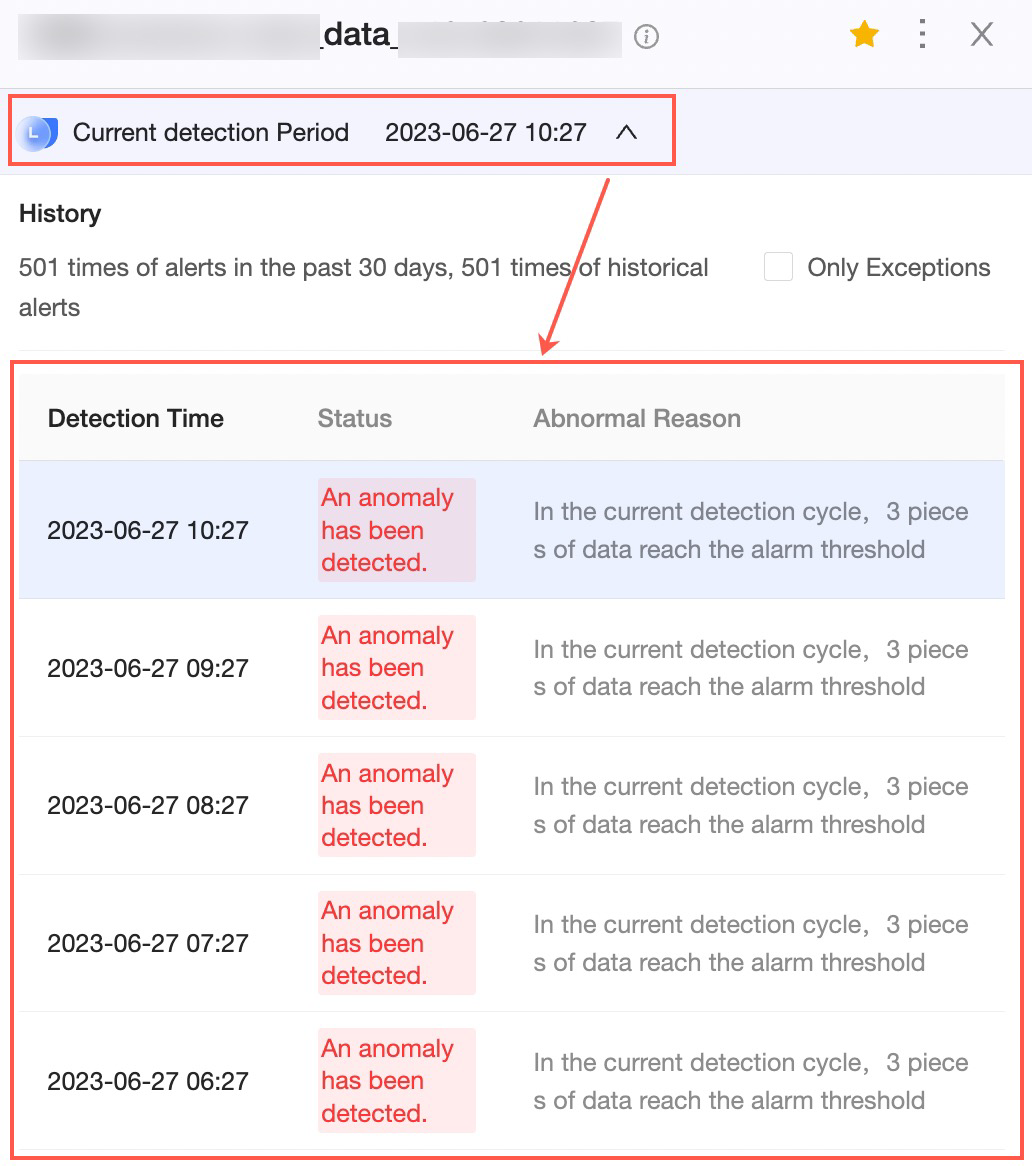
Click the Detection interval  icon next to Detection time to expand the detection history. The list shows the detection status and anomaly reasons for each run. Click a specific detection time to view its anomalous metric data.
Metric anomaly details
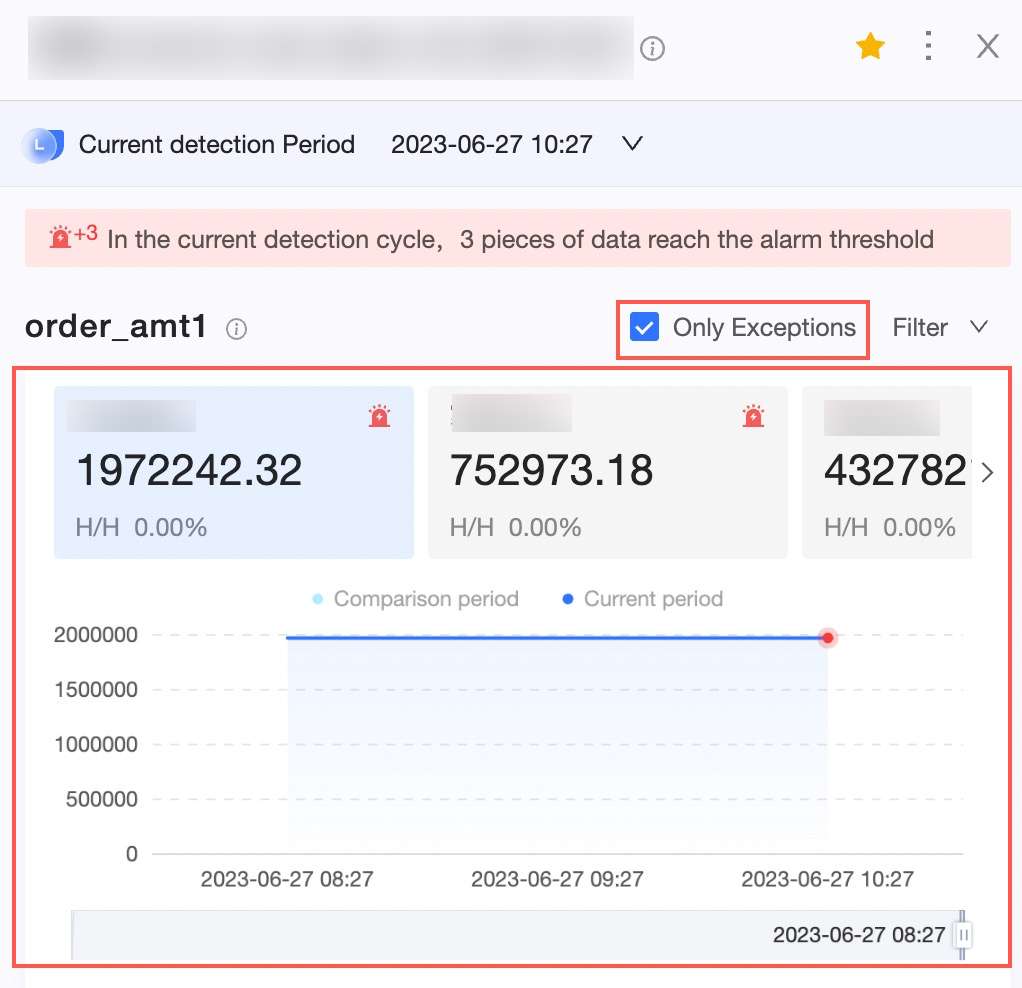
This section shows data details for the monitored metric. If the data is split by dimension, switch between dimensions to compare. Select Only view abnormal in the top-right corner to filter the list to anomalous data points only.
Data interpretation
Click an anomalous data point on the chart to display the reasons for the anomaly in the data interpretation section at the bottom of the page. To open the full report, click Go to source report in the top-right corner.