This topic explains how to configure a filter bar to query data based on a date field.
Prerequisites
You have created a dashboard, and the dashboard chart includes a date field.
You have added an empty filter bar to the dashboard. For more information, see Create a Query Control.
Procedure
You can configure the date filter bar as shown in the figure below.
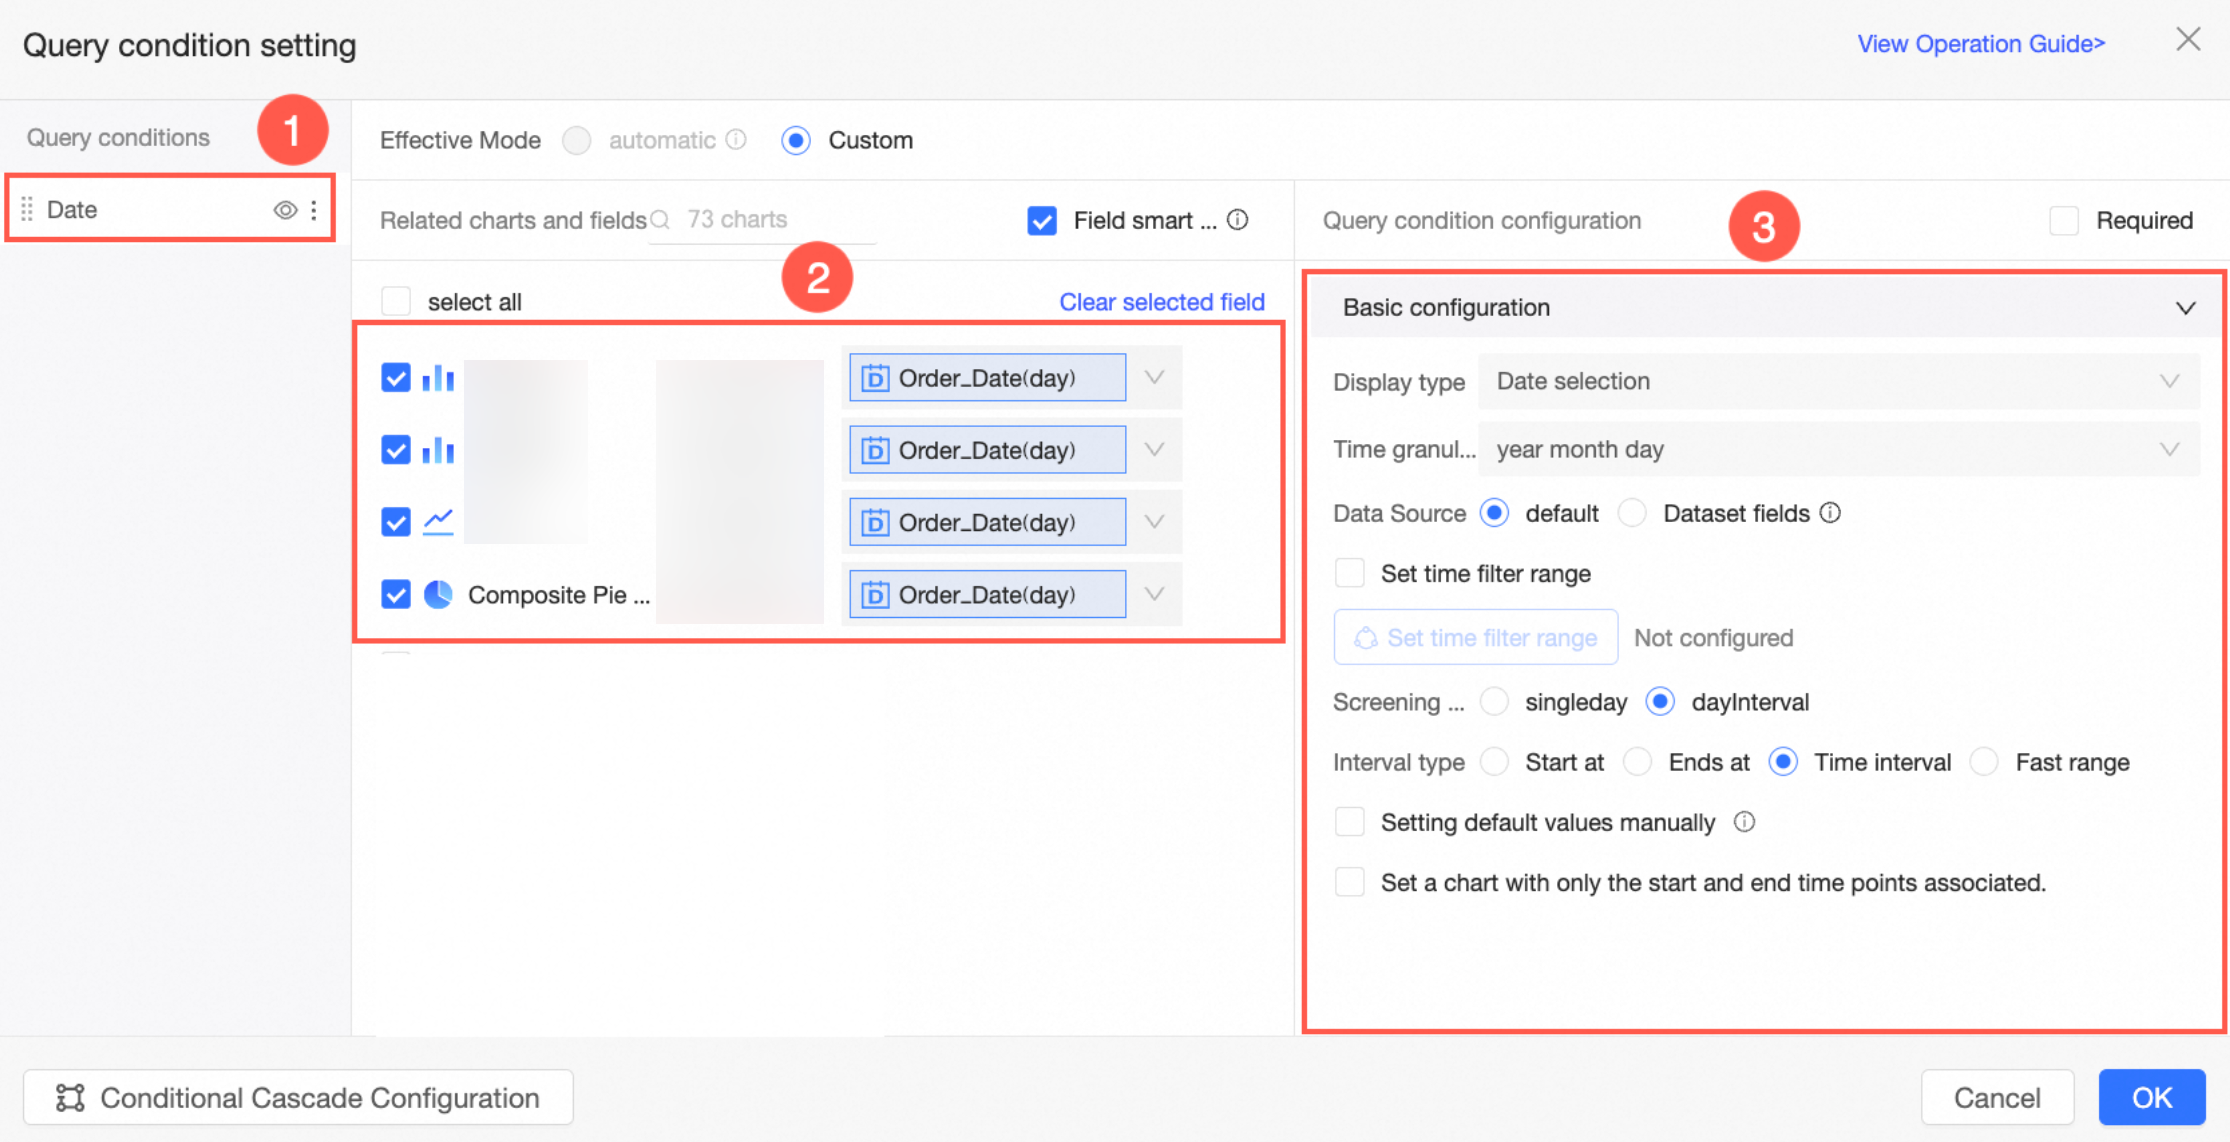
Basic configuration
Display type
The date filter bar supports date selection.
Time granularity
The time granularity matches that of the associated date field. For instance, if the associated date field is a year field, the time granularity is year. If it's a month field, the granularity is year-month. If it's a day field, the granularity is year-month-day.
For a YYYYMMDD HH:MM:SS date field, you can switch time granularities. For details, see the Date Granularity Switching section of this topic.
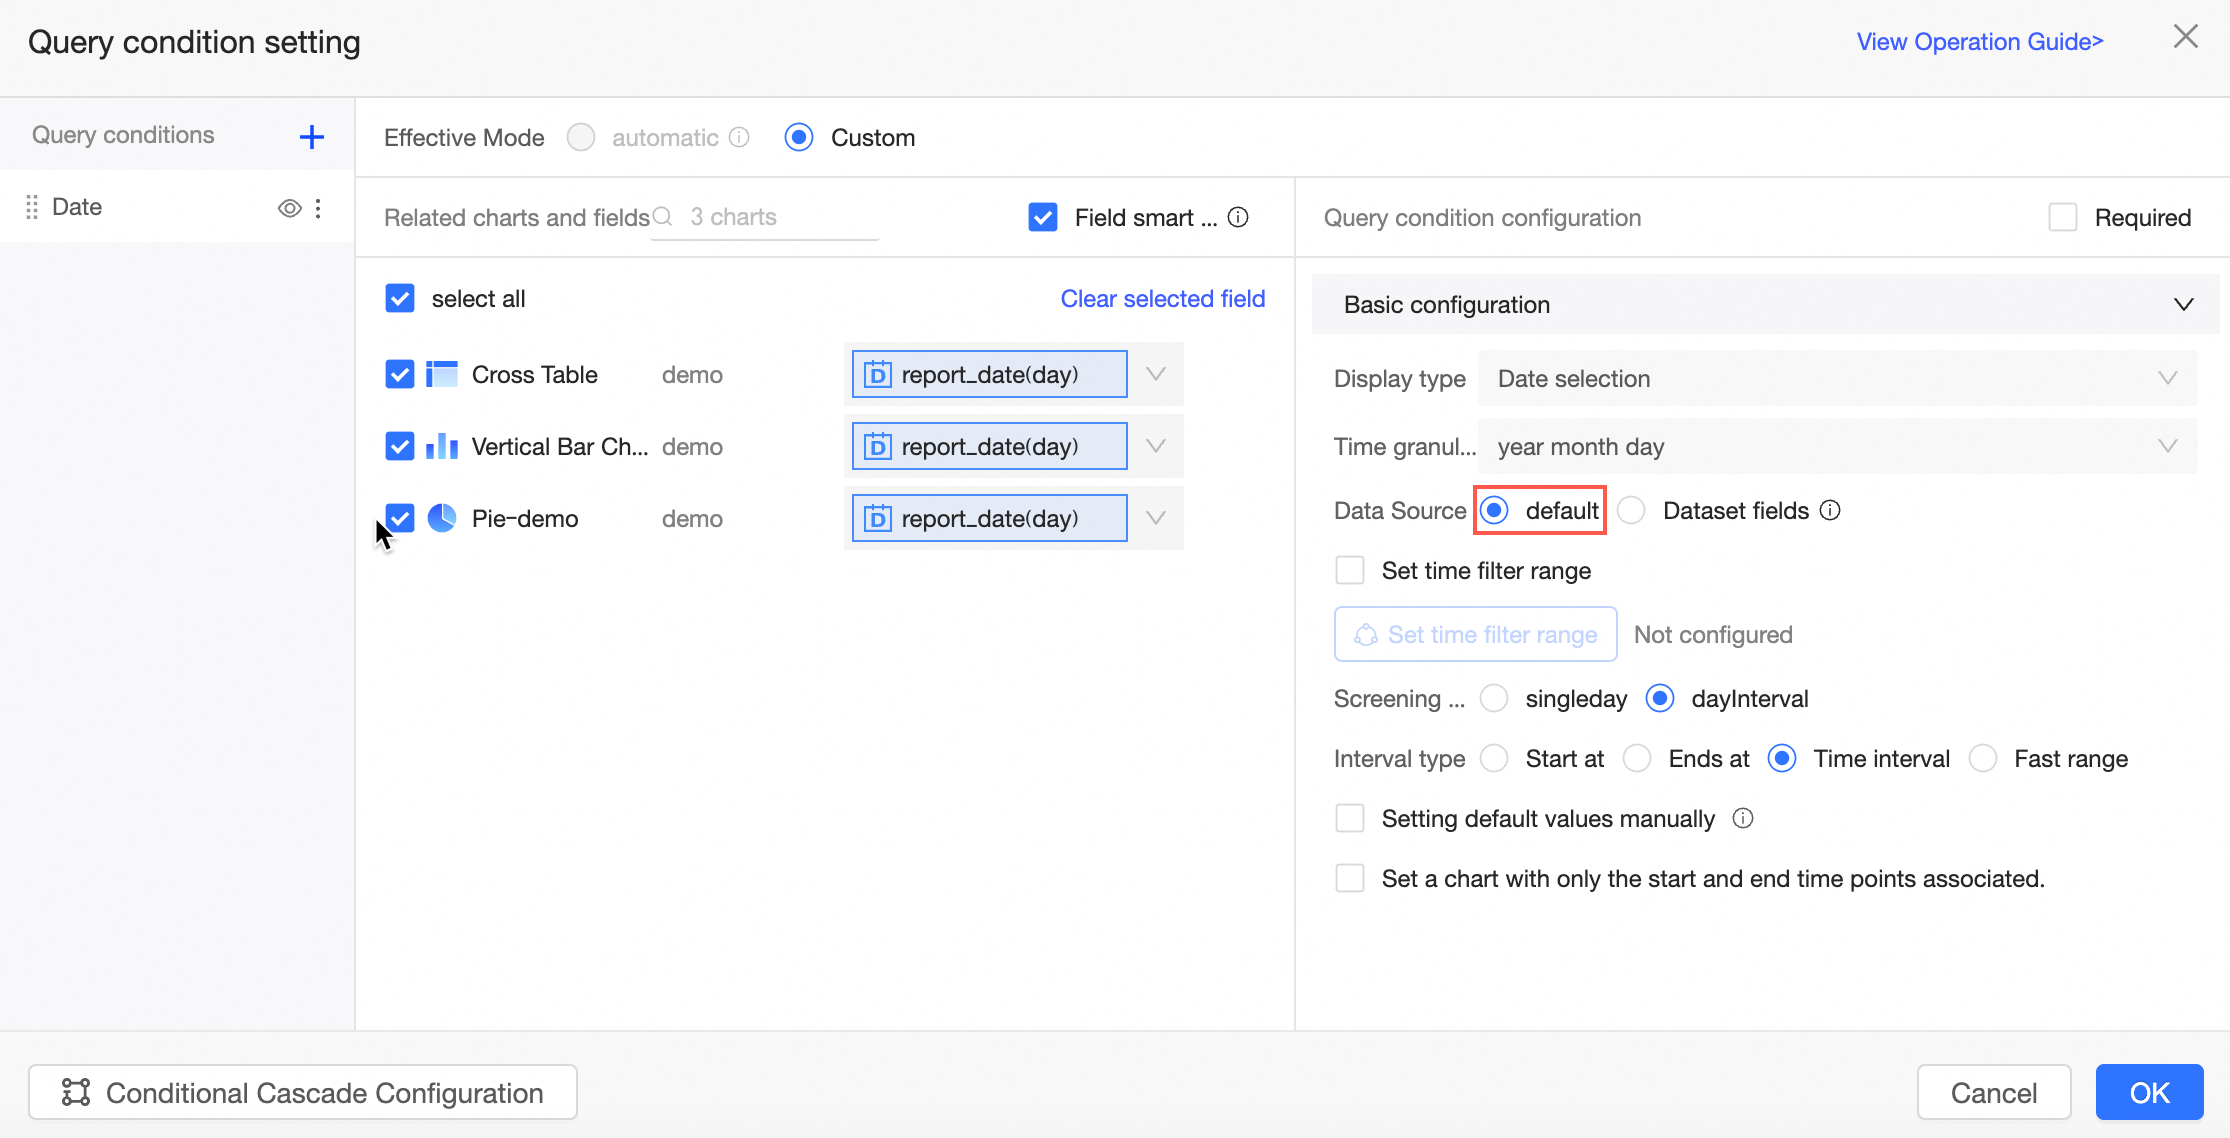
Data source
The filter bar's data source can be either the Default Date Picker or a Dataset Field. The default date picker supports date cascade, while the dataset field option supports same-source cascade, non-same-source cascade, and date cascade.
Default Date Picker
There is no data source. It only supports date cascade, not cascading with other controls.
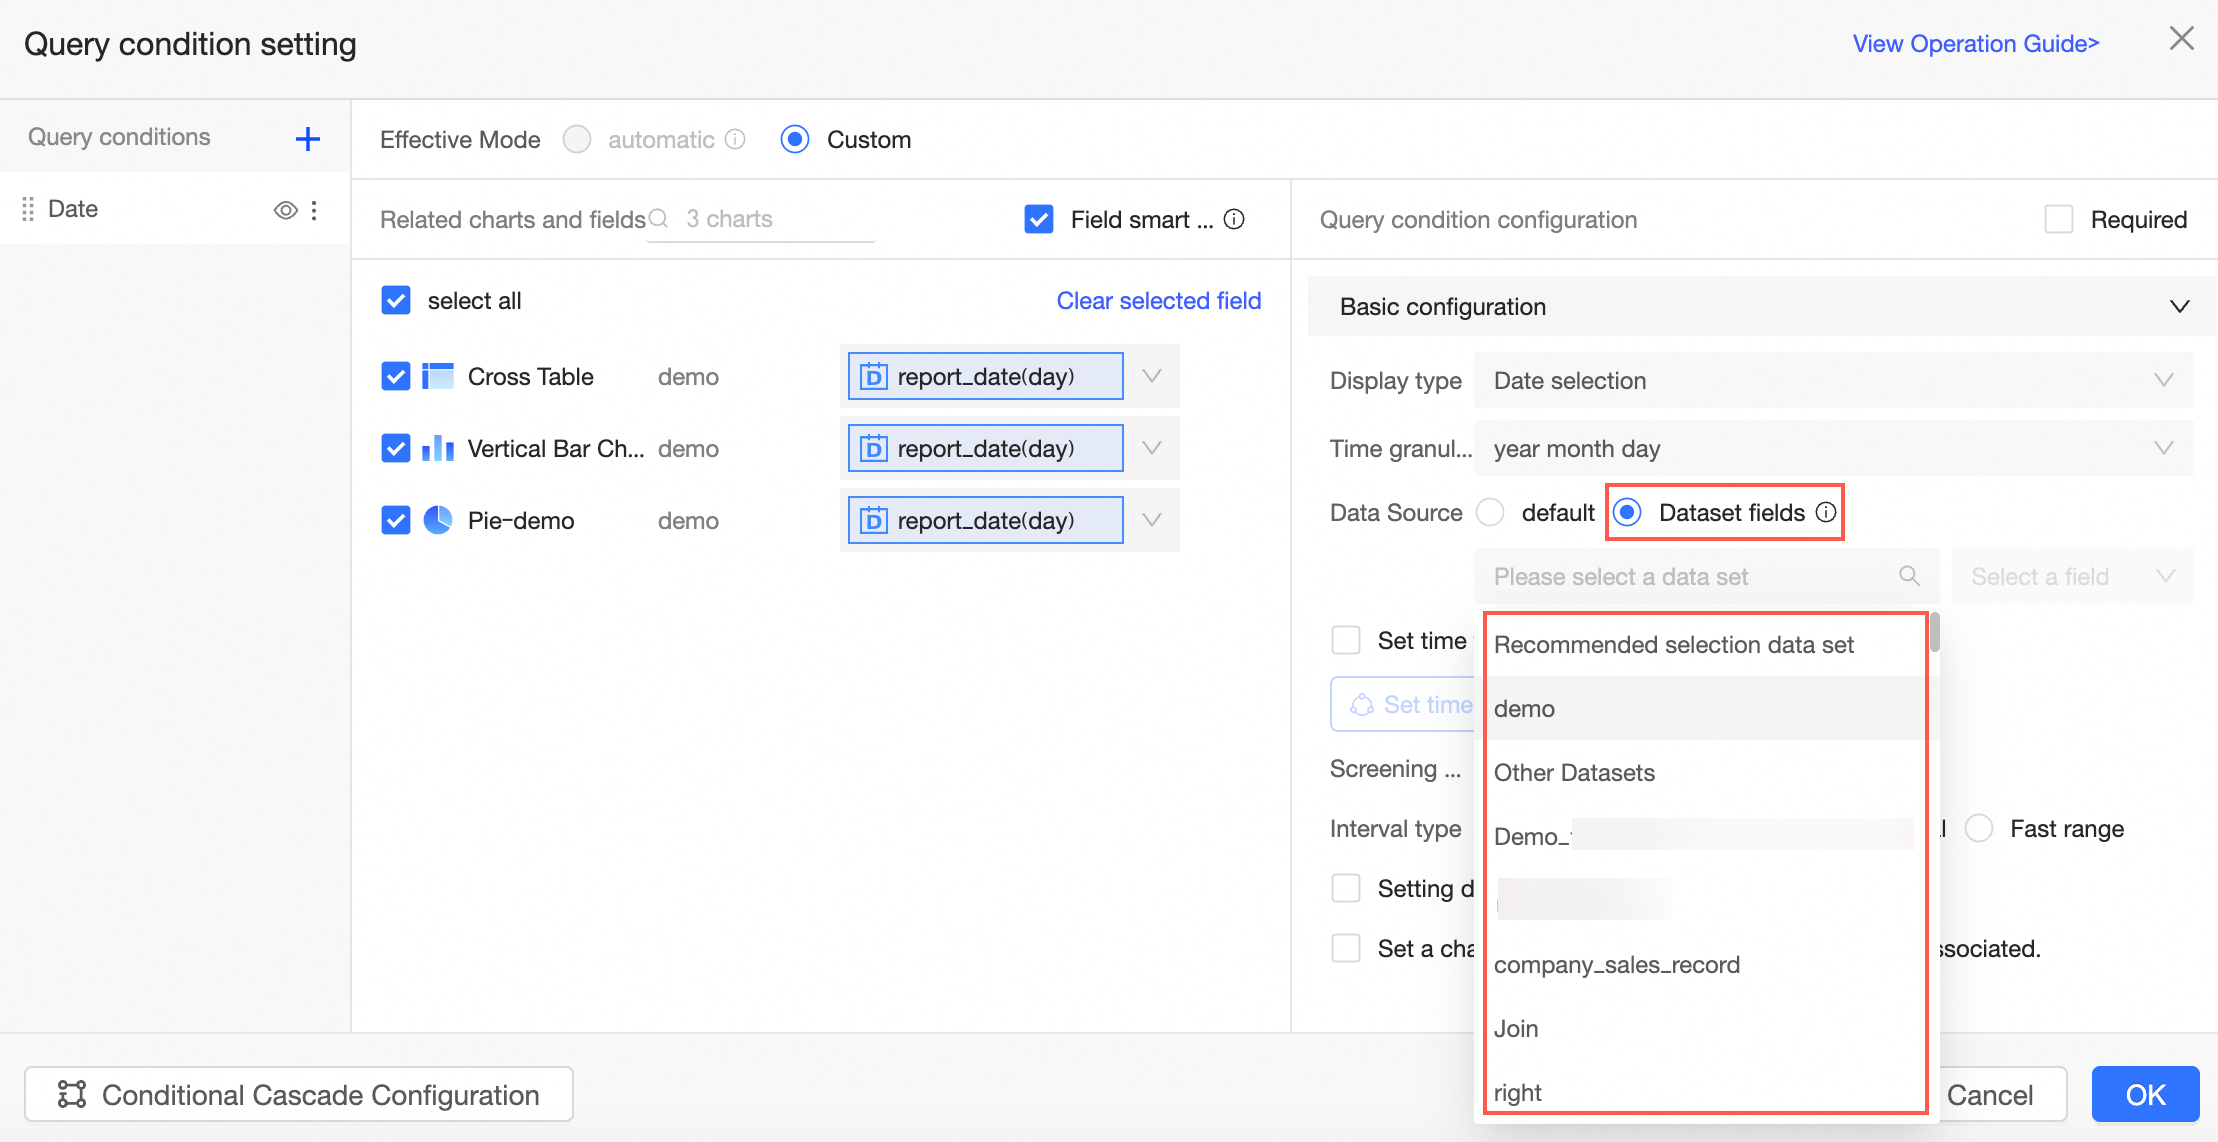
Dataset Field
Select a dataset as the data source. This supports date cascade along with cascading with dropdown and tree controls.
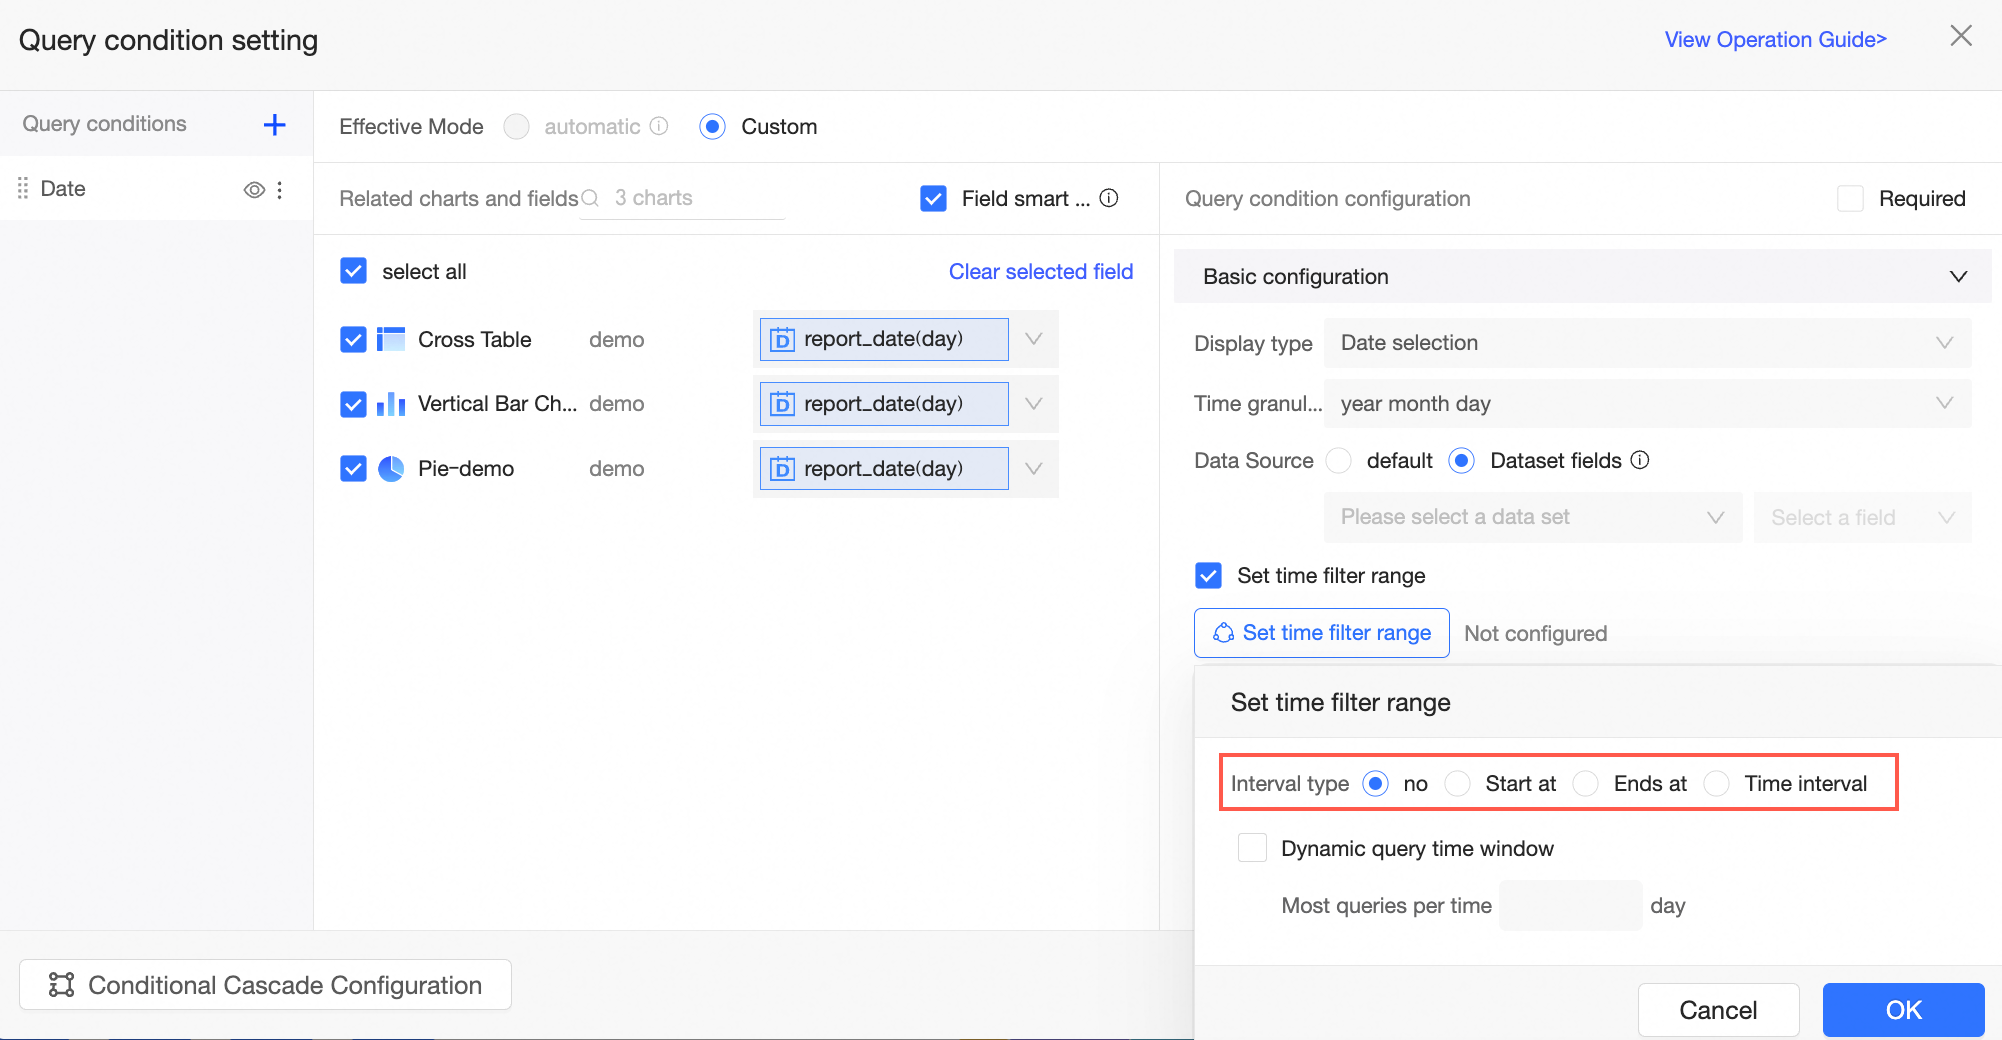
Set time filter range
By setting the time filter range, you control the volume of data filtered for the query. Once set, you cannot select times outside this range.
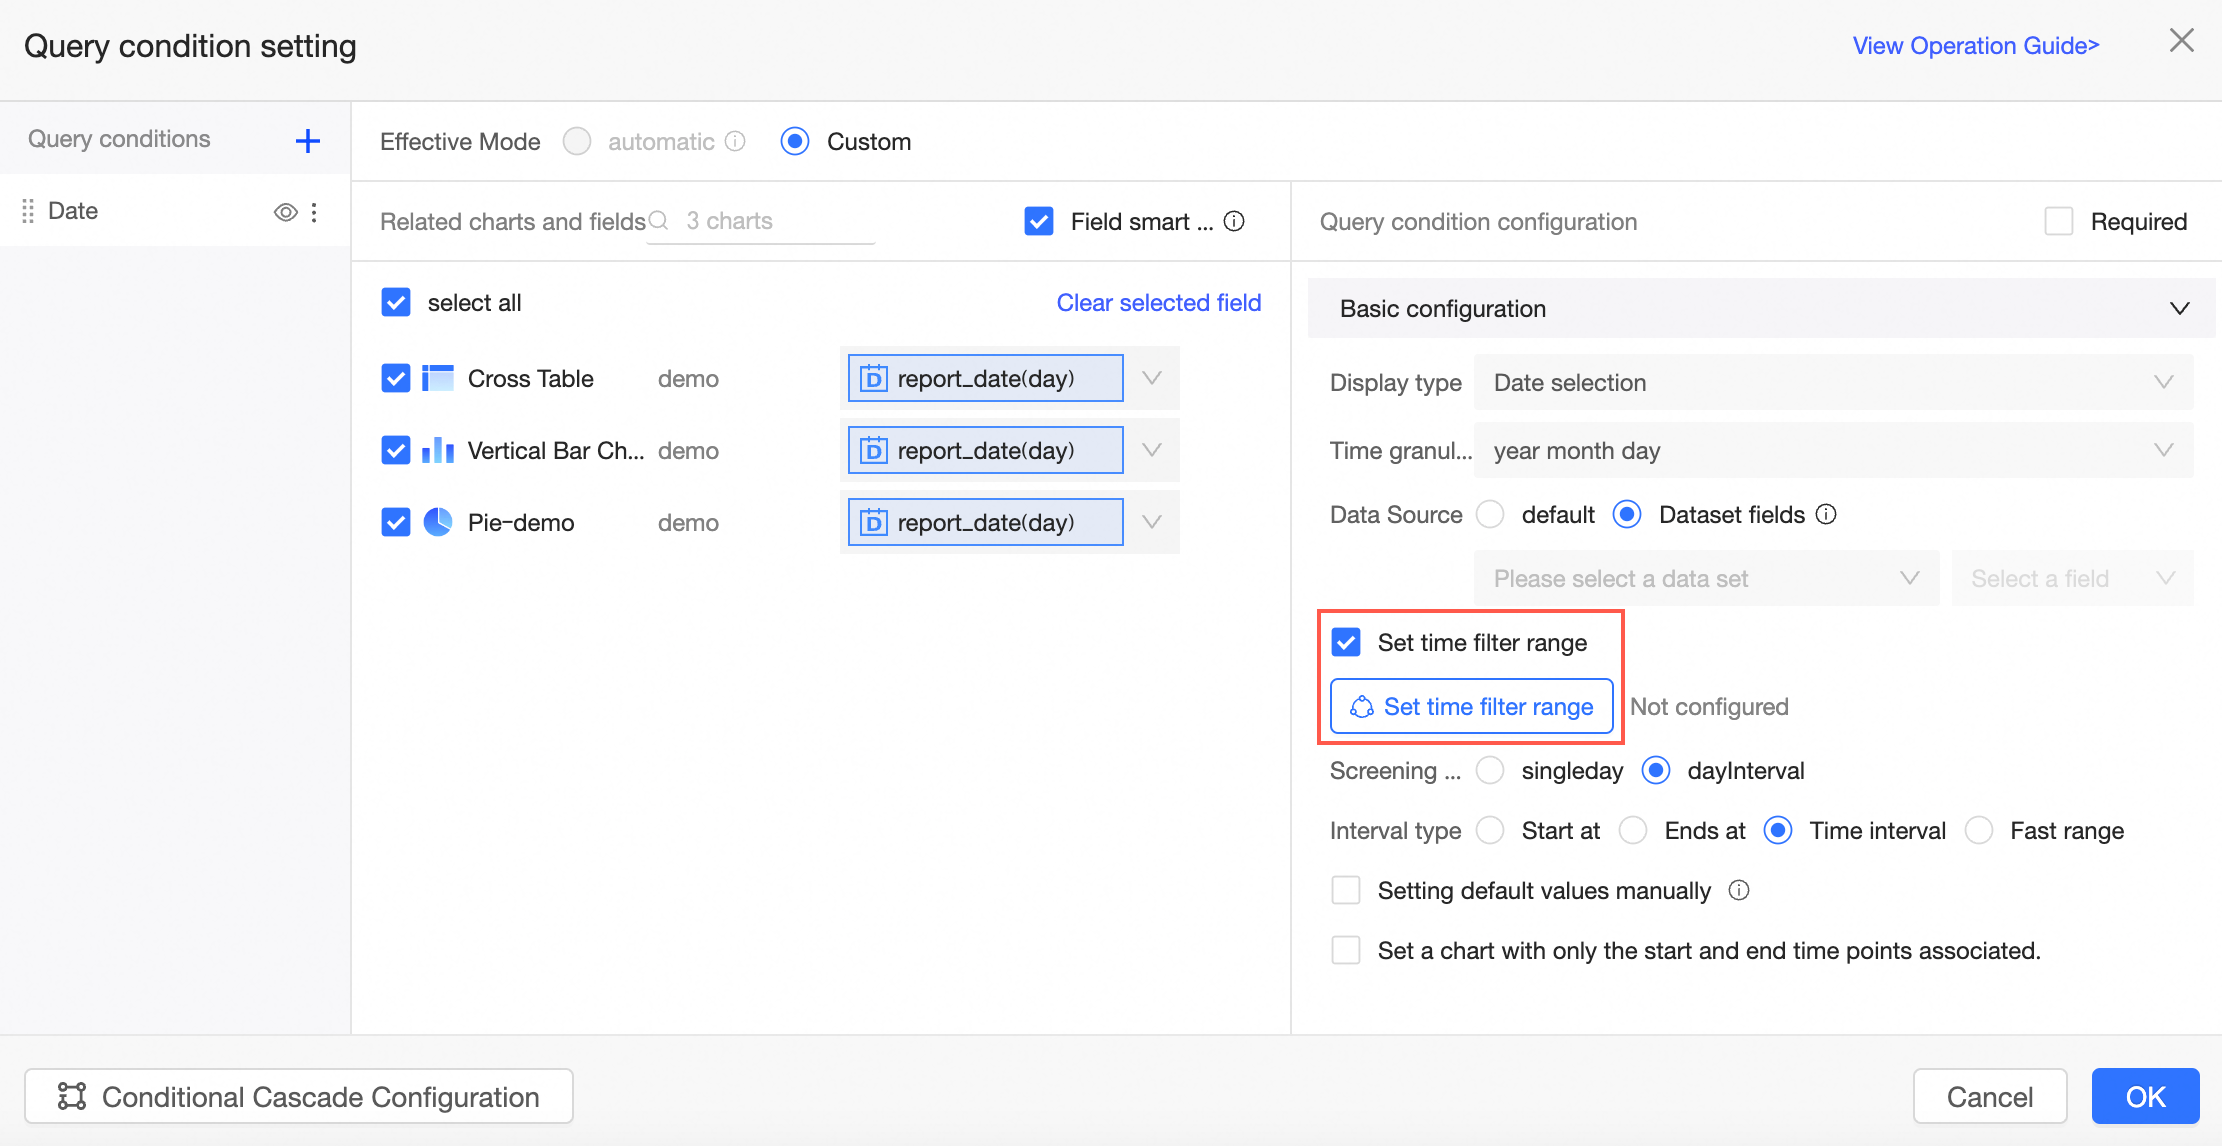
The default Interval Type is None. It also supports Start at, End at, and Time interval options.
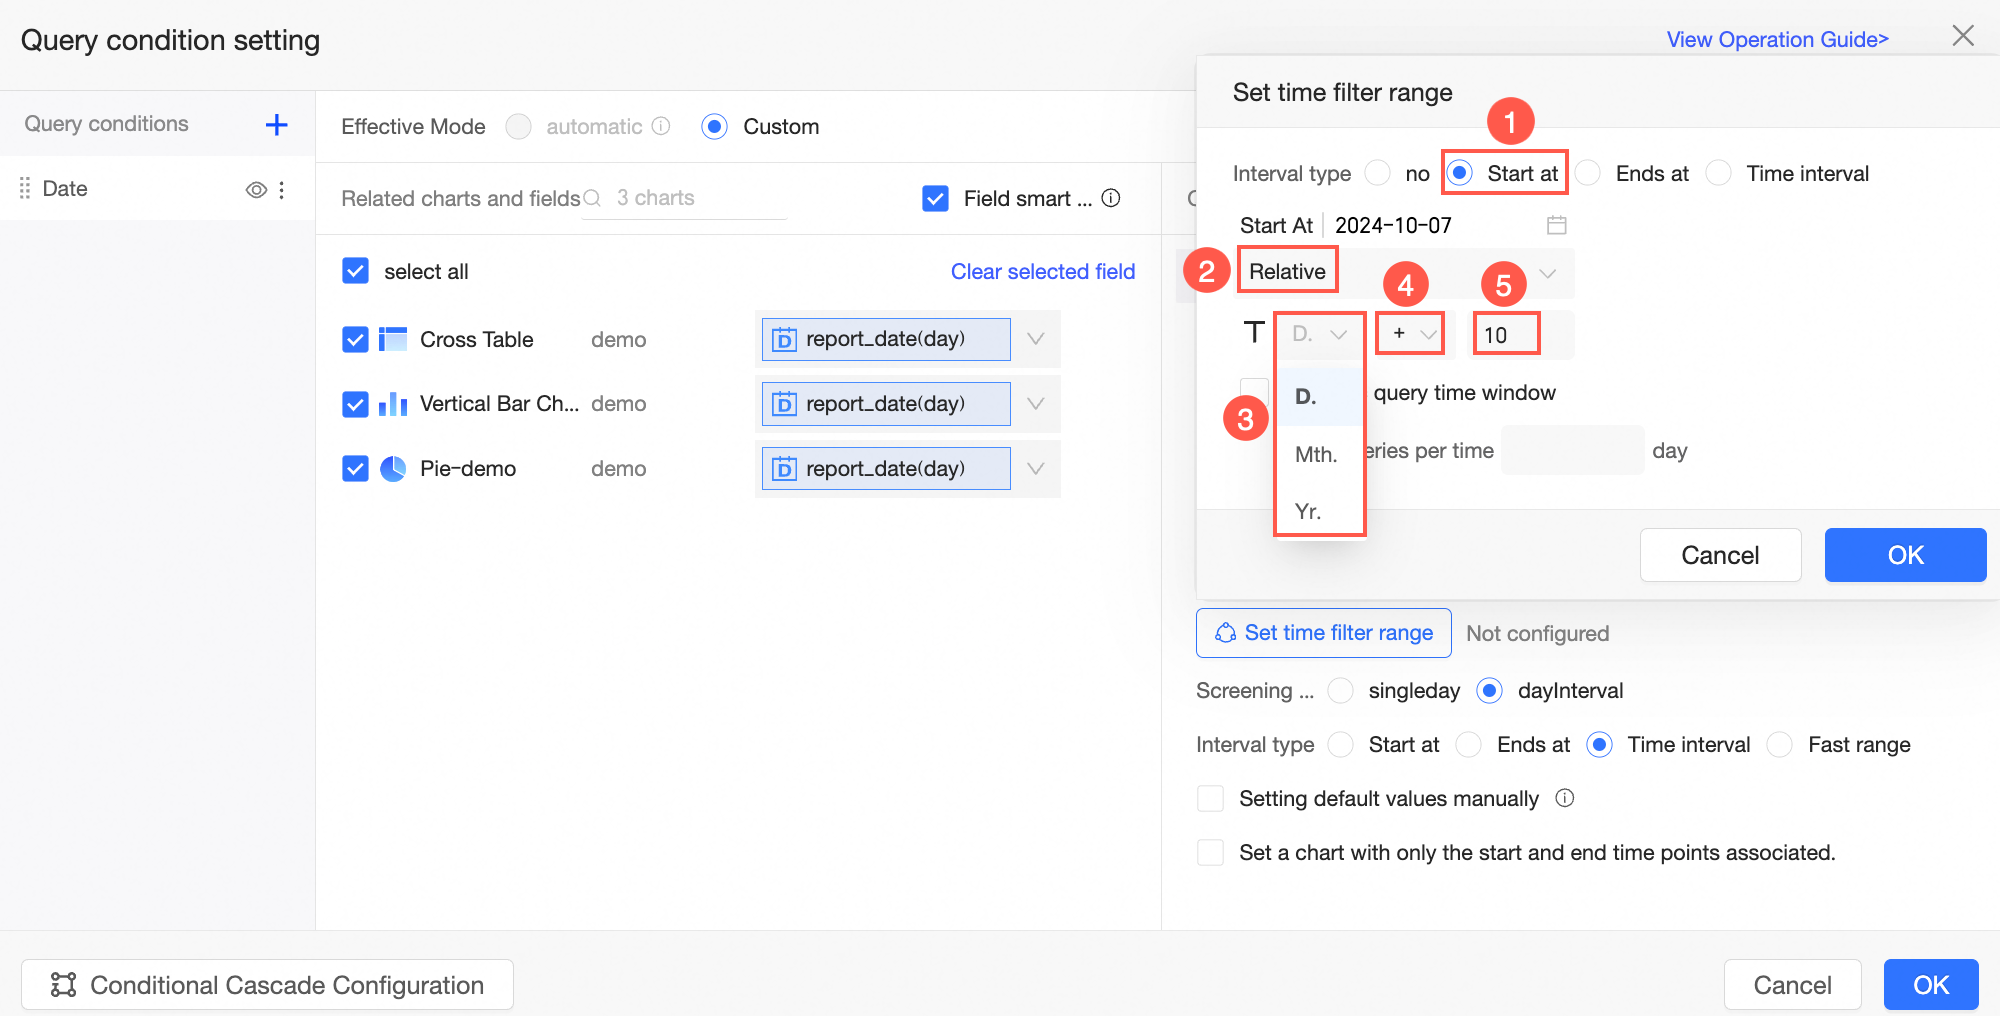
For example, using Start at as the Interval Type, you can set the Relative Time range as shown below.
 Note
NoteThe granularity selection of T allows dropdown selection of all granularities included in the current time granularity. For instance, if the current granularity is year-month-day, you can switch to year, month, or day. If it's year-month-day-hour-minute-second, you can select down to the second.
Applicable scenarios for this feature include instances where the time granularity is YYYYMMDD HH:MM:SS, and there's a need to switch the relative time in seconds. If the granularity is solely in seconds, determining the number of seconds required can be tedious. To simplify, you can switch to daily granularity for a swift overview of time data across various dates.
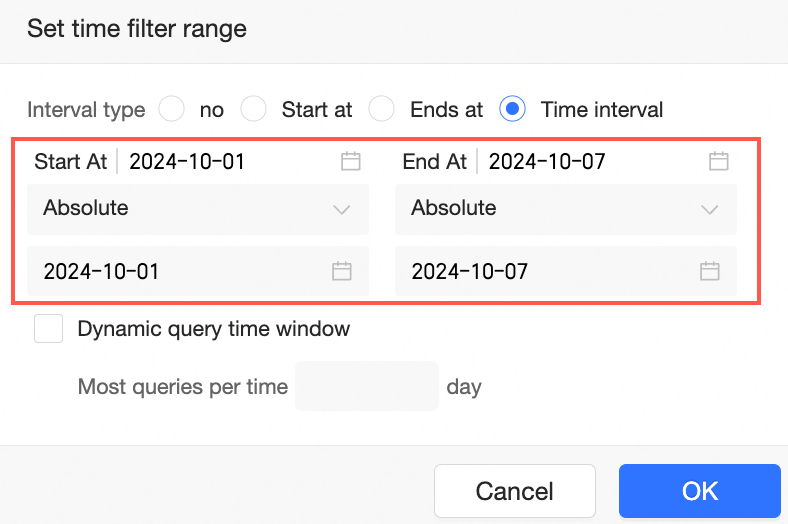
Here's an example of setting the Exact Time range using Start at as the Interval Type.
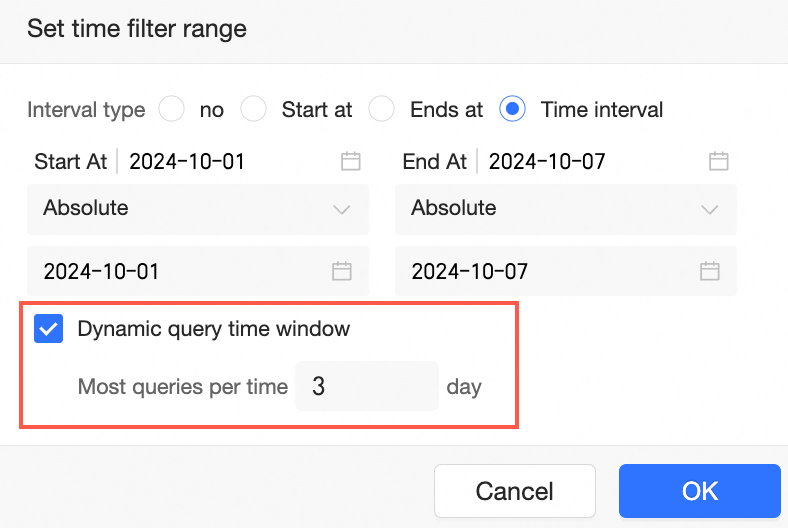
Selecting Dynamic Query Time Window and setting the time amount for Maximum Query Per Time limits the maximum query time within the set range.
Filter method
Supports filtering by single day or day interval. For configuration details and effects, refer to the Single Date Query and Date Interval Query sections of this topic.
Set default value
You can establish the default value using either Manual setting or Dynamic function.
You can manually set the default value for relative or exact time.
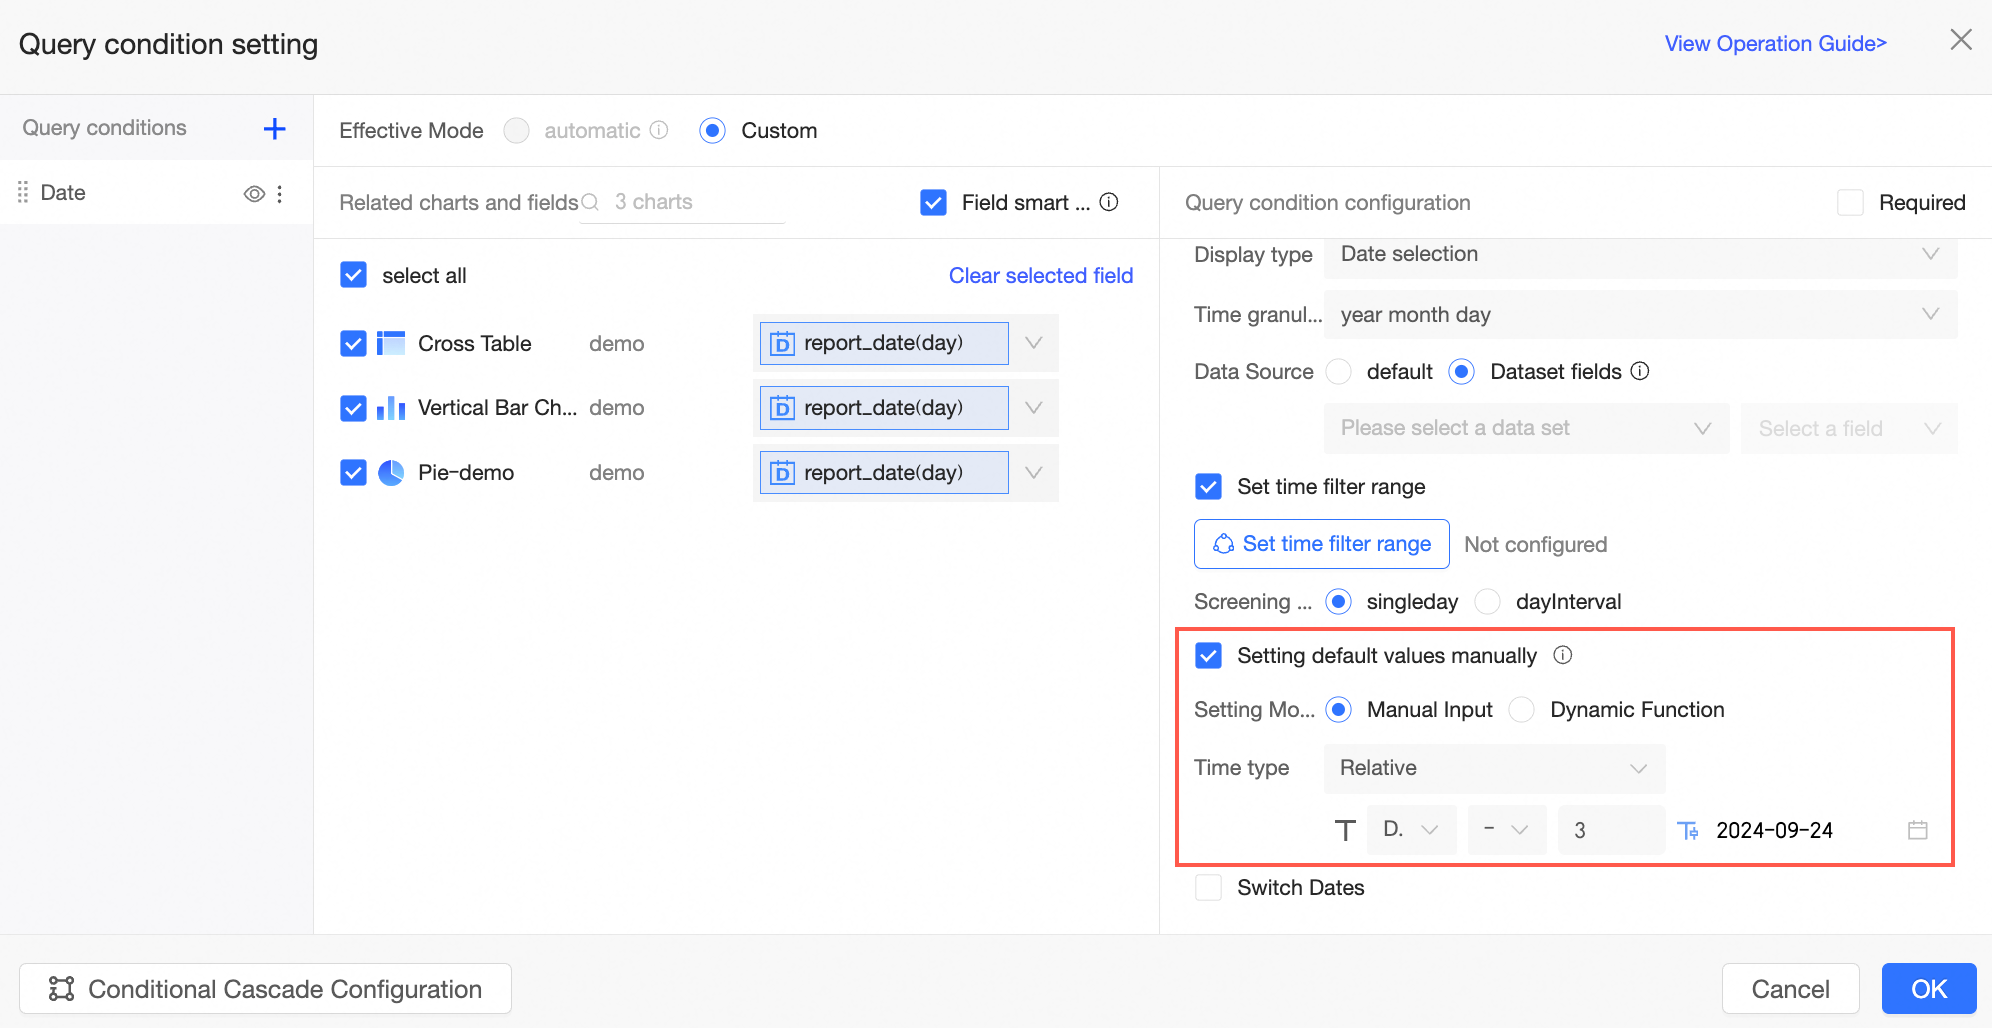
If data for the current or previous day isn't generated, you can't accurately select a date using relative or absolute time. Instead, use dynamic functions to retrieve the date when data is generated.
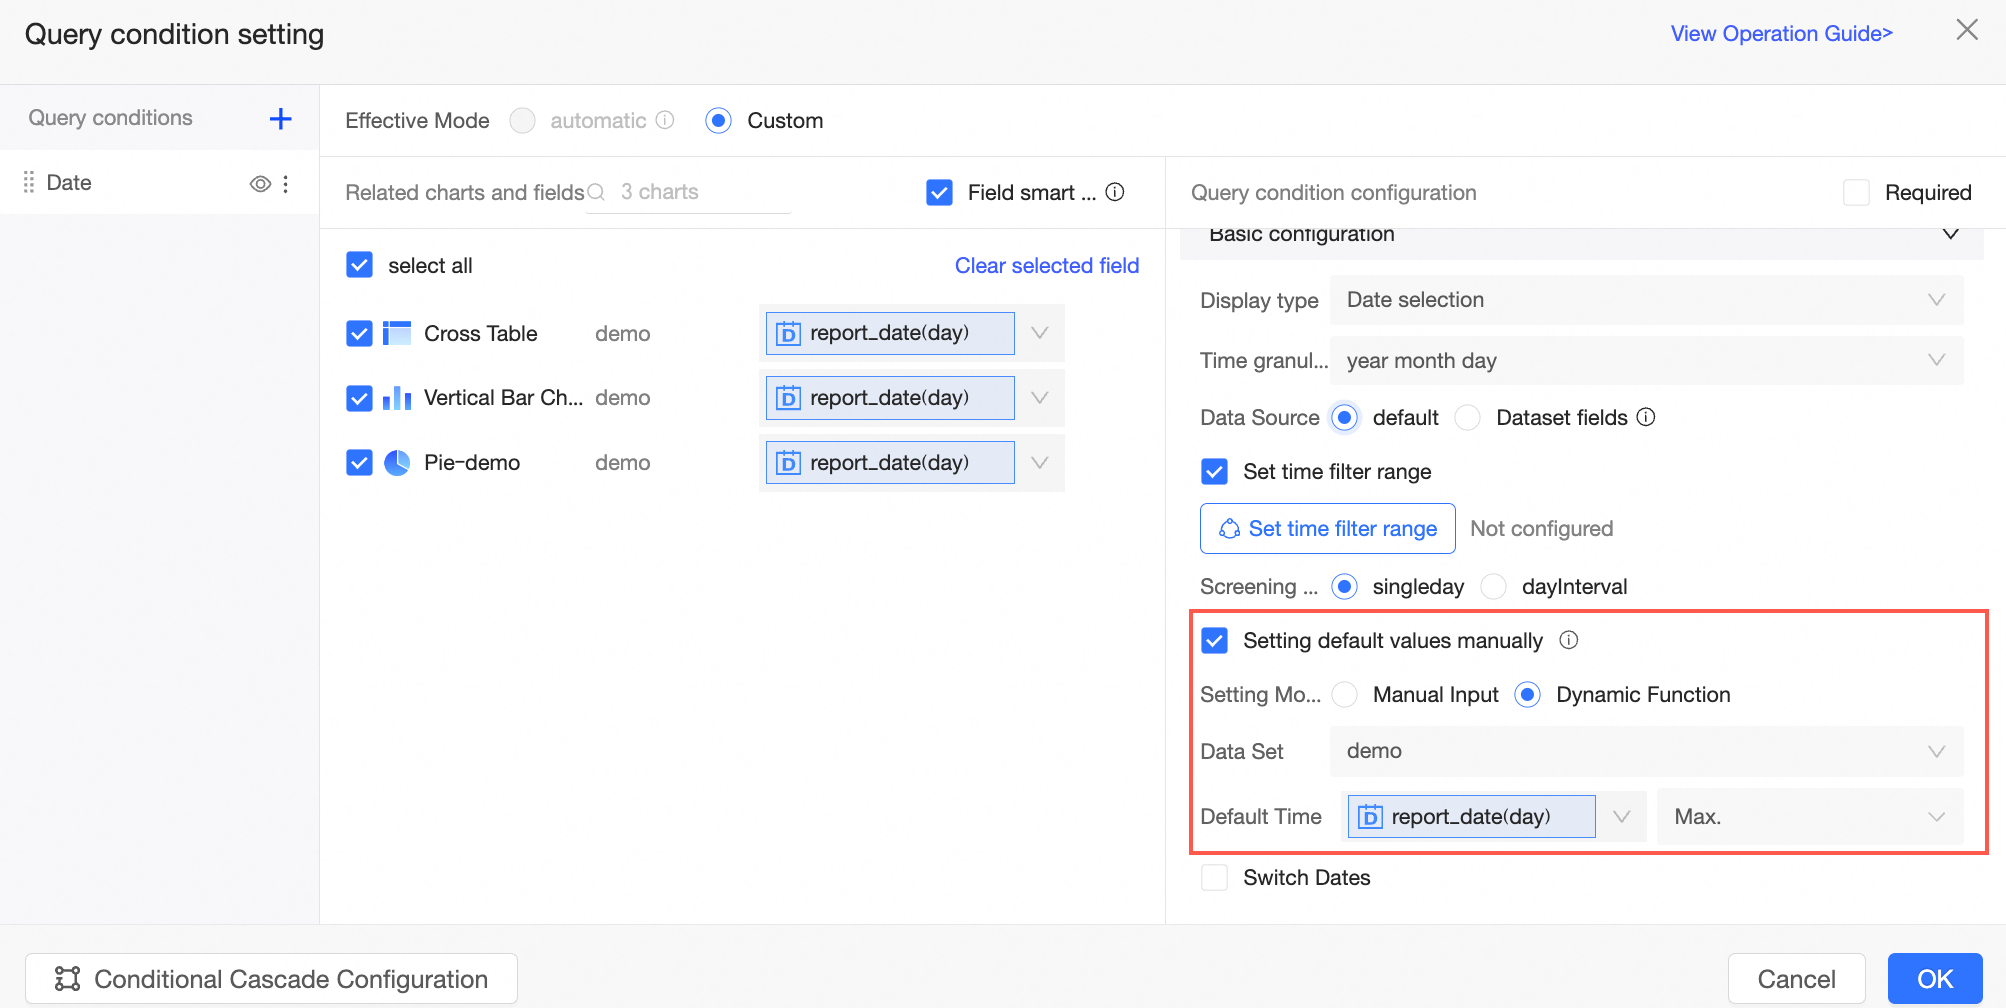
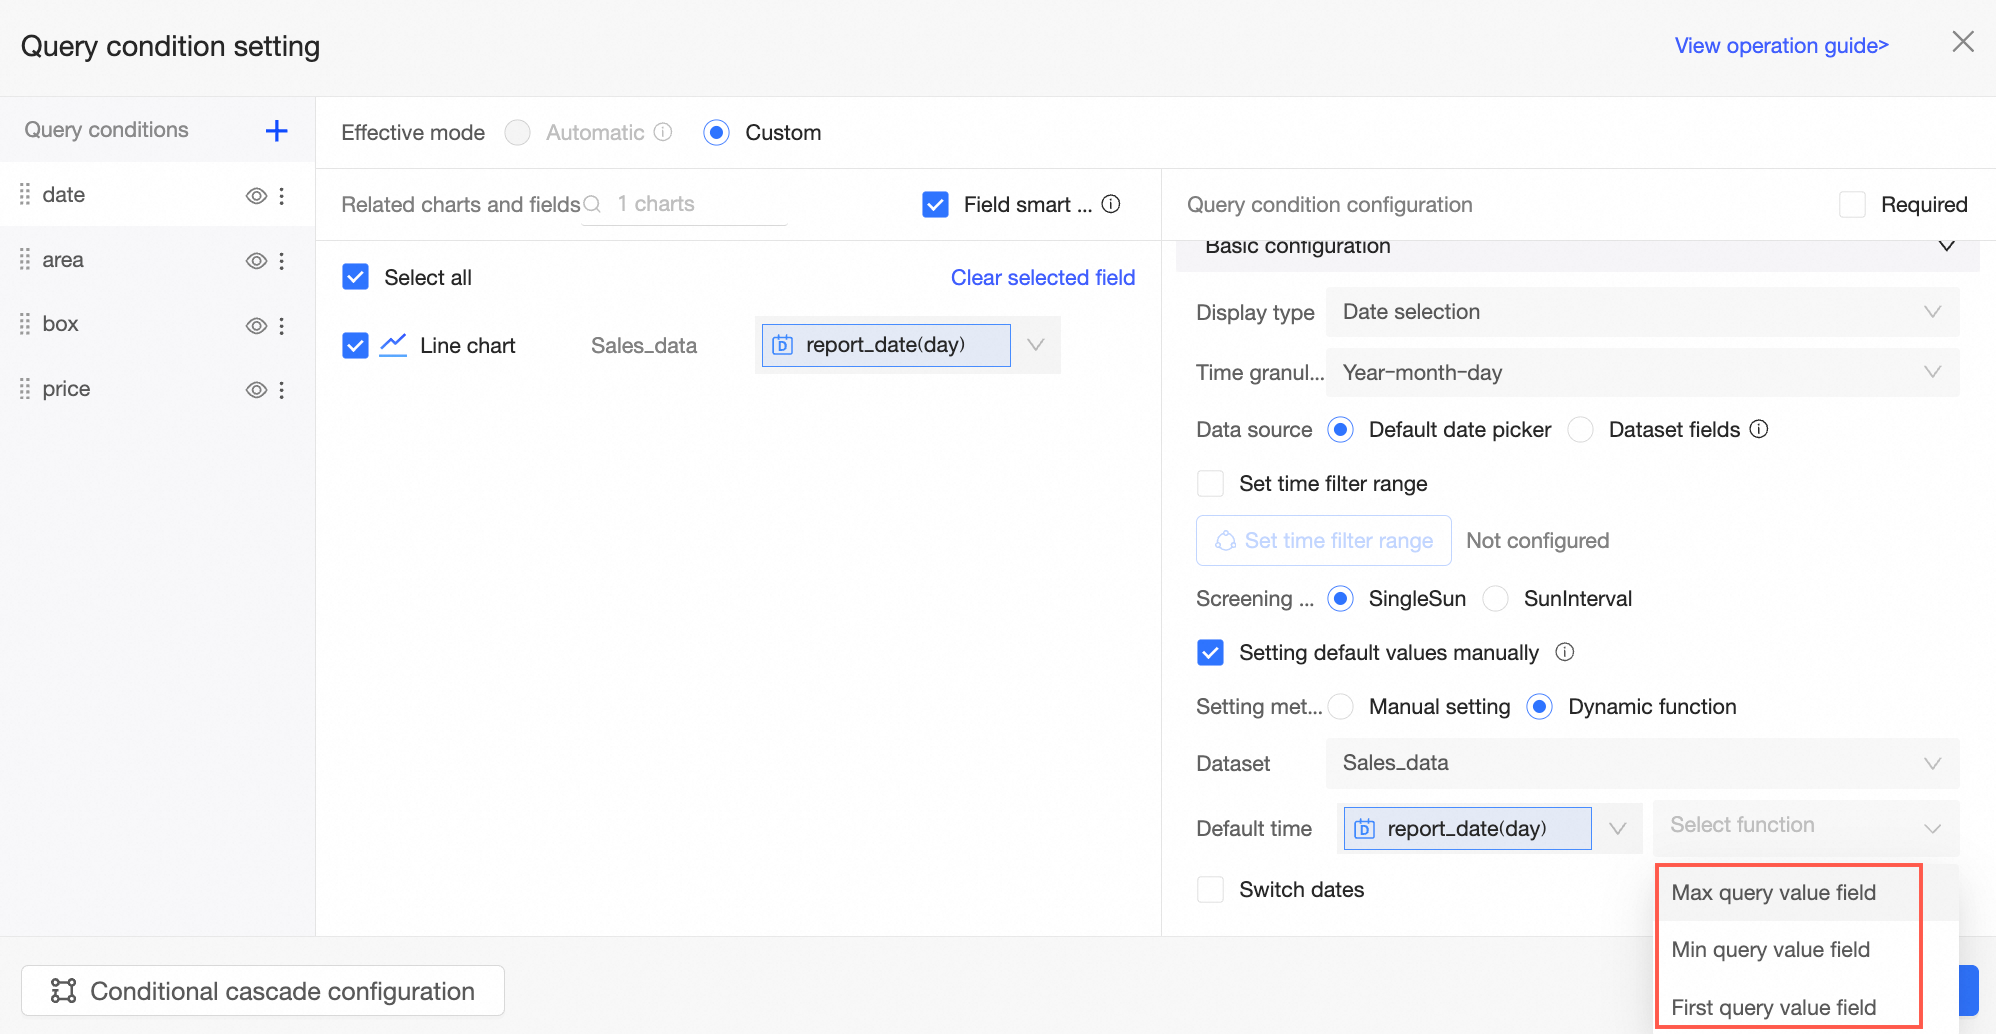
When the filter method is set to Single Day, the default time can be set to Maximum Value of Query Field, Minimum Value of Query Field, or First Item of Query Field.
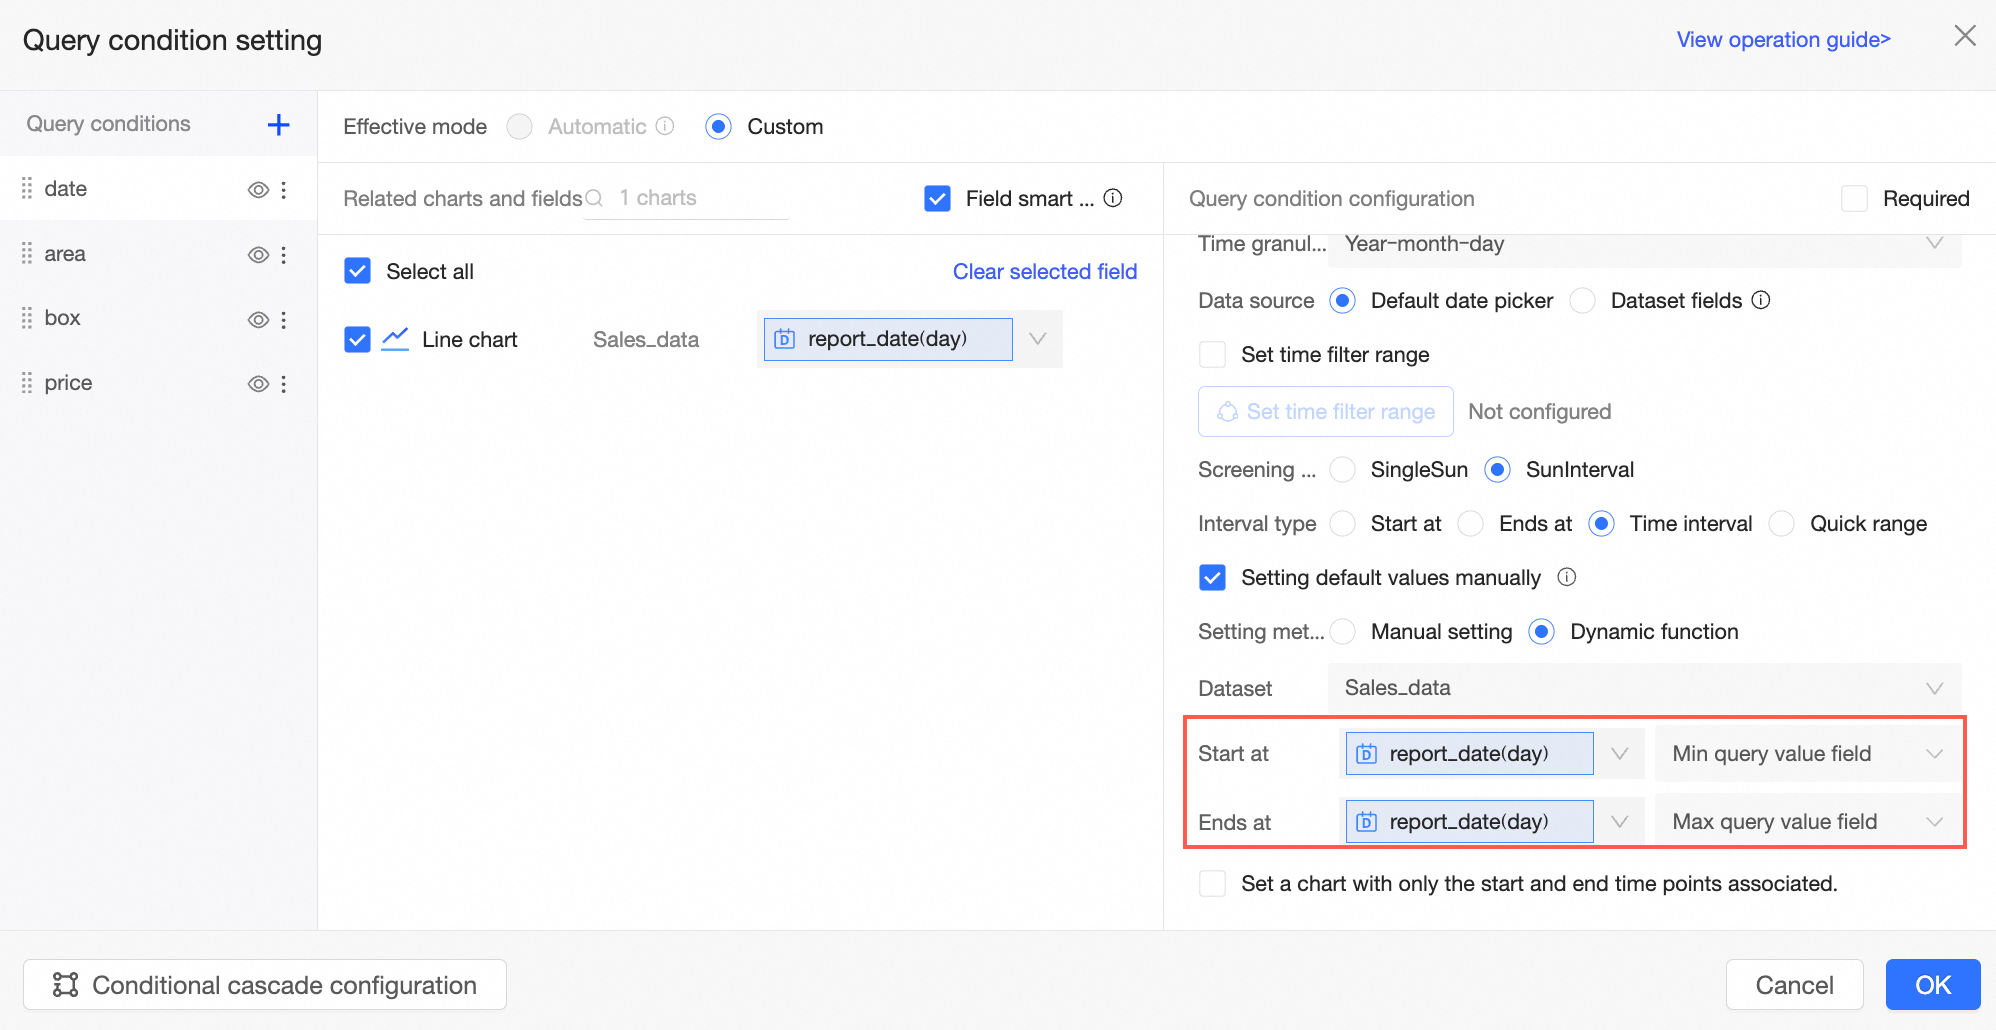
When the filter method is set to Interval (such as day interval, month interval, etc.) and the interval type is set to Start at, End at, or Time interval, the default time can be set to start at or end at the Minimum Value of Query Field or Maximum Value of Query Field.
NoteYou can set only Start at or End at. When both Start Time and End Time are set, the start time cannot be later than the end time.
Enable quick date switching
Once enabled, a quick switch is added to the date filter box on the report page.
If the time granularity is set to year, quarter, month, week, or day and the Screening method is singleday, you can use the Switch Dates feature.
When Filter Method is set to Single Day and Enable Quick Date Switching is on, a quick arrow is added to the date control on the dashboard for fast date switching, as shown below.
The quick arrow is operational only when a specific date is present in the date control box.
If a time filter range is set, you cannot switch to a date outside this range using the arrows.
Single date query
This example shows the sales data for a specific day.
On the Dashboards page, select a dashboard. The chart and filter bar displayed on the dashboard are shown in the figure below.
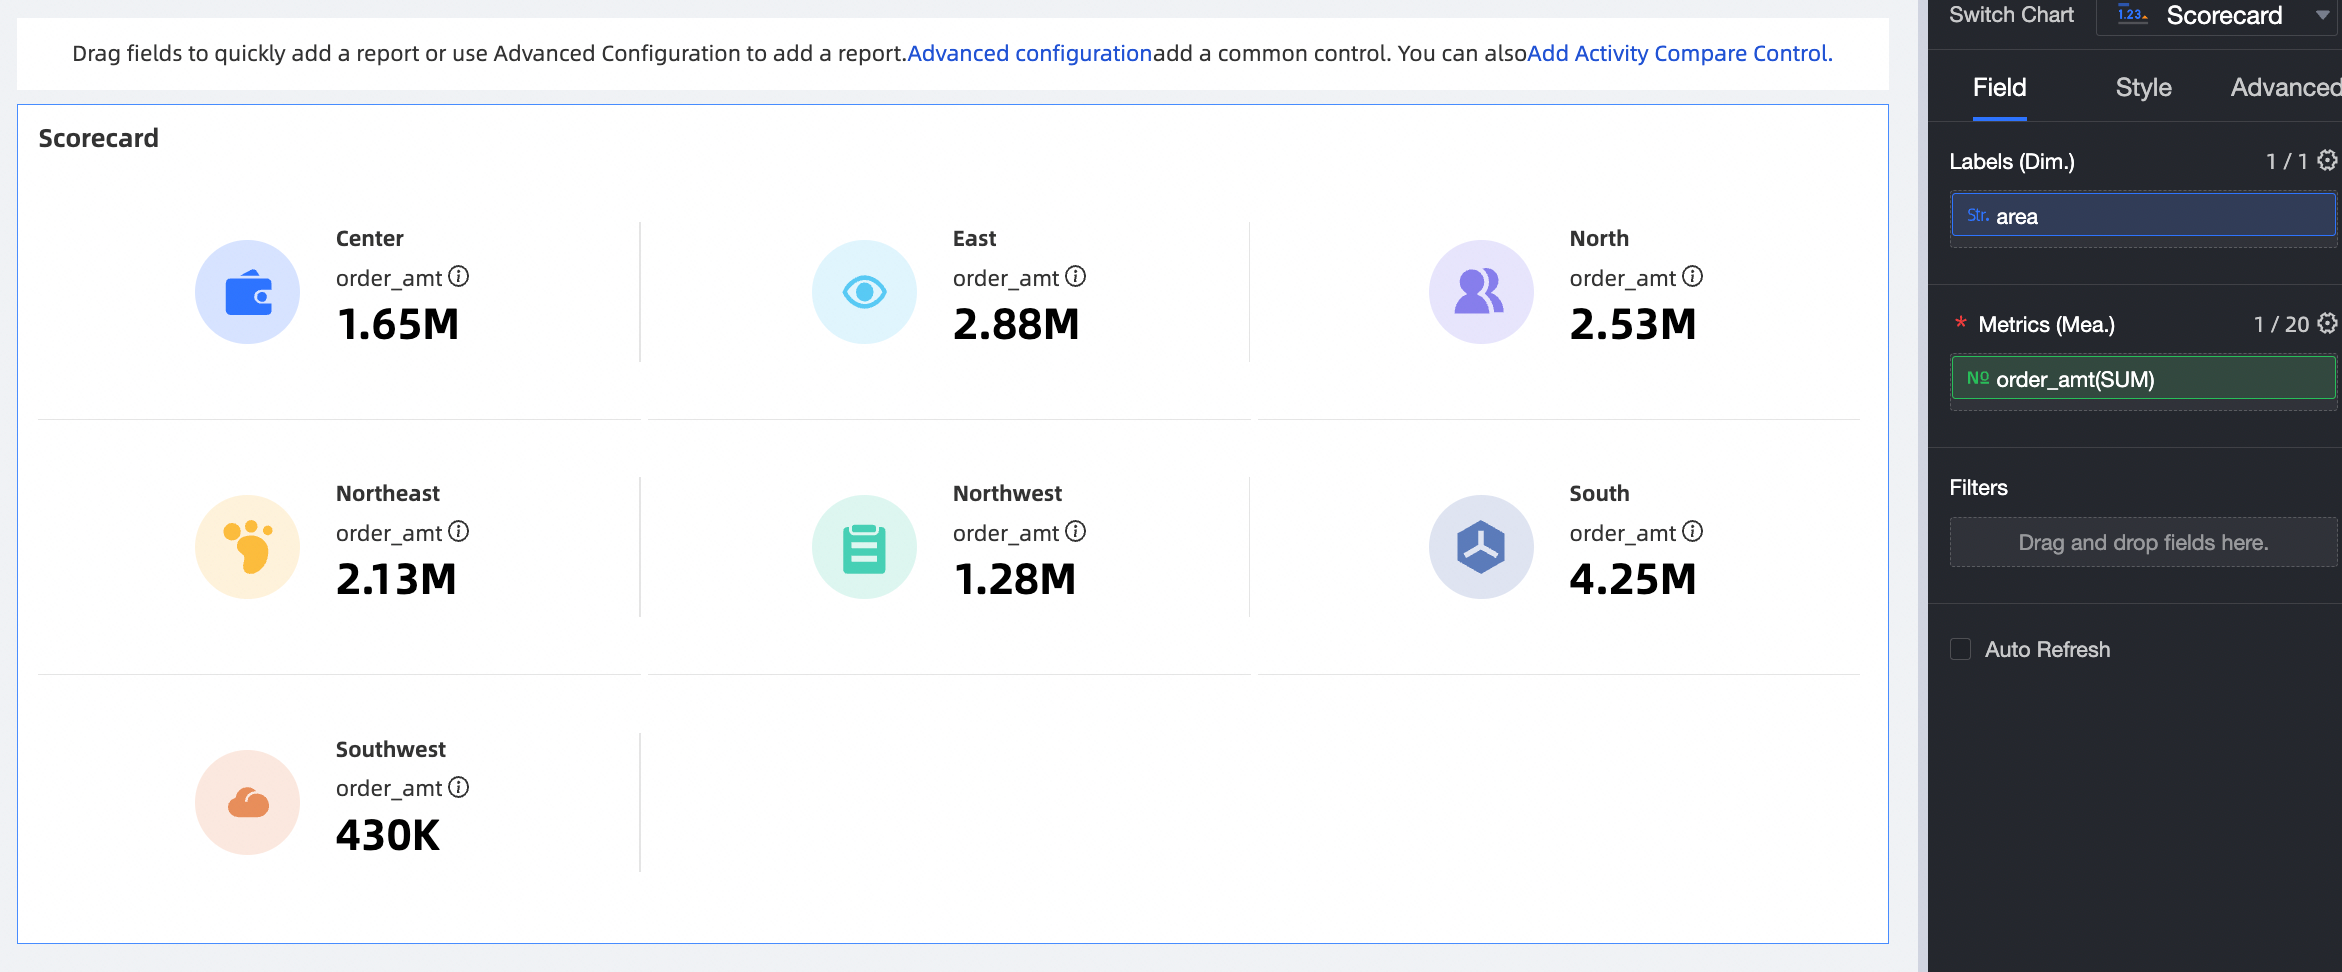
Click Advanced Configuration on the filter bar.
On the Query Condition Settings page, set the query conditions as depicted below.
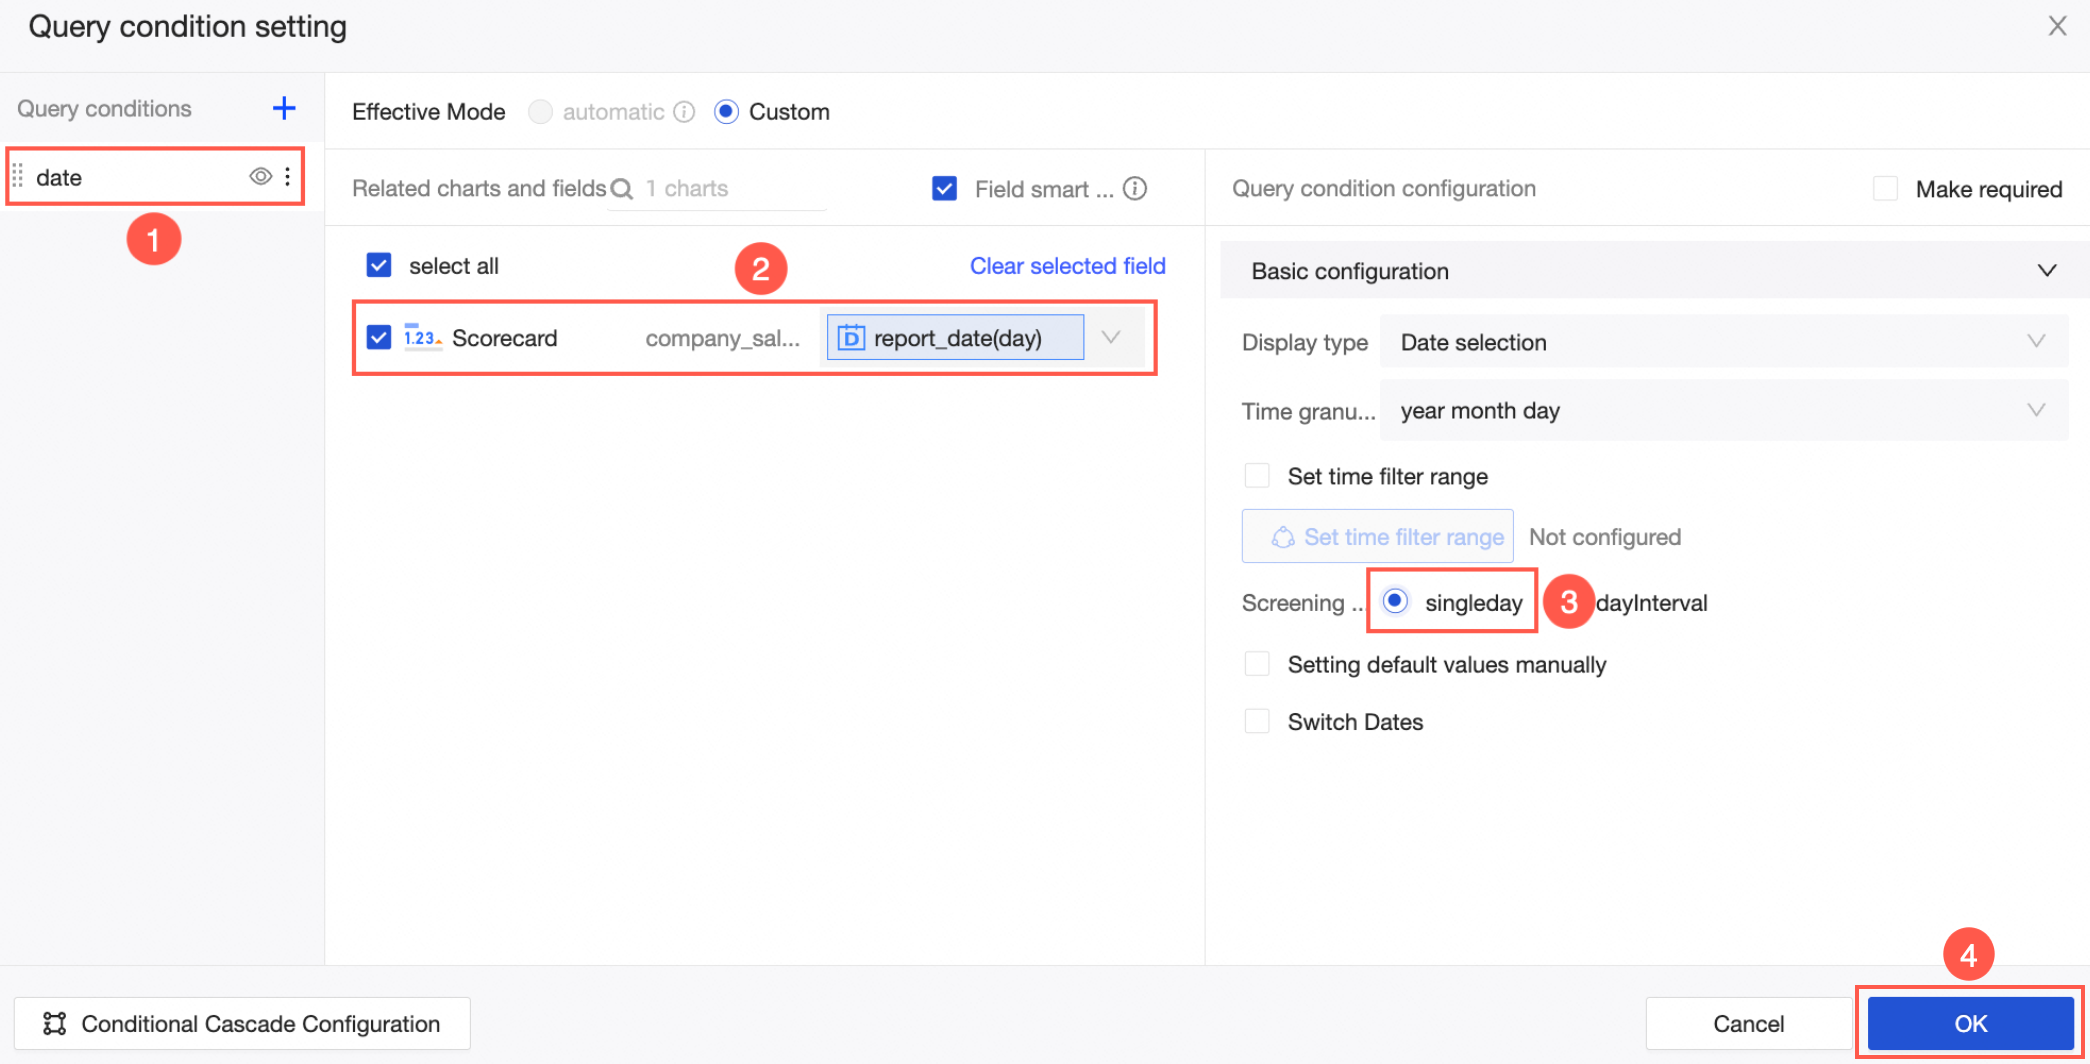
After setting up, select a date in the query conditions and click Query to view the sales data for that day.
Date interval query
This example shows how to query the profit of a store over a specific time period using the shipping_date(day) field.
On the Dashboards page, select a dashboard. The chart and filter bar displayed on the dashboard are shown in the figure below.
The dashboard chart must include a Date field.

Click Advanced Configuration on the filter bar.
On the Query Condition Settings page, set the query conditions as depicted below.
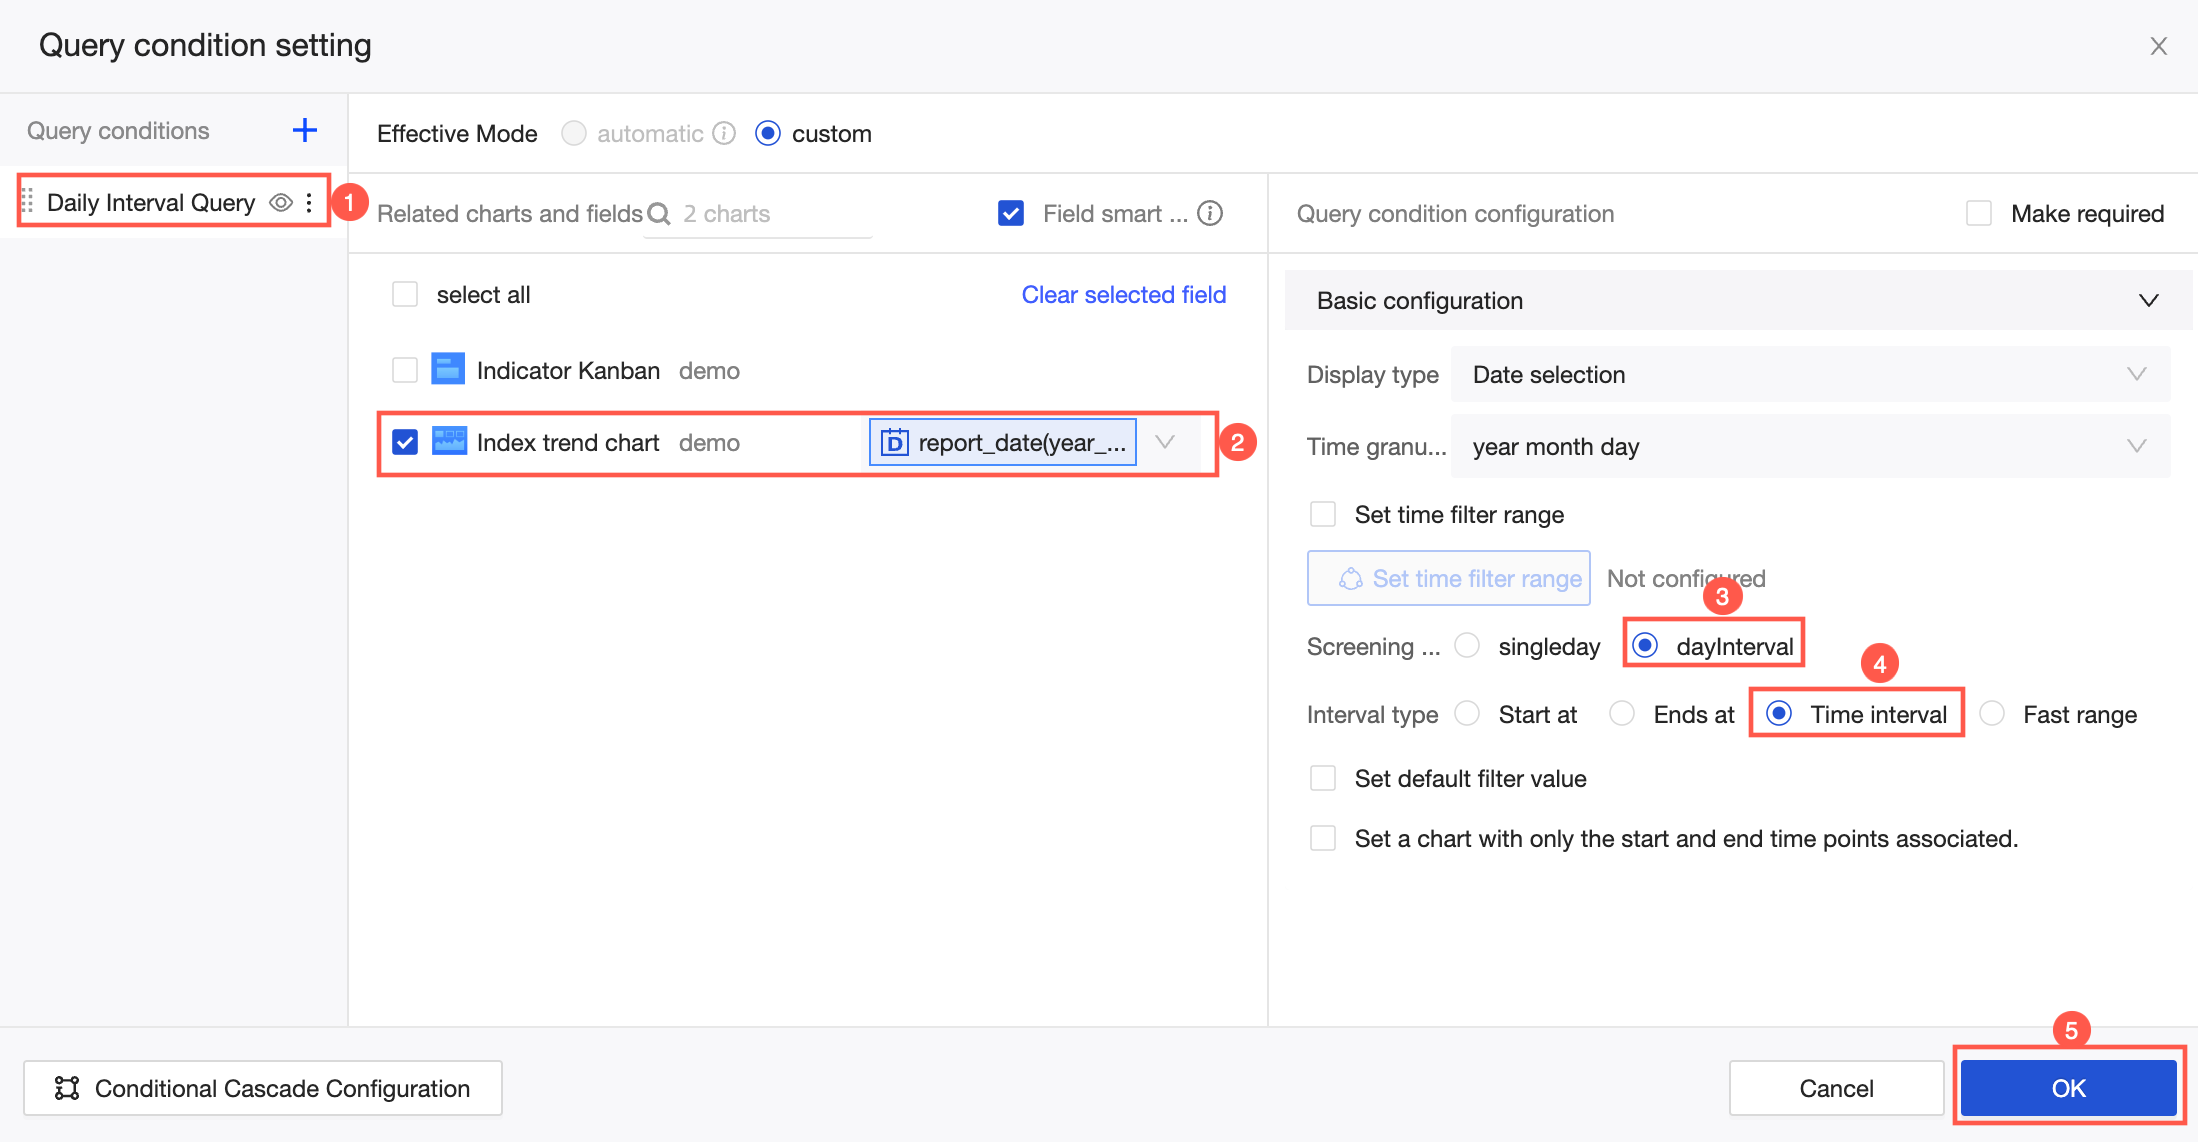
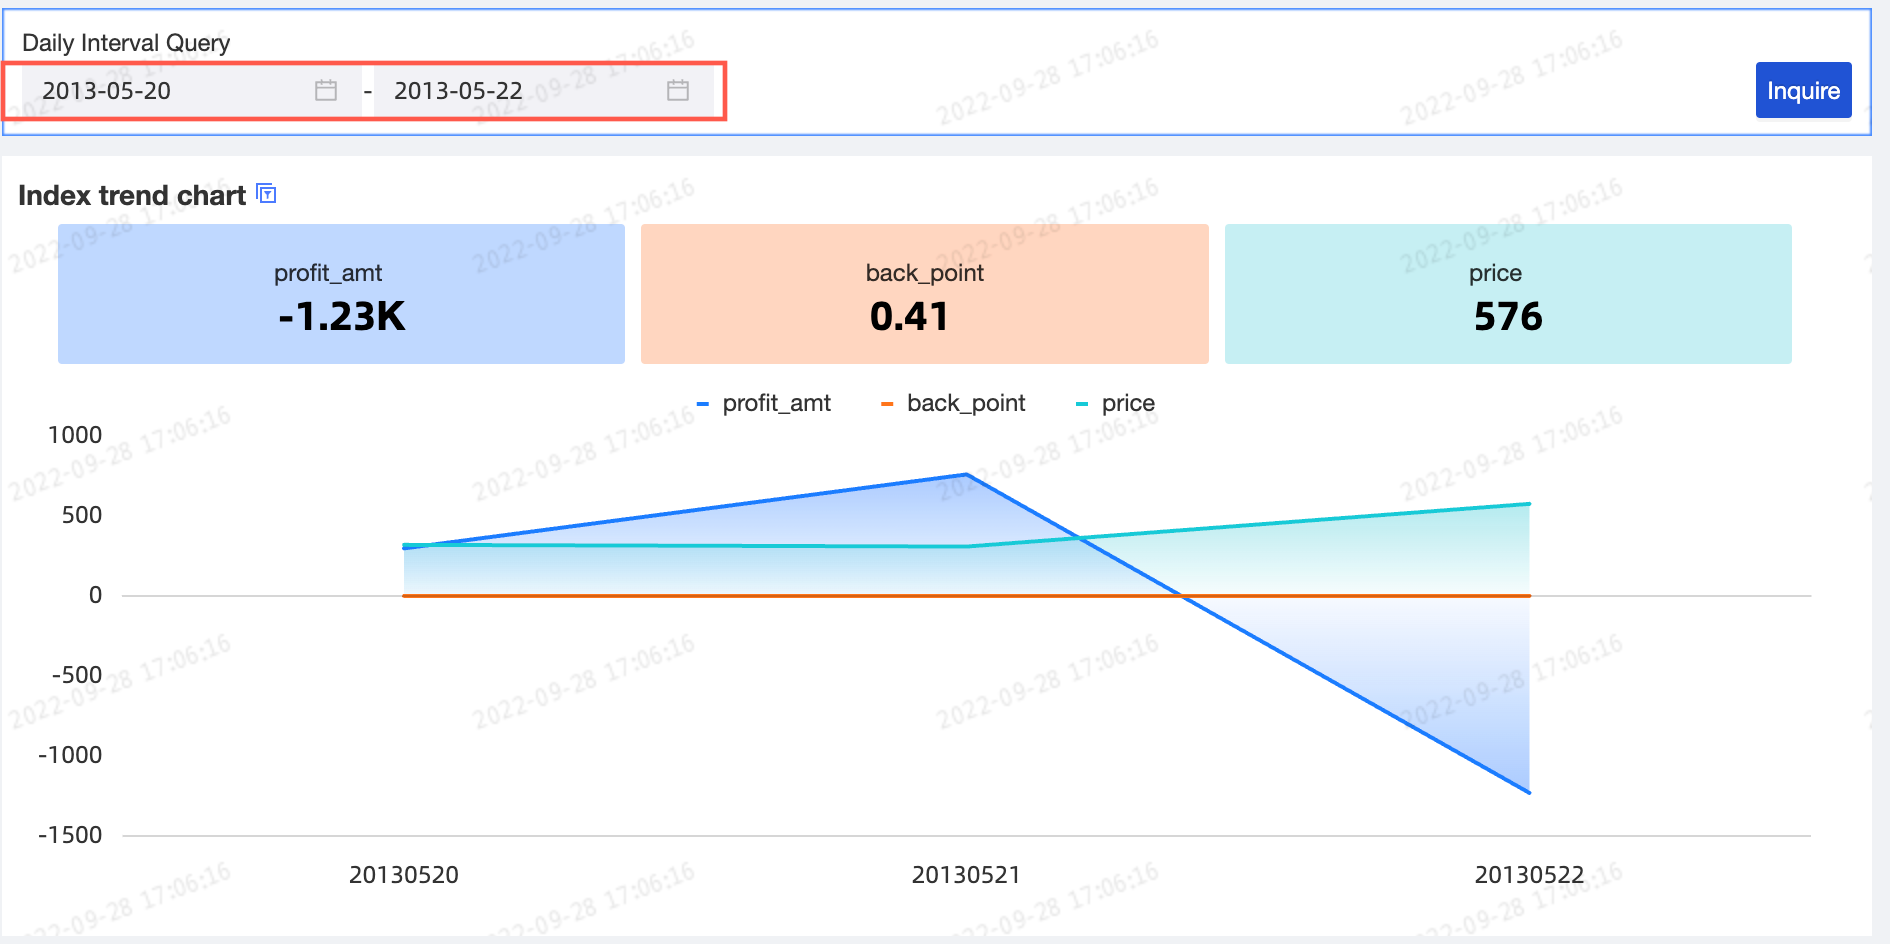
After setting up, select a date range in the query conditions and click Query to view the store's profit for that period.

If the Screening method is set to dayInterval, you can configure parameters for efficient data viewing.
Interval Type supports Start at, End at, Time interval, and Quick interval.
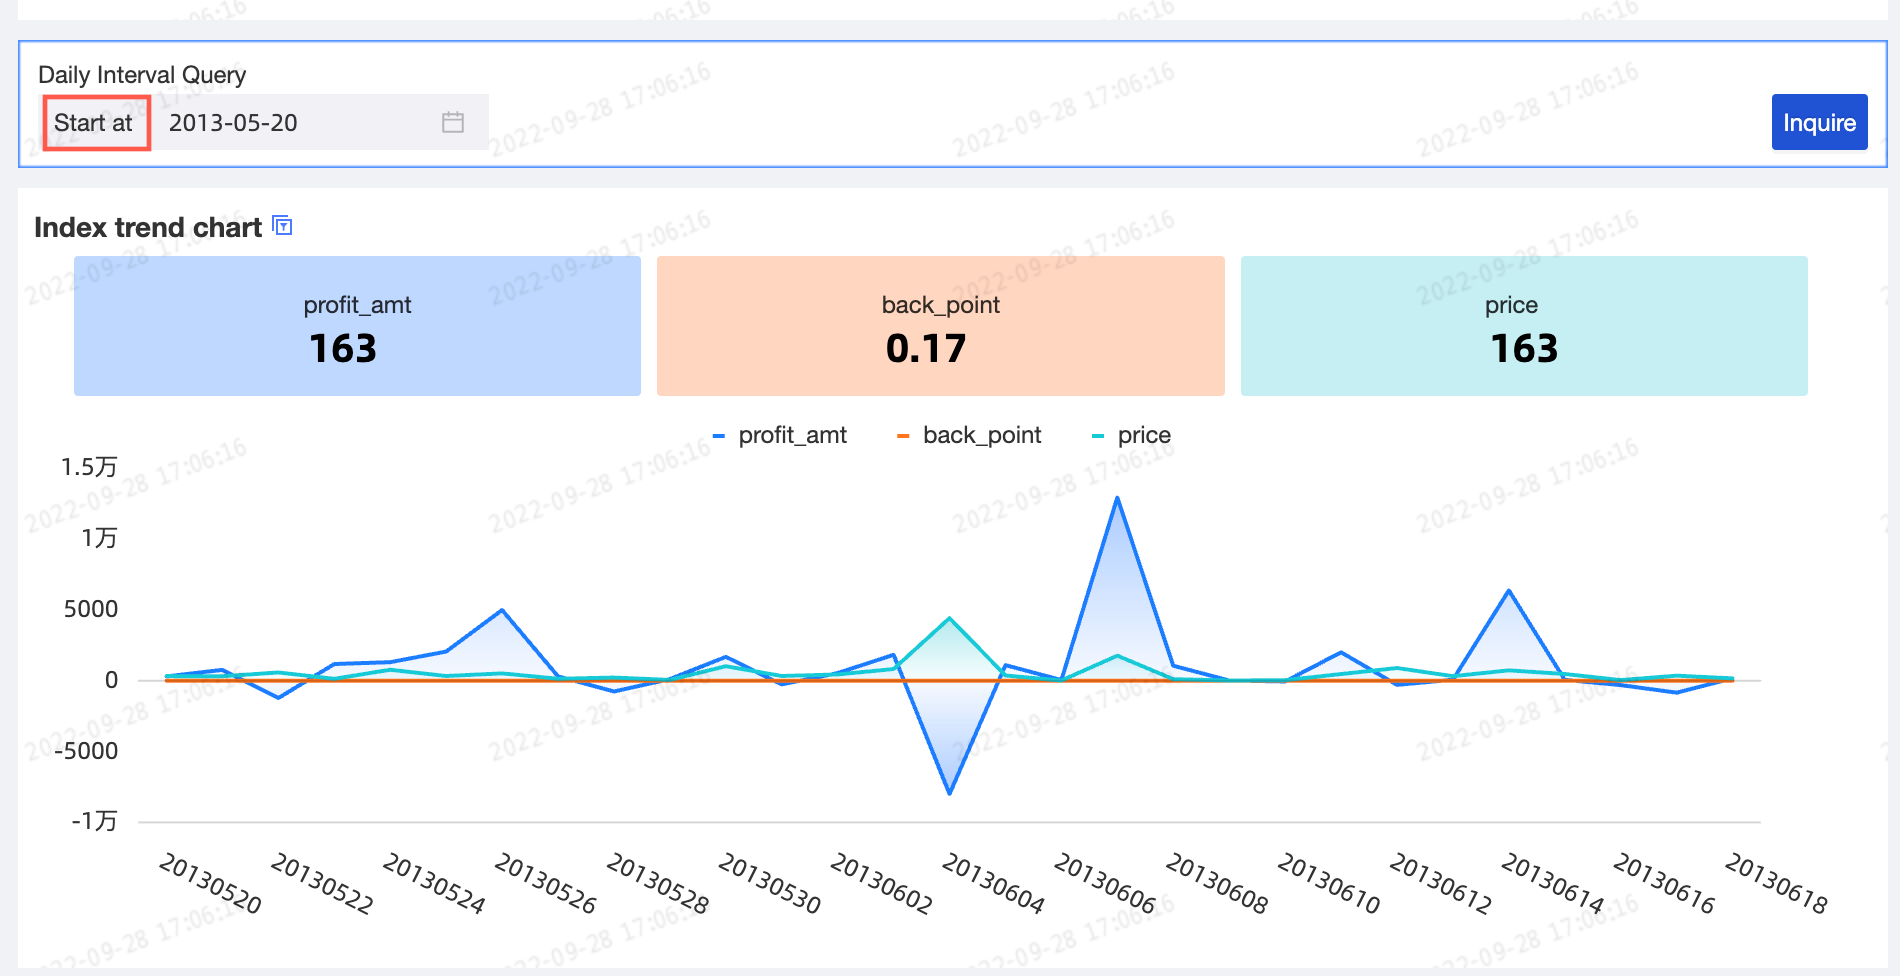
Start at
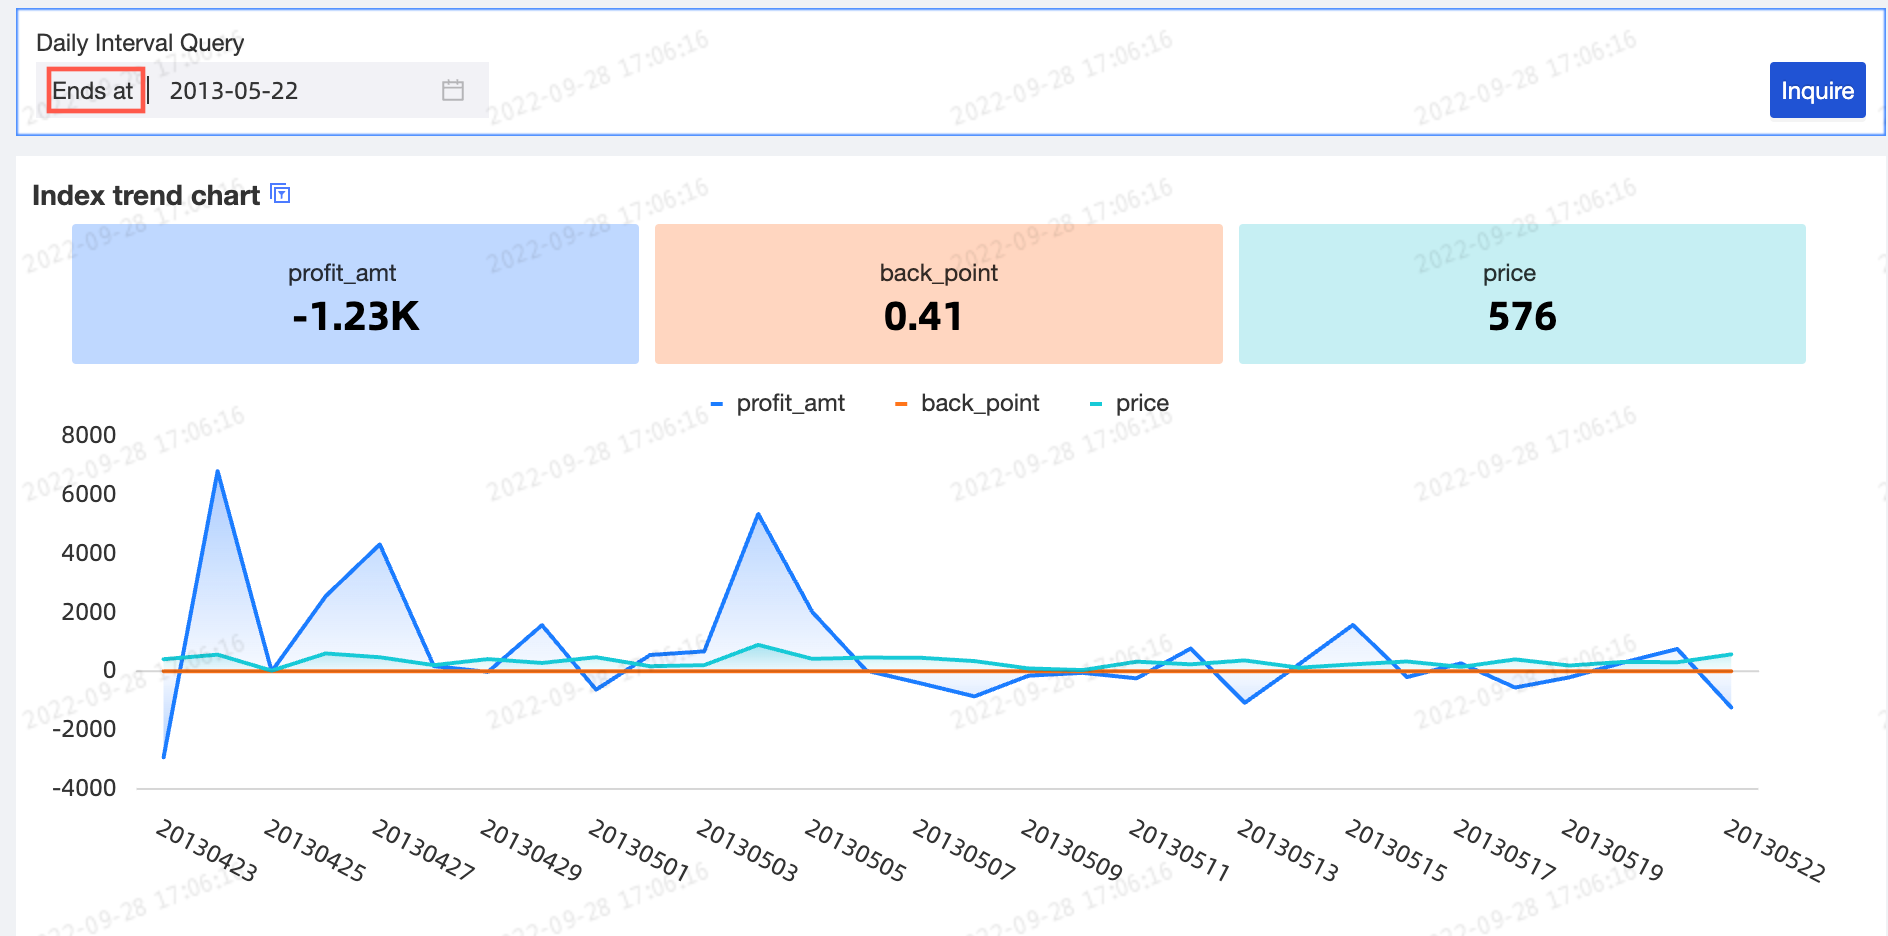
End at
Time interval
 Quick interval
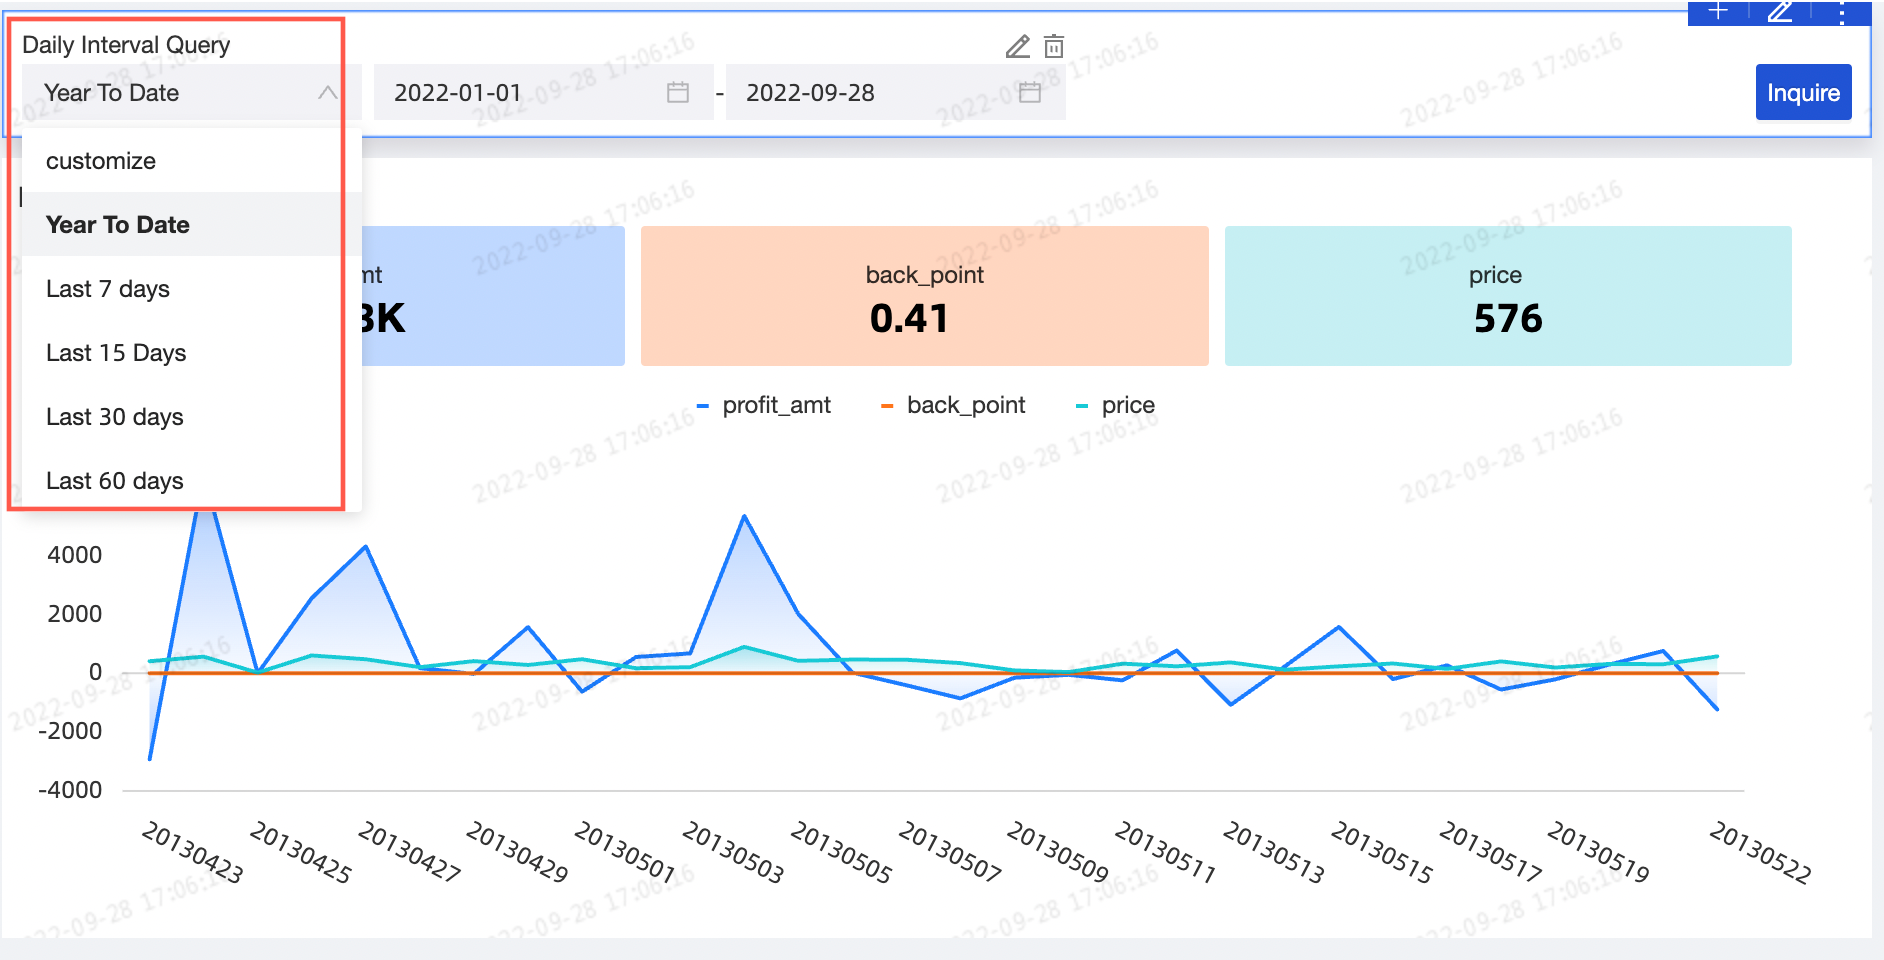
Customize Quick Interval: This feature supports multiple interval scenarios and lets you customize the values of quick intervals. You can select a quick interval from the drop-down list or click Add Custom Quick Interval to add a custom interval.
 Note
NoteThis option is configurable only when Interval Type is set to Quick Interval.
You can select a quick interval from the drop-down list. The available quick intervals vary based on the time granularity. For more information, see Query type configuration.

If the built-in quick intervals do not meet your needs, you can click Add Custom Quick Interval to create a custom interval.
NoteA custom quick interval takes effect only for the current query condition.

On the custom quick interval configuration page, you can configure the following items.

Configuration item
Description
Interval name
The name of the custom quick interval.
Base time
Base Time can be set to Today, Yesterday, or Custom.
 Note
NoteT represents today. For example, T+1 represents tomorrow, and T-1 represents yesterday.
The base time is the reference start point for defining a date interval. After you select a base time, the date interval is calculated forward or backward from this base time.
For example, if today is November 21, 2025, the base time is set to "Yesterday" (November 20, 2025), and the interval range is set to "Last 3 days", the actual query date range is from two days before yesterday to yesterday, which is from November 18, 2025 to November 20, 2025.

Interval range
NoteThe Interval Range can be configured only after the Base Time is set.
"Last N" interval range: Generates a dynamic interval range of "Last N periods" based on the base time. The available interval ranges vary based on the time granularity. For example, if the time granularity is Day, you can set the range to Last N Days/Months/Years.

Custom interval range: If the "Last N periods" setting does not meet your needs, you can set the Relative time or Exact time for the start and end times of the interval.

Interval preview
The interval preview is updated in real time based on the selected base time and interval range. You can check whether the configured interval meets your expectations.

Set Charts Associated With Only Start And End Times: In the dashboard, you can Set Charts Associated With Only Start And End Times to apply the same date interval to different charts.
Three time range filters are supported:
Limit start time
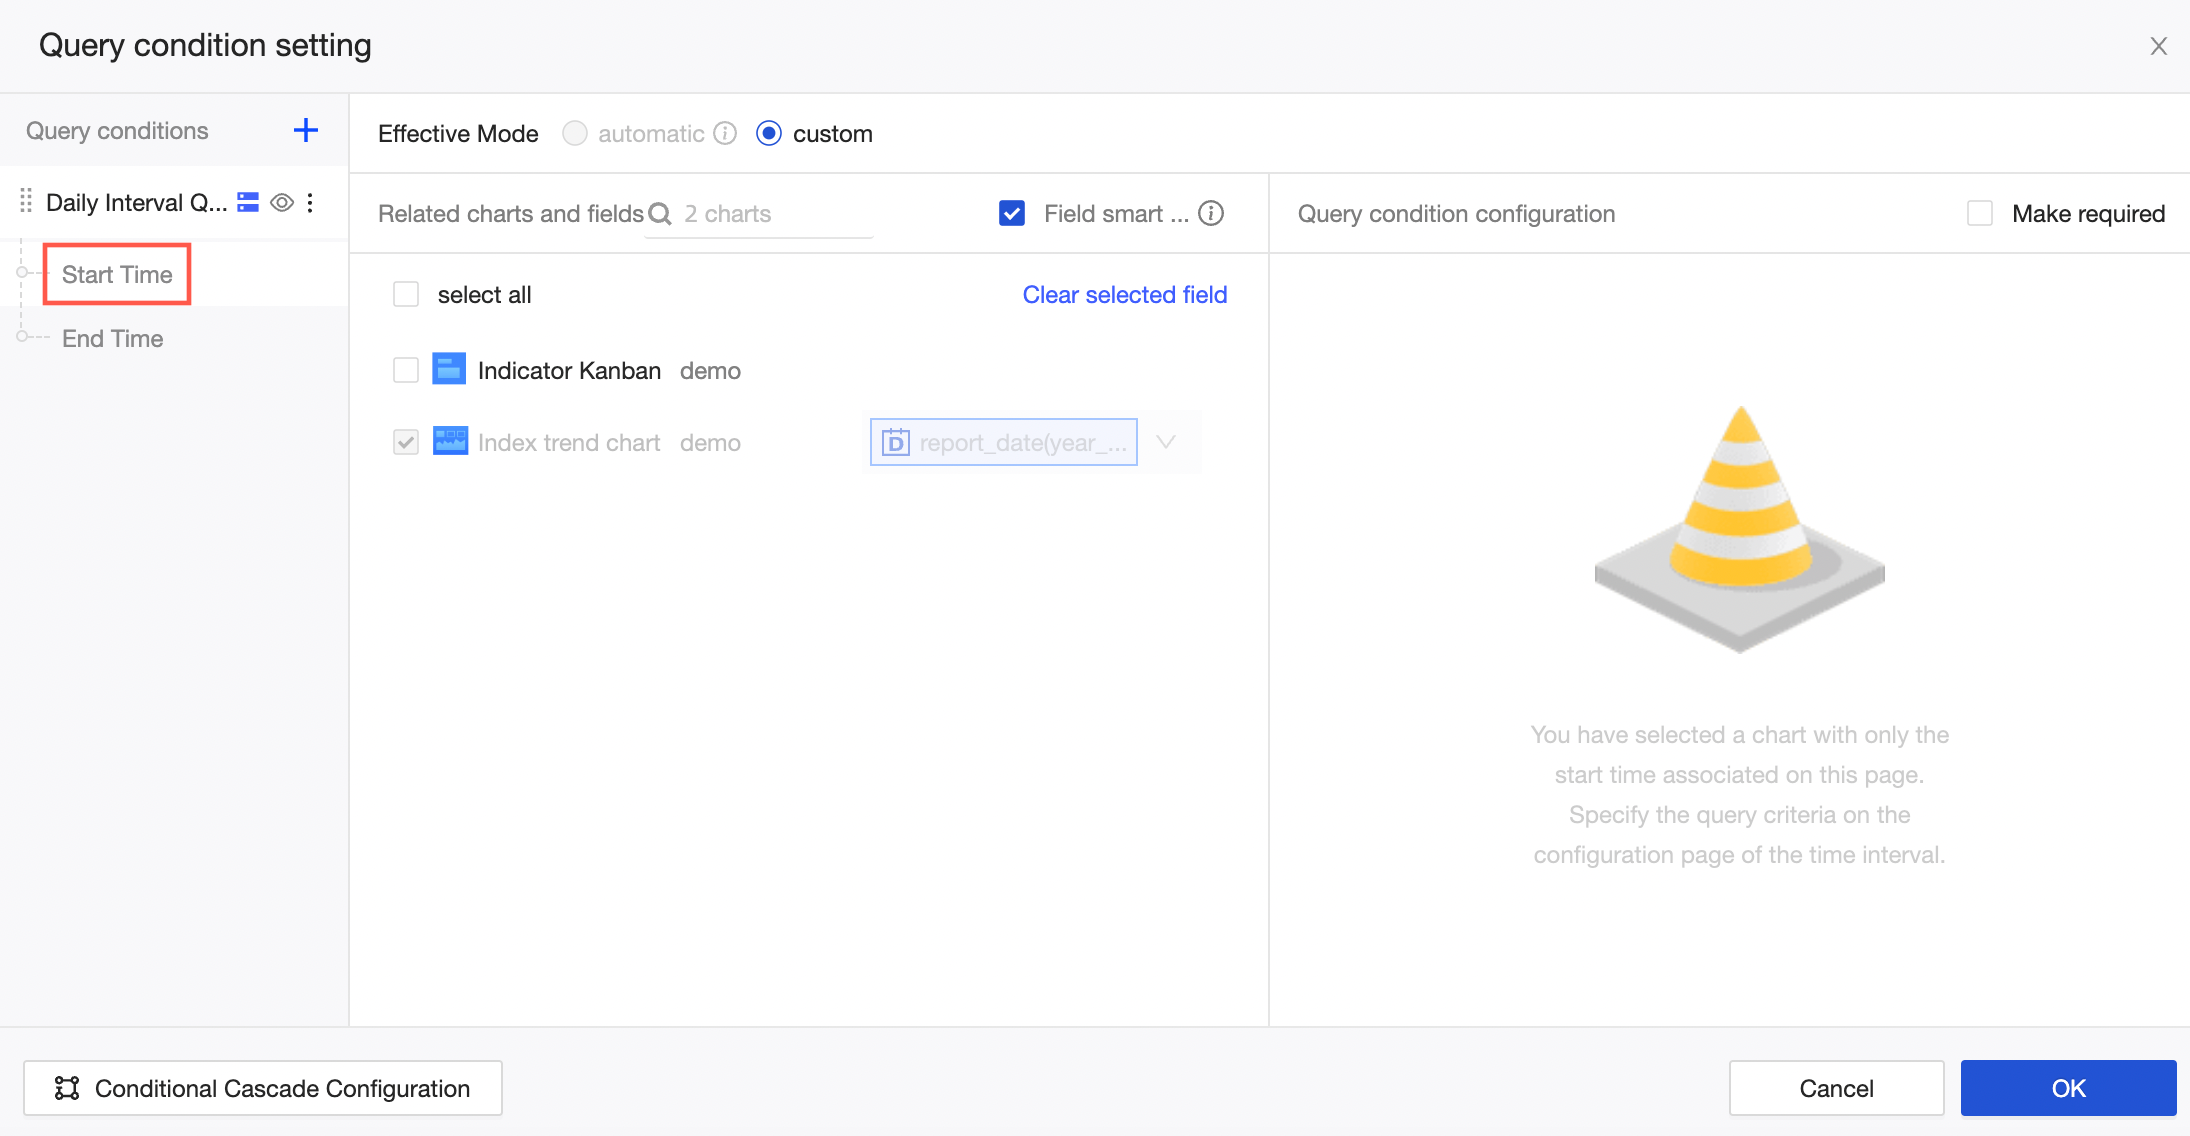
Limit end time

Limit time interval
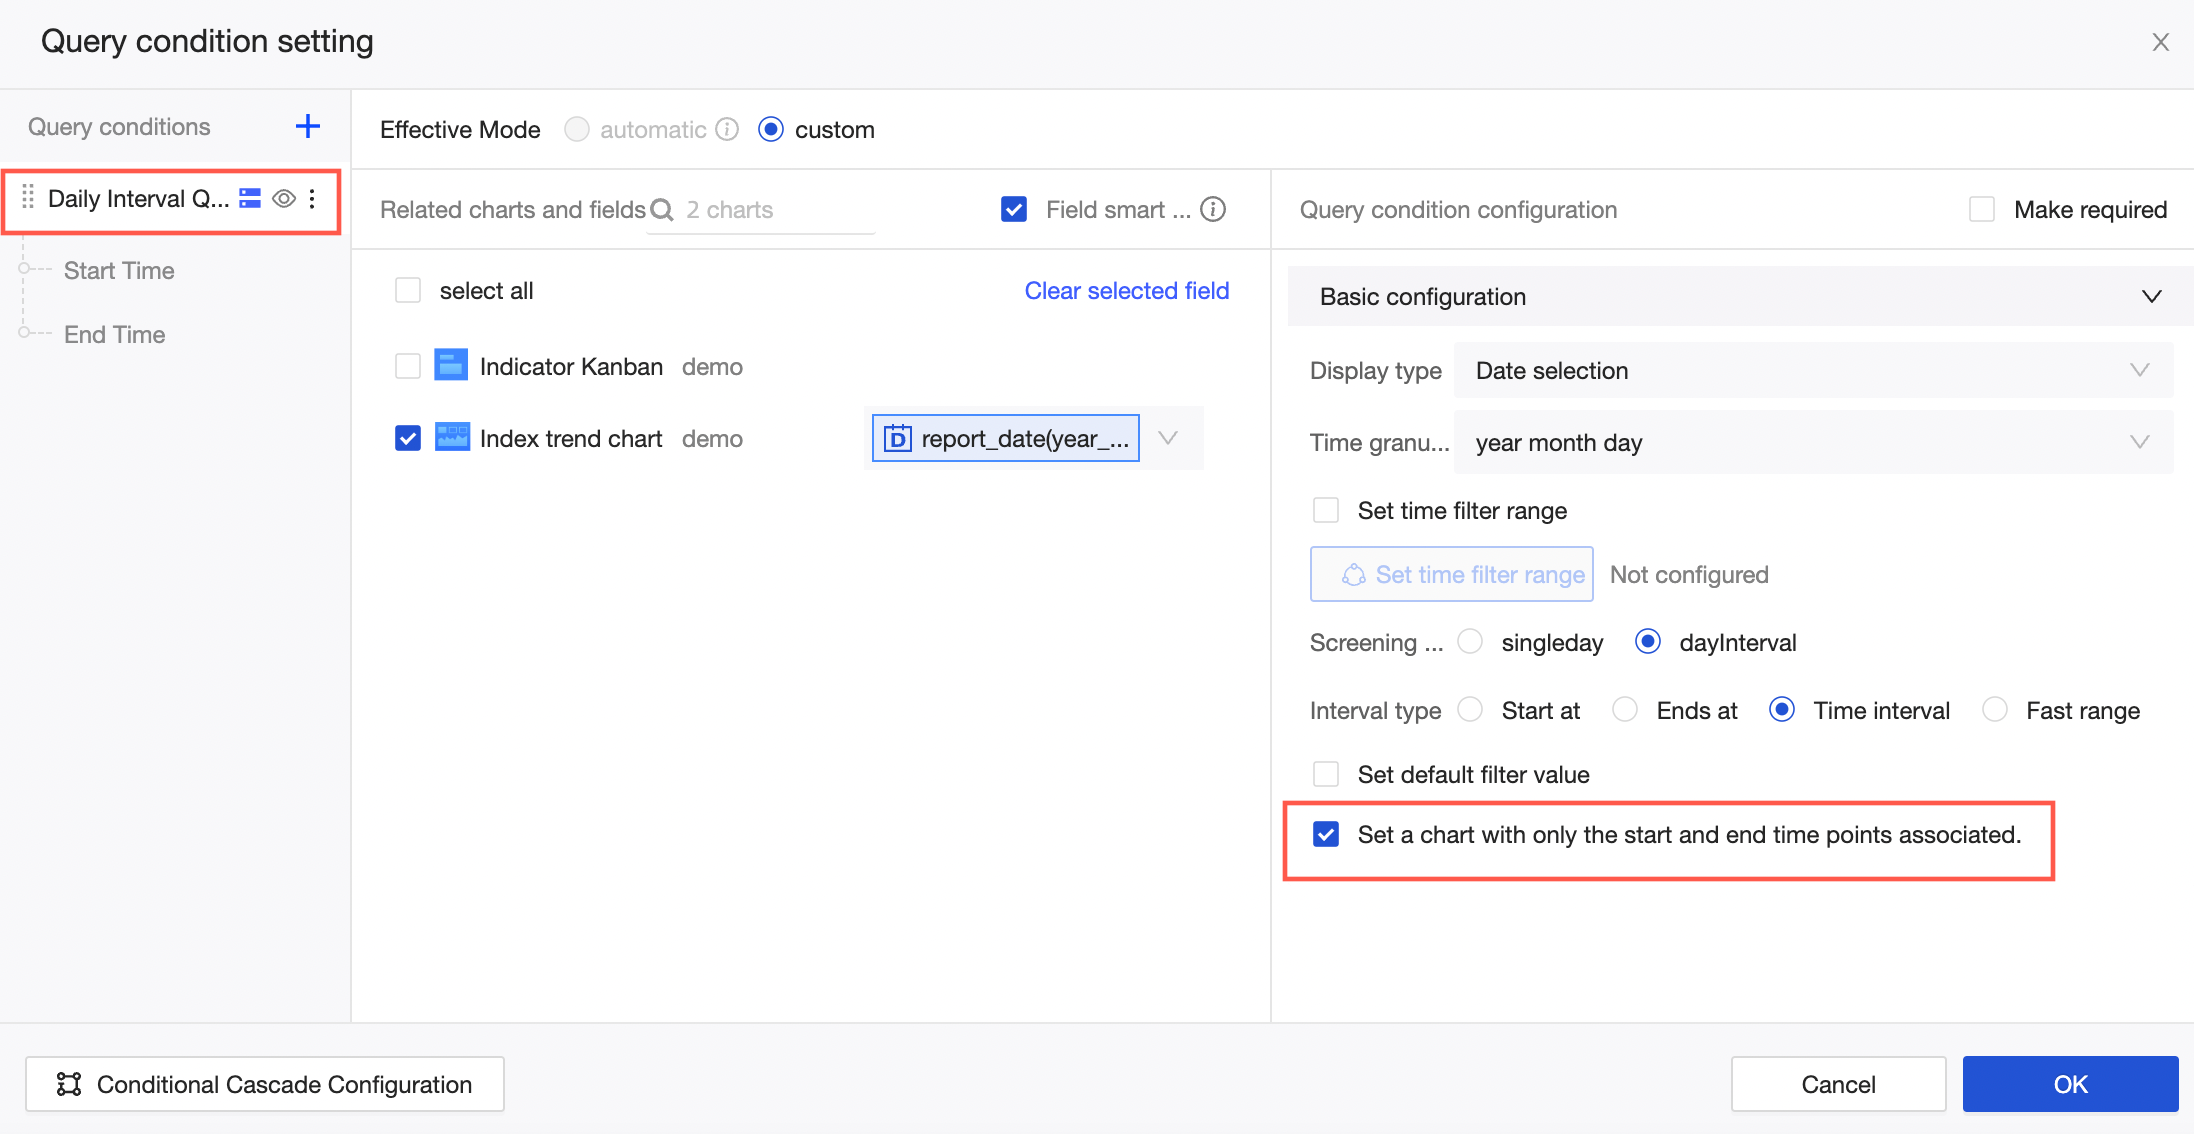
NoteThis option is configurable only when Interval Type is set to Time Interval.
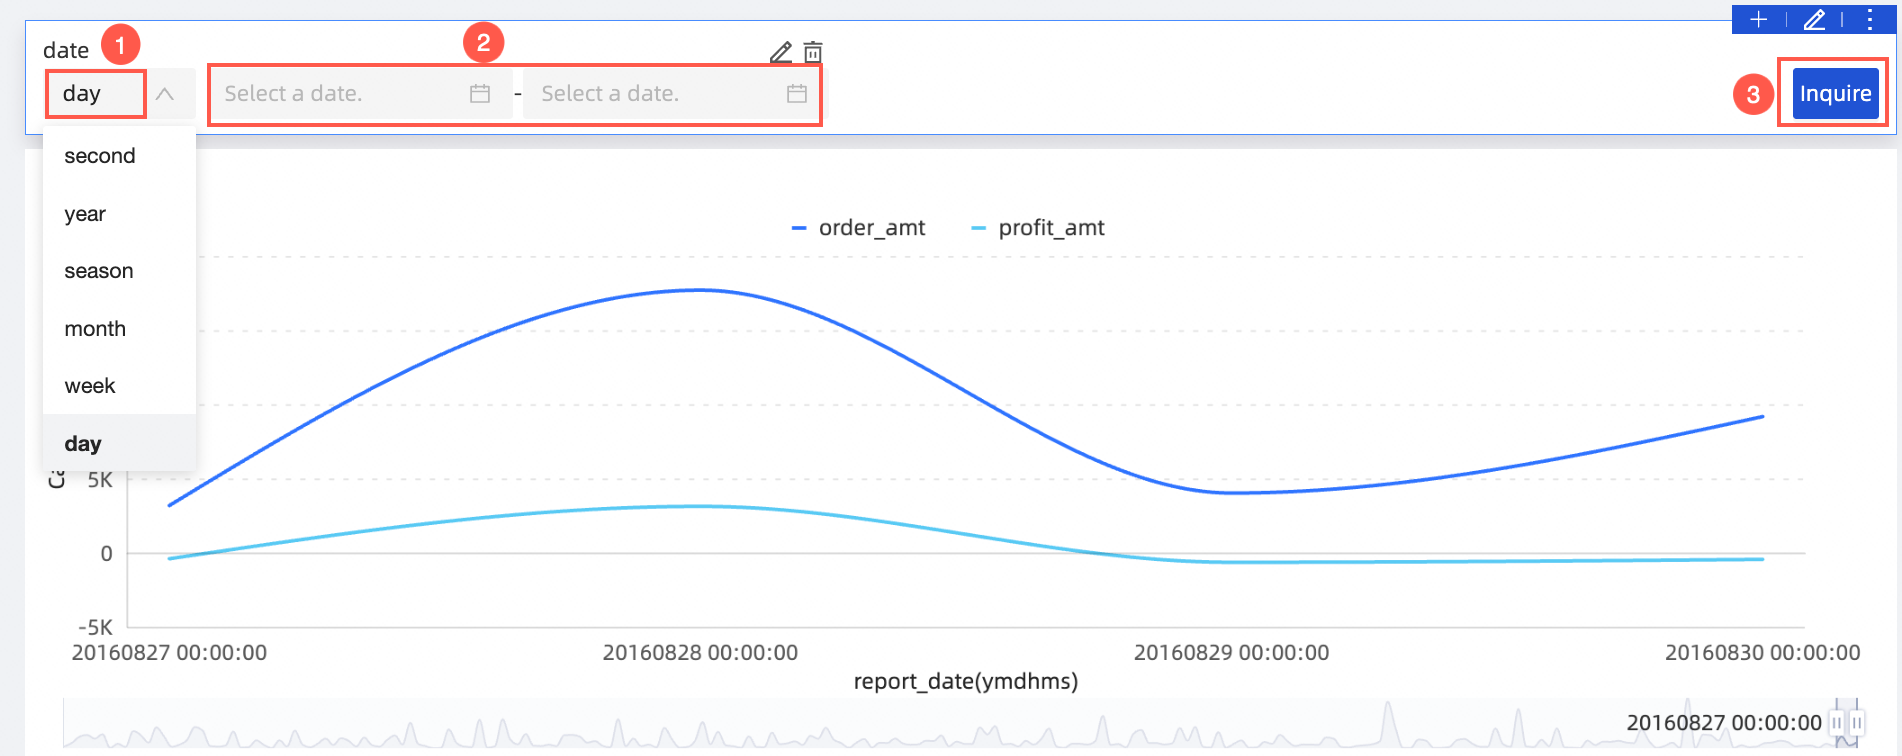
Date granularity switching
When the associated field in the date filter bar is set to YYYYMMDD HH:MM:SS (for example, shipping_date(ymdhms)), you can switch the date granularity in the filter bar to quickly view data from different time perspectives in a single chart. This lets you configure a single filter bar instead of using multiple dashboards or tabs for various granularities.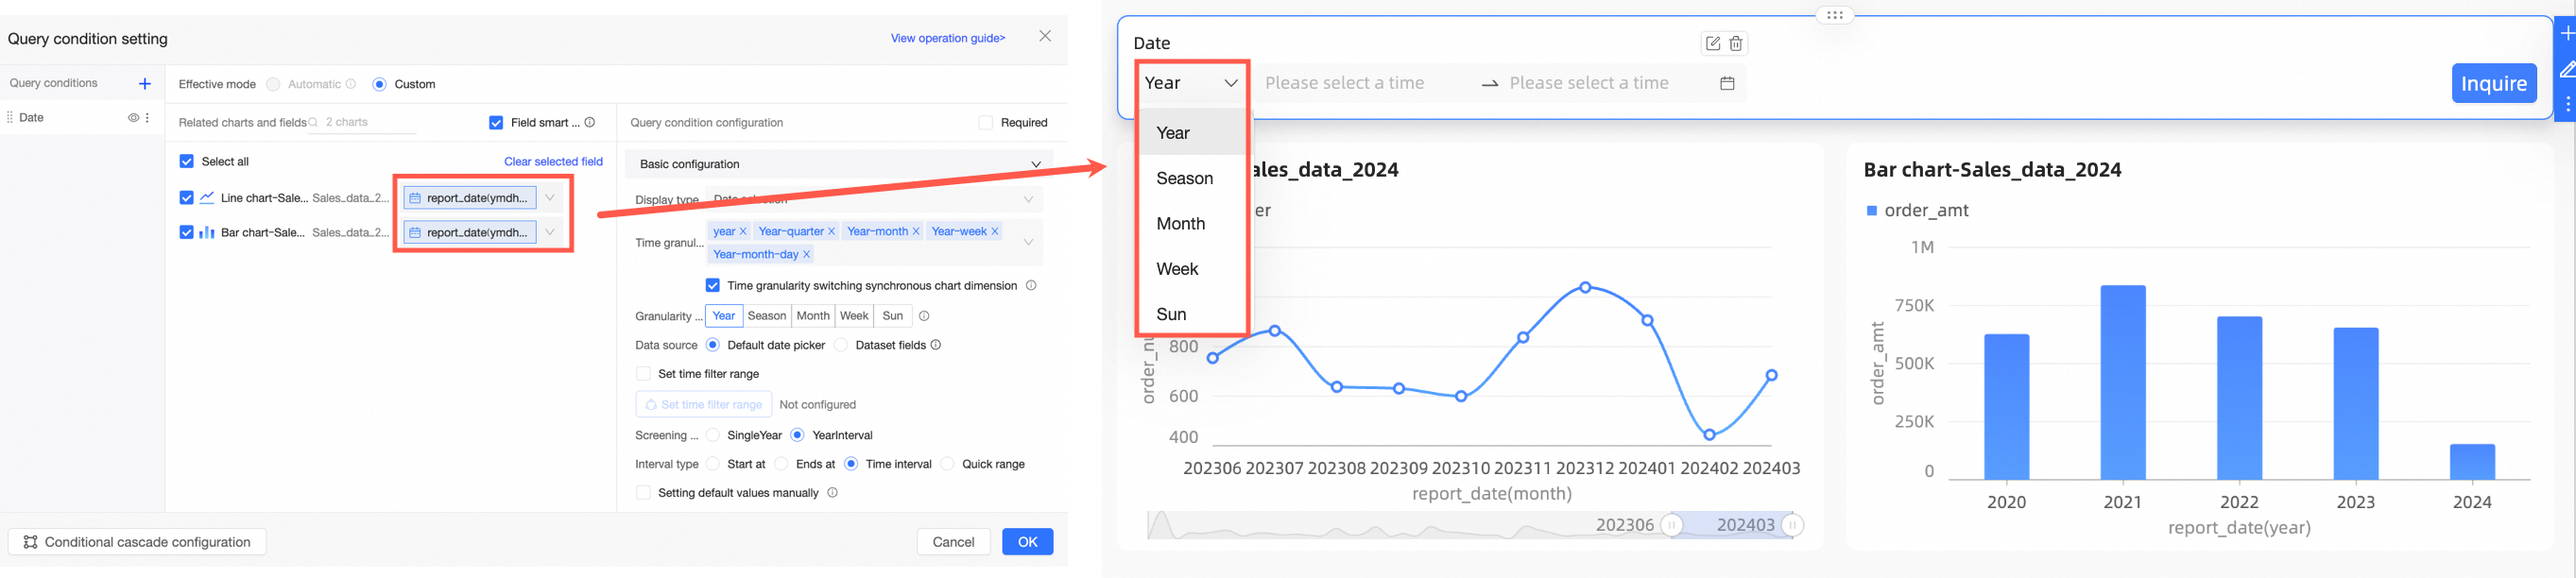
You can configure the date filter bar to either Control Only the Date Filter or Synchronously Control Charts. The differences between these two options are as follows:
Configuration method | Description | Example |
Date granularity switching controls only the date filter | The date granularity switching in the date filter bar only affects the filter options in the date control, without changing the date granularity displayed in the chart. This method is suitable for scenarios where you only need to switch the time filter options in the date filter bar without changing the time dimension displayed in the chart. For specific configuration instructions, see Date granularity switching controls only the date filter. | When the current chart displays data at the year granularity, if you select the month granularity in the filter bar and specify January to September 2023 as the month range, after clicking Query, the chart still displays data at the year granularity, showing only the aggregate data for January to September 2023 at the year level. The effect is shown in the figure below. |
Date granularity switching synchronously controls charts | When a date dimension group is configured in the chart's field panel, the synchronous control mode allows the chart's display date granularity to automatically follow the date granularity switching in the date filter bar. This method is suitable for scenarios where you need to flexibly switch the time dimension displayed in the chart through the date filter bar to view specific data performance at different time dimensions. For specific configuration instructions, see Date granularity switching synchronously controls charts. | When the current chart displays data at the year granularity, if you select the month granularity in the filter bar and specify January to November 2023 as the month range, after clicking Query, the chart's display date granularity synchronously switches to month, showing monthly details for January to November 2023. The effect is shown in the figure below. |
Date granularity switching controls only the date filter
The date granularity values in the date filter bar will only affect the filter options in the date control. You can configure this according to the following instructions.
On the Query Condition Settings page, set the query conditions as shown below.
In this example, the date field is shipping_date(ymdhms).
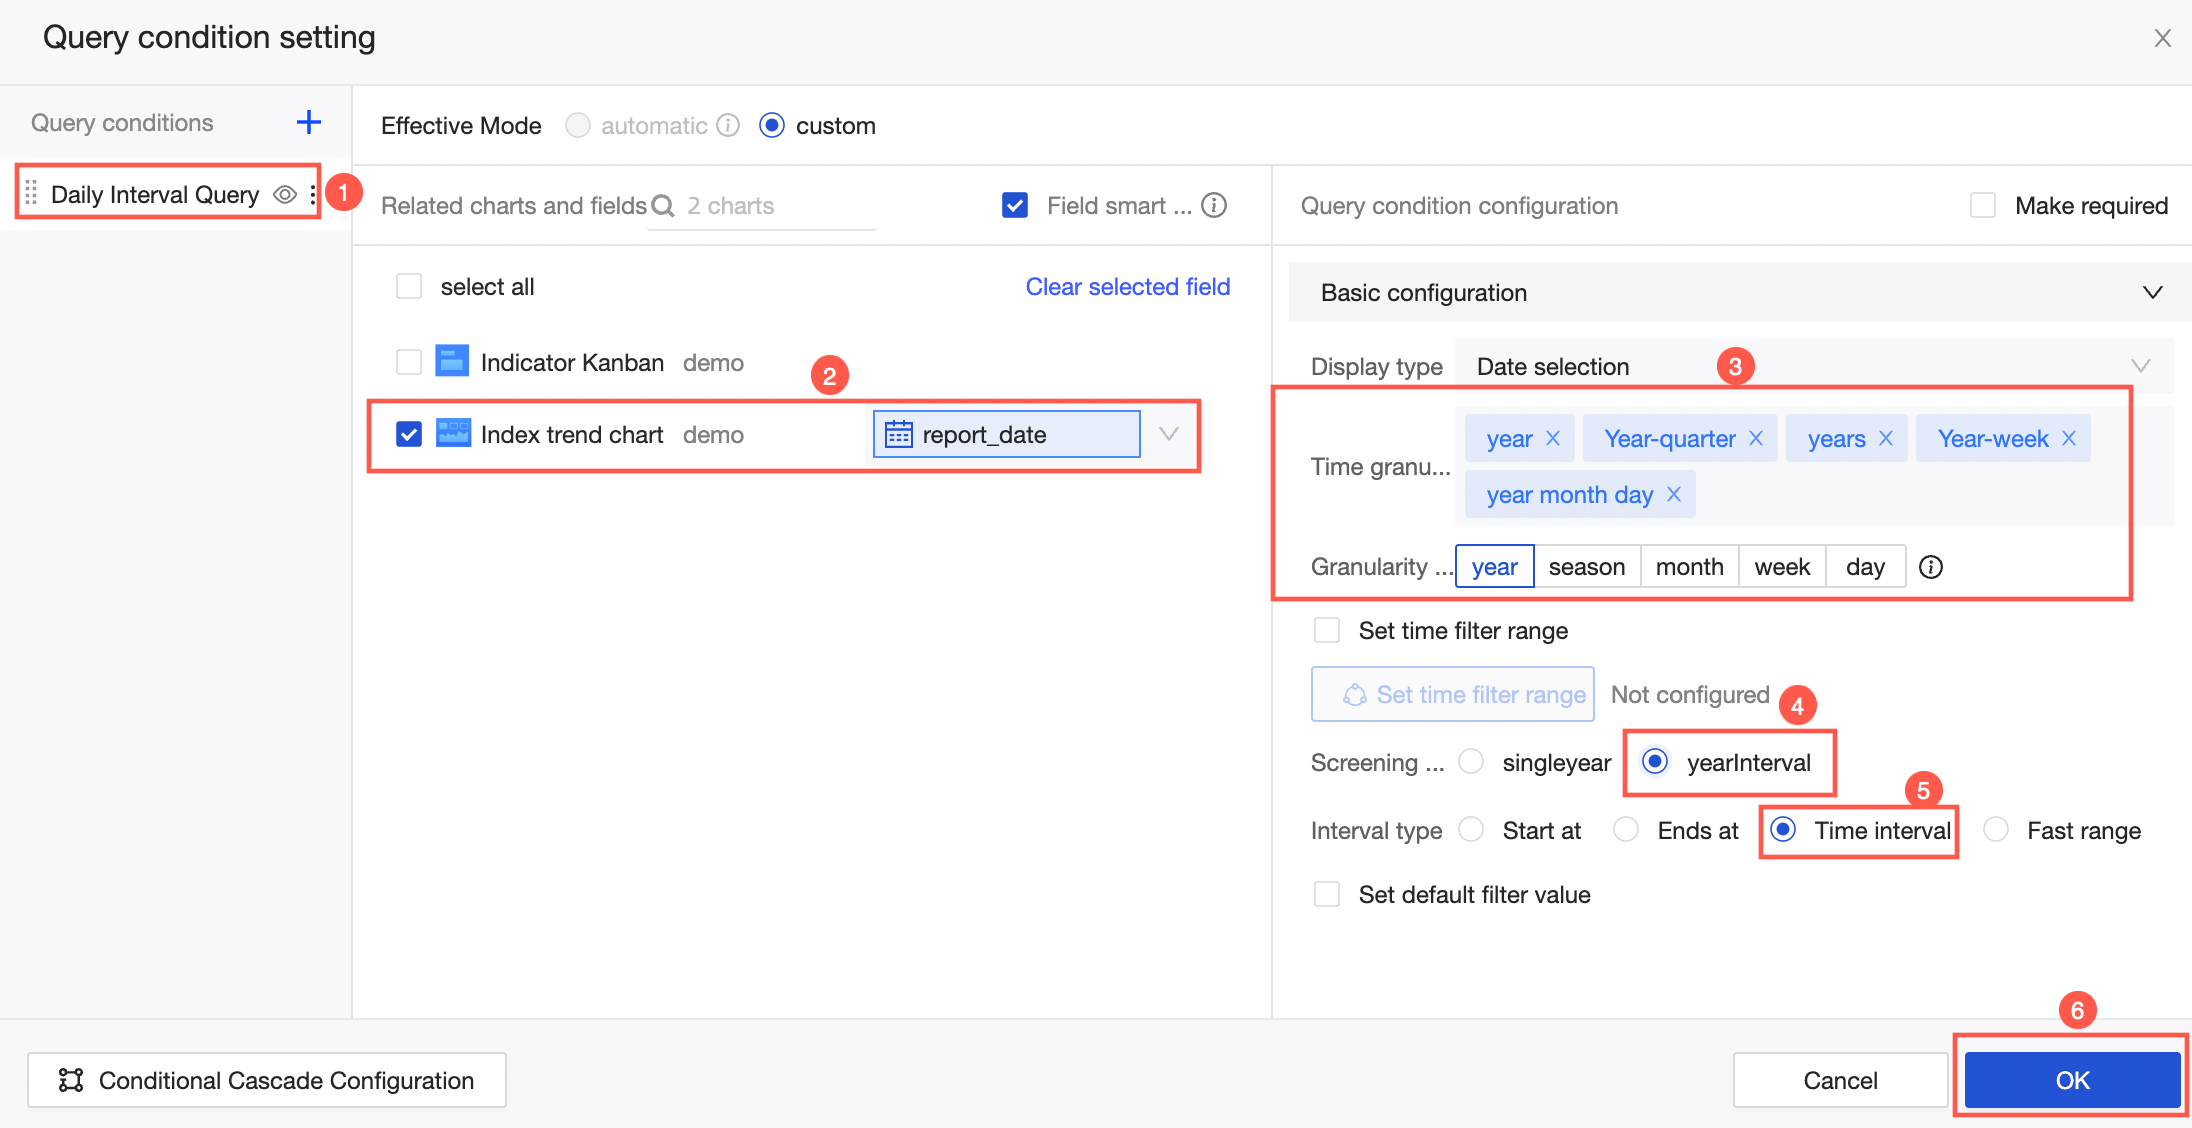
In the Basic Configuration area, the parameter configuration is as follows:
Time Granularity: After selecting the time granularity field for the associated field, a default value is automatically filled in the Time Granularity.
If the associated field is shipping_date, the default granularity is YYYYMMDD HH:MM:SS. You can also select other granularities such as years, Year-quarter, Year-month, Year-week, and year-month-day from the dropdown list based on your needs. Unwanted granularities can be removed.
Sub-granularity Settings: These settings allow you to quickly view data from different time perspectives on a dashboard.
NoteSub-granularity configuration is necessary only when Time Granularity includes two or more values.
Set Default Filter Value: Assign a default value for the filter bar.
With Sub-granularity Settings in place, you can set different default values for each granularity, facilitating quick data queries when switching between them.
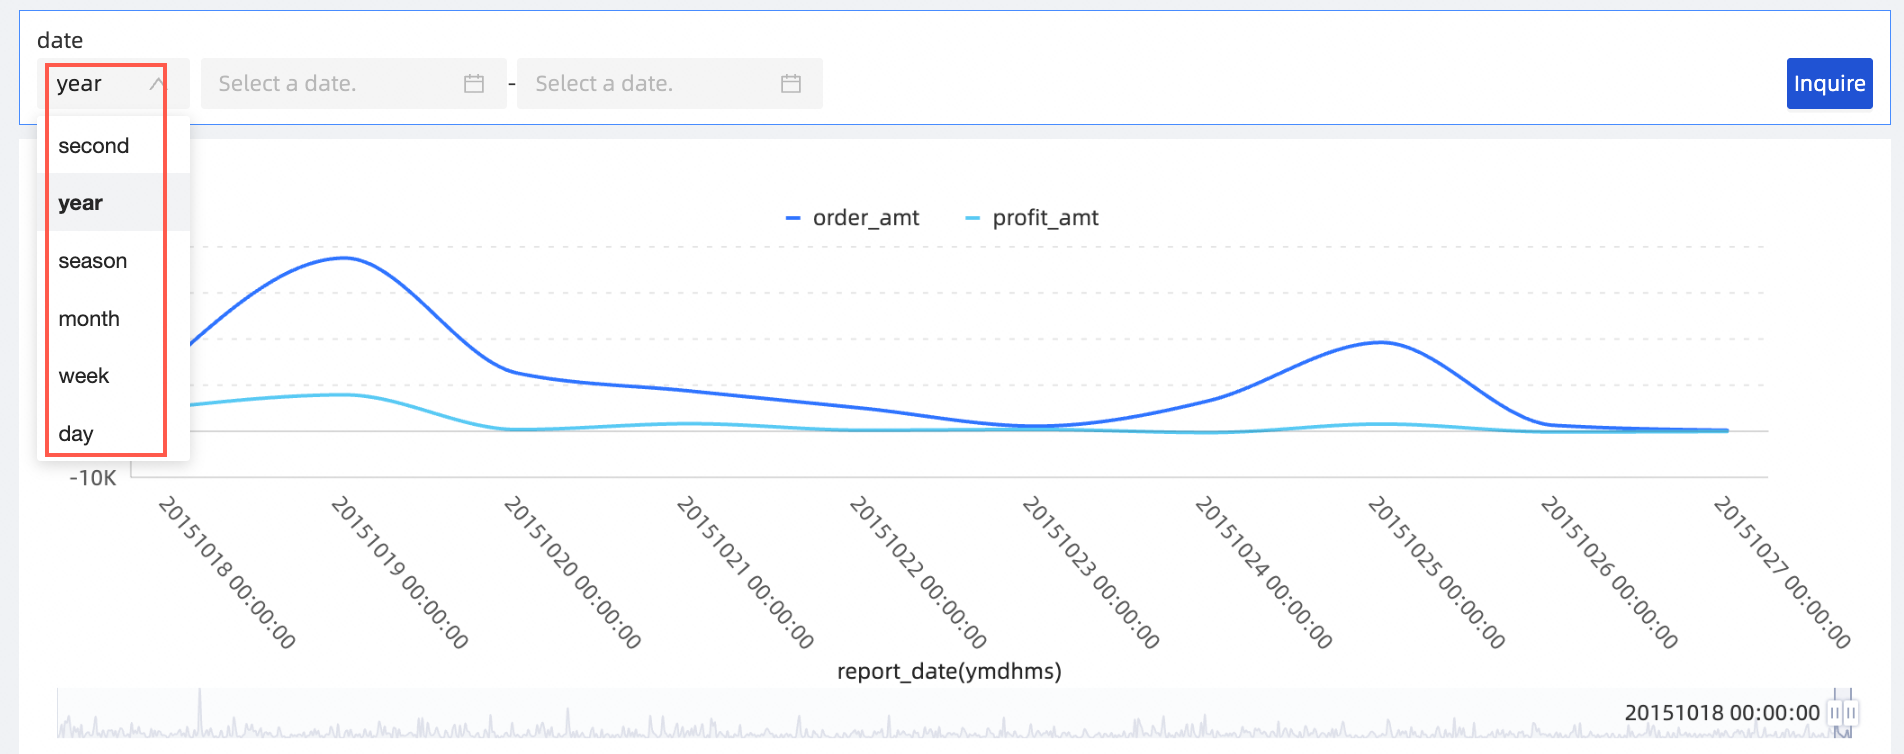
After configuring, switch the granularity in the query conditions, select a date, and click Query.
You can also switch sub-granularities to quickly query data.
If the dataset includes a Fiscal Year configuration, the Fiscal Year Starts At setting in the filter bar follows the dataset's field configuration and cannot be altered. For more details on fiscal year settings, see Create a Dataset.
Date granularity switching synchronously controls charts
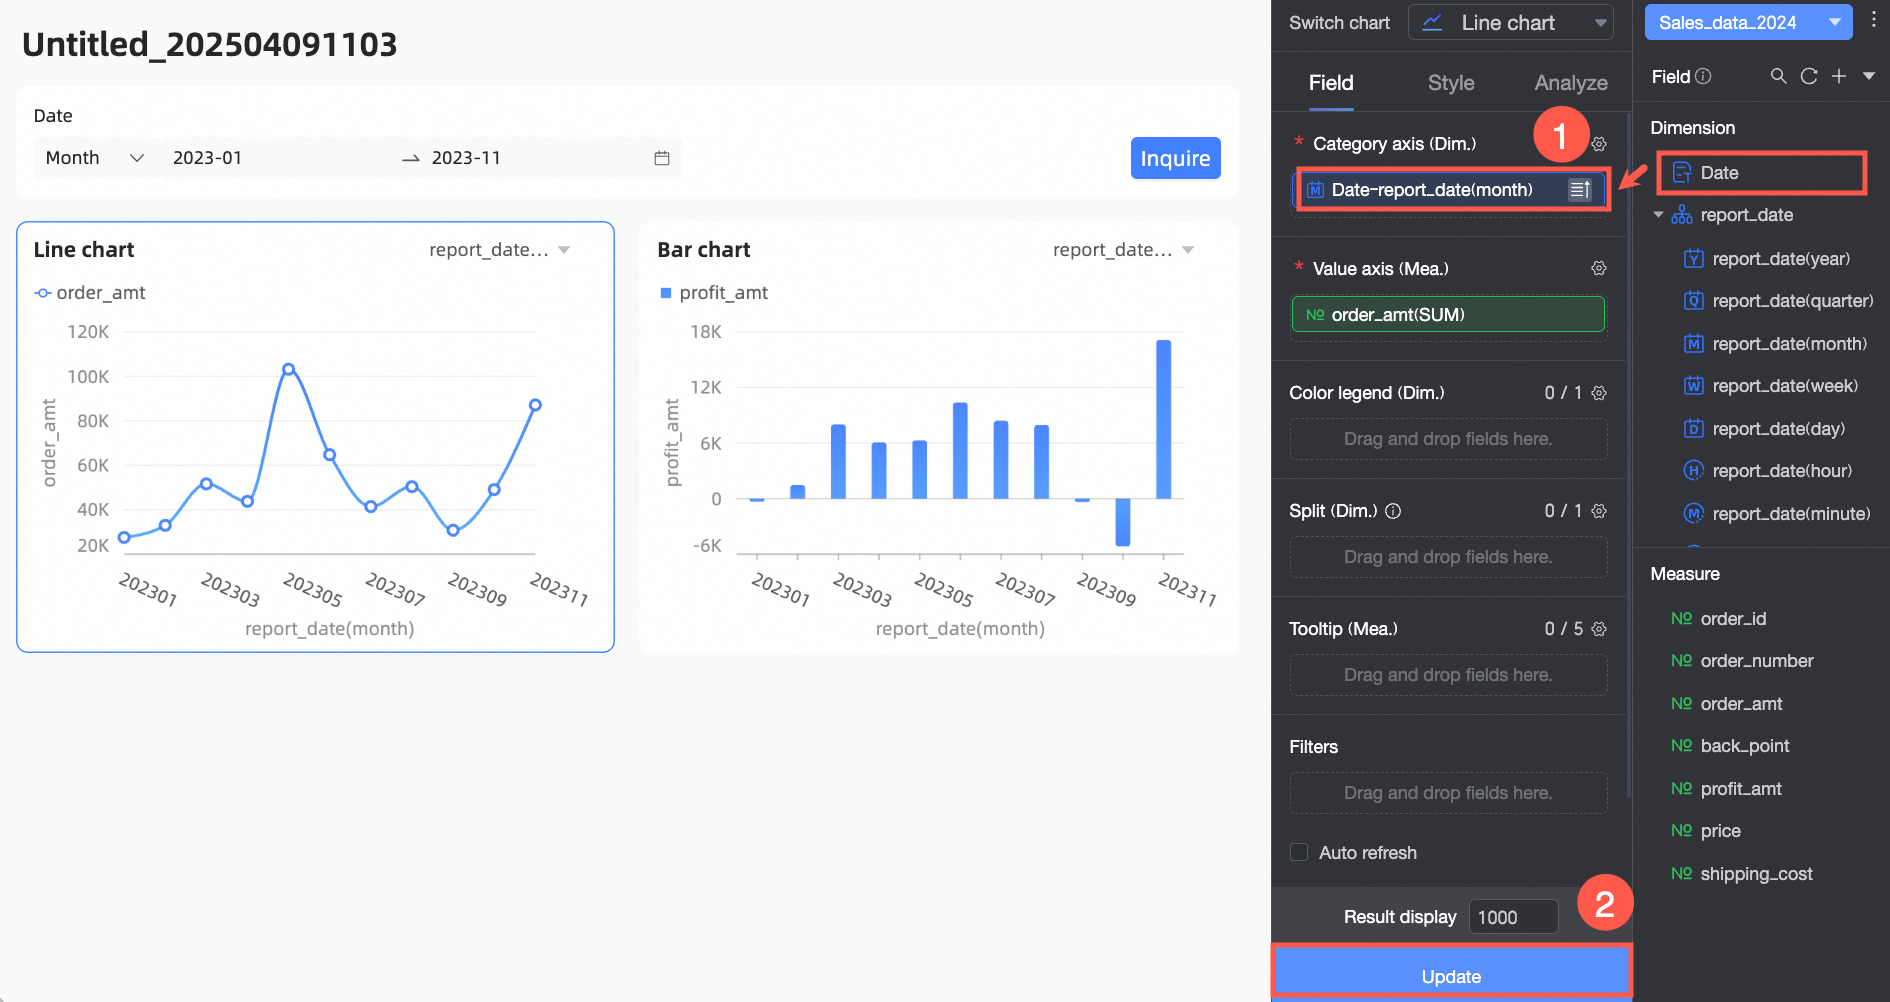
When a date dimension group is configured in the chart's Fields panel, you can set the current filter bar to synchronously control the time dimension displayed in the chart when switching time granularity. To configure this, perform the following steps.
Configure a date dimension group for the chart that needs to be synchronously controlled for time granularity.
In the chart's Data panel, click the
 icon and select New Dimension Group from the dropdown list.
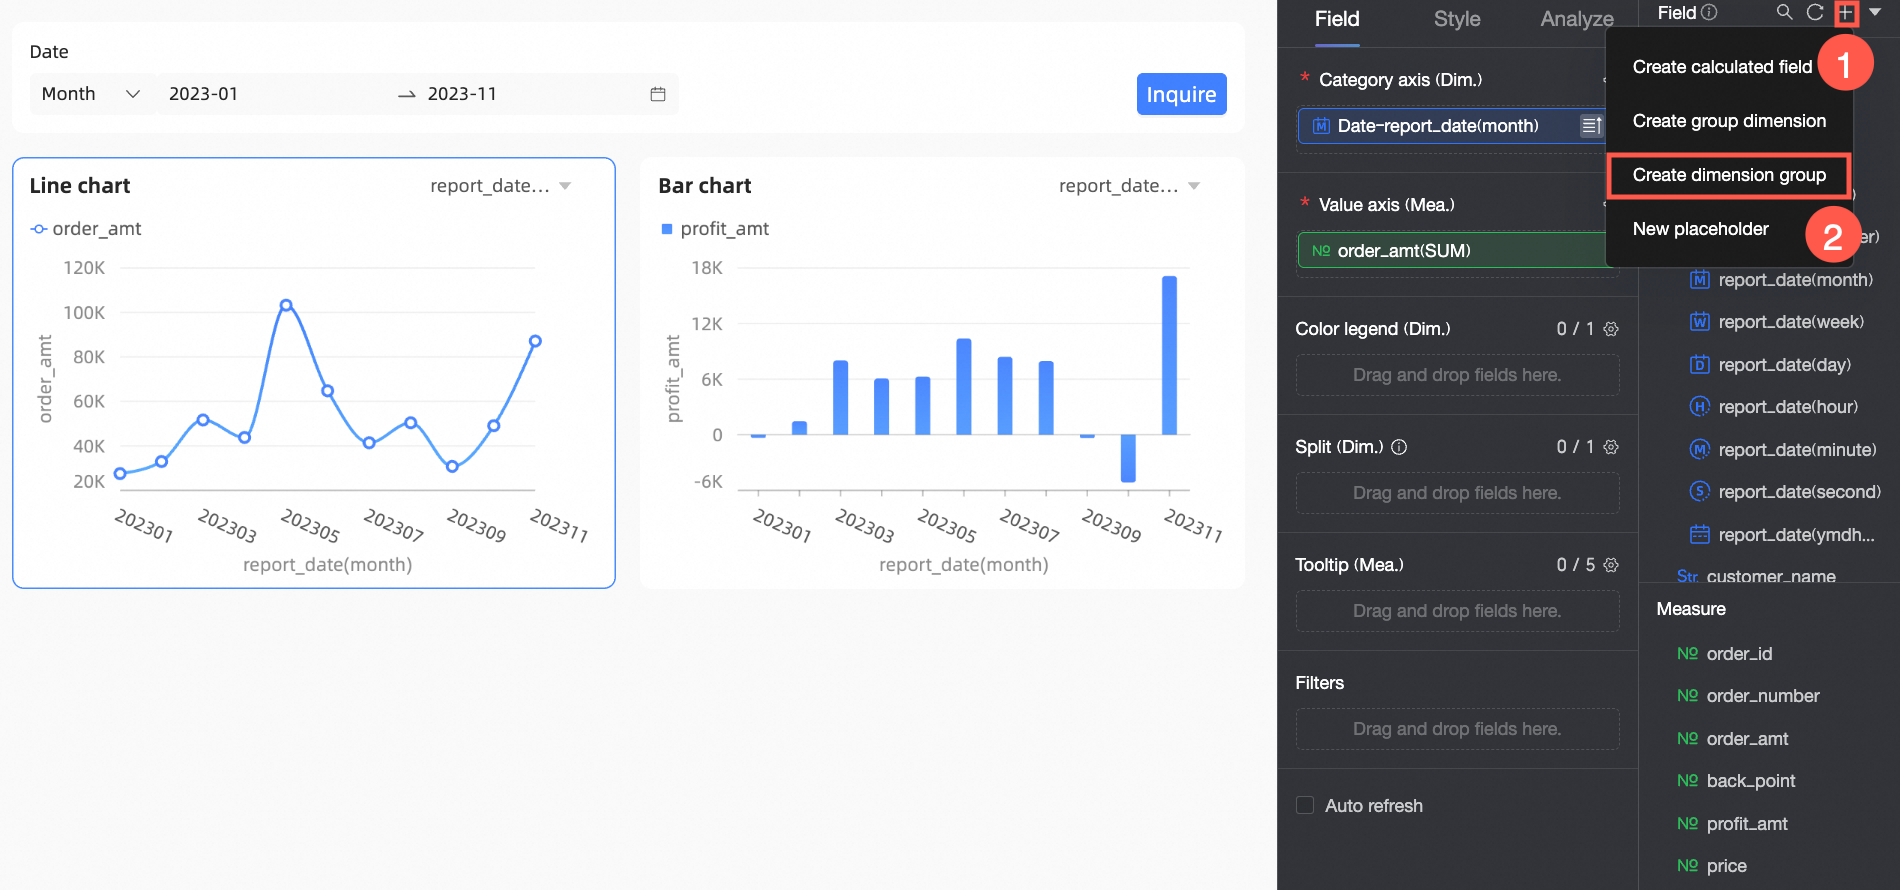
In the New Dimension Group Field dialog box, configure the date field as needed, and then click OK.

Drag the created date dimension group field into the chart's Fields panel, and click Update.
Add a filter bar and set the query conditions on the Query Condition Settings page.
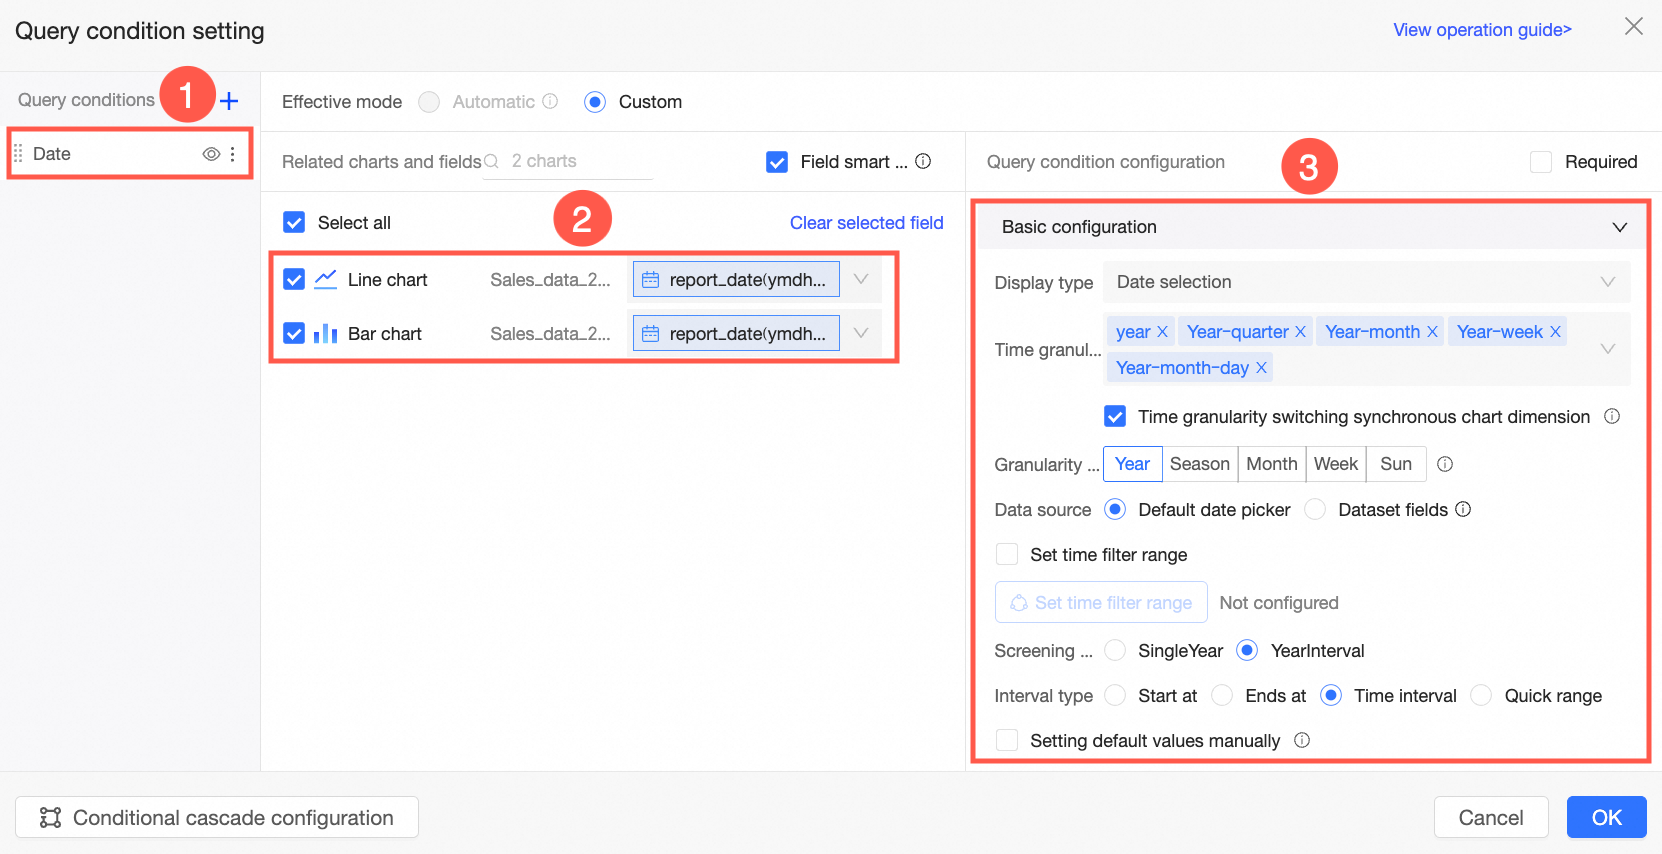
Configuration content
Configuration description
Area ①
Filter bar name
Enter a custom name for the filter bar. You can name it based on its function, for example: Date Filter.
Area ②
Chart and associated fields
Select the charts that need to be synchronously controlled for date granularity by the filter bar, and the YYYYMMDD HH:MM:SS fields that need to be associated.
NoteCharts that are not checked here will not be affected by the time granularity switching in the filter bar. For example, the detail table not checked in the figure.
Charts that are checked here but do not have dimension groups set up will not be affected by the time granularity switching in the filter bar.
Area ③
Basic configuration
You need to select the Time Granularity Switching Synchronously Controls Chart Dimensions option here to ensure that the date granularity values in the filter bar can synchronously take effect in the associated charts. The remaining parameter configurations are the same as those in Date granularity switching controls only the date filter.
NoteMake sure that the charts to be synchronously controlled have the corresponding date dimension group fields configured.
It is recommended that the time granularities in the filter bar correspond one-to-one with the time granularities in the chart dimension group.
After configuration is complete, select the time granularity in the filter bar, set the date range, and click Query. The time granularity displayed in the associated charts will be synchronously switched.
 Note
NoteIf the dataset includes a Fiscal Year configuration, the Fiscal Year Starts At setting in the filter bar follows the dataset's field configuration and cannot be altered. For more details on fiscal year settings, see Create a Dataset.