Automatically instrument a Java application with the OpenTelemetry Java agent and report telemetry data to Managed Service for OpenTelemetry.
Prerequisites
-
Create an Alibaba Cloud accountCreate an Alibaba Cloud account.
-
Activate Managed Service for OpenTelemetry
-
New console
-
Log on to the Managed Service for OpenTelemetry console. In the left-side navigation pane, click Integration Center.
-
On the Integration Center page, click the OpenTelemetry card in the Open Source Frameworks section.
-
In the OpenTelemetry panel, click the Start Integration tab, and then select a region in which you want to report data.
NoteWhen you access a region for the first time, resources are automatically initialized there.
-
Configure the Connection Type and Export Protocol parameters and copy an endpoint.
-
Connection Type: If your service is deployed on Alibaba Cloud and resides in the region that you selected, we recommend that you set this parameter to Alibaba Cloud VPC Network. Otherwise, set this parameter to Public Network.
-
Export Protocol: Set this parameter to HTTP (recommended) or gRPC based on the protocol that is supported by the client.

-
Old console
-
Log on to the Managed Service for OpenTelemetry console.
-
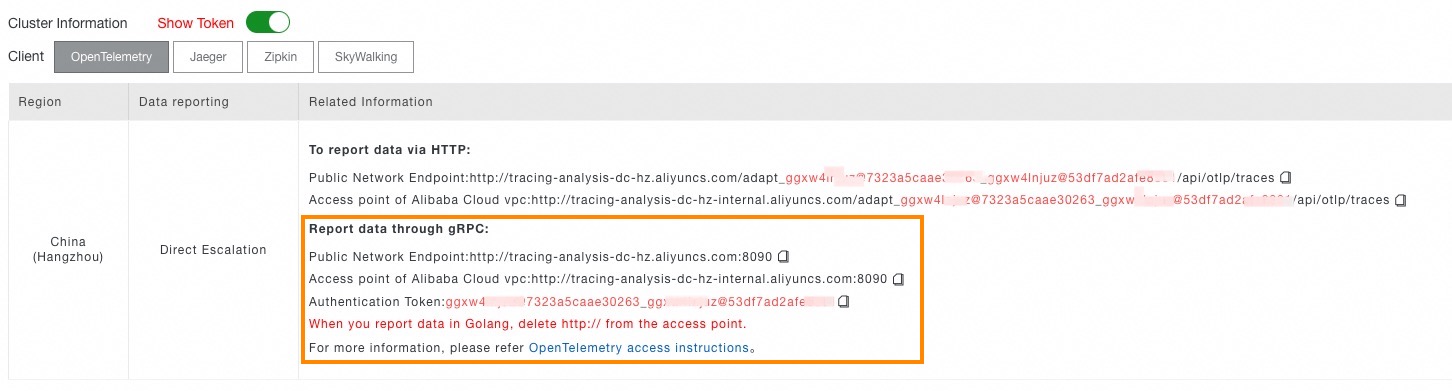
In the left-side navigation pane, click Cluster Configurations. On the page that appears, click the Access point information tab.
-
In the top navigation bar, select a region in which you want to report data. In the Cluster Information section, turn on Show Token.
-
Set the Client parameter to OpenTelemetry.
In the Related Information column of the table, copy an endpoint.
 Note
NoteIf your application is deployed in an Alibaba Cloud production environment, use a VPC endpoint. Otherwise, use a public endpoint.
-
Overview
The trace details page of the legacy console displays the full trace of an HTTP 404 request. The timeline on the left shows five hierarchical spans: GET /** (404, 11.1ms), ResourceHttpRequestHandler.handleRequest (85μs), ResponseFacade.sendError (19μs), BasicErrorController.errorHtml (4.92ms), and Render error (4.34ms). The top section shows the TraceID, start time, total duration, and a red error indicator. The Span Details panel on the right shows the application name java-agent-usage-0.0.1-SNAPSHOT, the interface name BasicErrorController.errorHtml, the spanId, parentSpanId, and attributes such as ali.trace.component_type=98, ali.trace.flag=x-trace, and thread.name=http-nio-8081-exec-1.
This guide uses the OpenTelemetry Java agent with a Java application as an example:
-
Download a demo application: Download the demo to try Managed Service for OpenTelemetry, or instrument your own application.
-
Instrument your application with the OpenTelemetry Java agent: Download the OpenTelemetry Java agent for non-intrusive automatic instrumentation across hundreds of Java frameworks. Modify JVM startup parameters to report traces.
-
View monitoring data: View telemetry data in the Managed Service for OpenTelemetry console or the .
Step 1: Download the demo application
Use the provided demo application or your own Java application.
Download the demo code: OpenTelemetry Java Agent Demo.
The demo package contains three subfolders:
-
java-agent-usage: Automatic instrumentation with the OpenTelemetry Java agent (used in this guide).
-
otel-sdk-usage: Manual instrumentation using the OpenTelemetry SDK for Java.
-
agent-sdk-usage: Instrumentation using both the Java agent and the Java SDK.
Step 2: Instrument the application
The OpenTelemetry Java agent provides non-intrusive automatic instrumentation for hundreds of Java frameworks listed in Supported Libraries and Versions.
-
Download the OpenTelemetry Java Agent.
In the Assets section of the latest release, download the opentelemetry-javaagent.jar file.
-
Modify the VM parameters in your Java startup command to report traces.
-javaagent:/{user.workspace}/opentelemetry-javaagent.jar    // Replace {user.workspace} with the actual path where you downloaded the file.
-Dotel.resource.attributes=service.name=<appName>     // Replace <appName> with your application name.
-Dotel.exporter.otlp.headers=Authentication=<token>    // Use the token from the endpoint information obtained in the prerequisites.
-Dotel.exporter.otlp.endpoint=<endpoint>  // Use the endpoint from the endpoint information obtained in the prerequisites.
For example, if your startup command is:
java -jar /{user.workspace}/java-agent-usage-0.0.1-SNAPSHOT.jarTo connect to Managed Service for OpenTelemetry, update the command to:
java -Dotel.resource.attributes=service.name=java-agent-usage-0.0.1-SNAPSHOT -Dotel.exporter.otlp.headers=Authentication=ggxw4l****@7323a5caae30263_ggxw4l****@53df7ad2afe**** -Dotel.exporter.otlp.endpoint=http://tracing-analysis-dc-hz.aliyuncs.com:8090 -javaagent:/{user.workspace}/opentelemetry-javaagent.jar -jar /{user.workspace}/java-agent-usage-0.0.1-SNAPSHOT.jar
Step 3: View monitoring data
-
Access the demo application at
localhost:8081/user/async. The agent collects and sends telemetry data to Managed Service for OpenTelemetry. -
On the Managed Service for OpenTelemetry console, go to the Applications page, select your application to view traces.
On the application details page, click the Trace Analysis tab to view charts for the number of calls, errors, and average latency. The trace list shows details such as TraceID, Interface Name, Application Name, Latency, Status, Start Time, and Host Address. Use Slow Trace Analysis and Error Trace Analysis to identify factors that cause slow calls.
Next steps
After reporting data to Managed Service for OpenTelemetry, explore these features in Managed Service for OpenTelemetry:
Managed Service for OpenTelemetry supports Java, Go, Python, JavaScript, .NET, C++, and more. Compatible clients include OpenTelemetry, Jaeger, Zipkin, and SkyWalking.