Zipkin is an open source distributed tracing system that was developed by Twitter to trace real-time data. It aggregates real-time monitoring data collected from multiple heterogeneous systems. This guide shows you how to instrument your Java application with the Brave library and report trace data to ARMS Tracing Analysis through a Zipkin-compatible endpoint.
Choose an instrumentation method
Select the method that matches your framework. Spring Sleuth requires the least configuration and is recommended for Spring Boot projects.
| Method | Best for | Complexity |
|---|---|---|
| Spring Sleuth | Spring Cloud microservices (recommended) | Low |
| Spring 4.0 MVC or Spring Boot | Modern Spring annotation-based projects | Medium |
| Spring 2.5 or 3.0 MVC | Legacy Spring XML-based projects | Medium |
| Dubbo | Dubbo RPC applications | Medium |
| Manual instrumentation | Full control over spans and tags | High |
Data flow
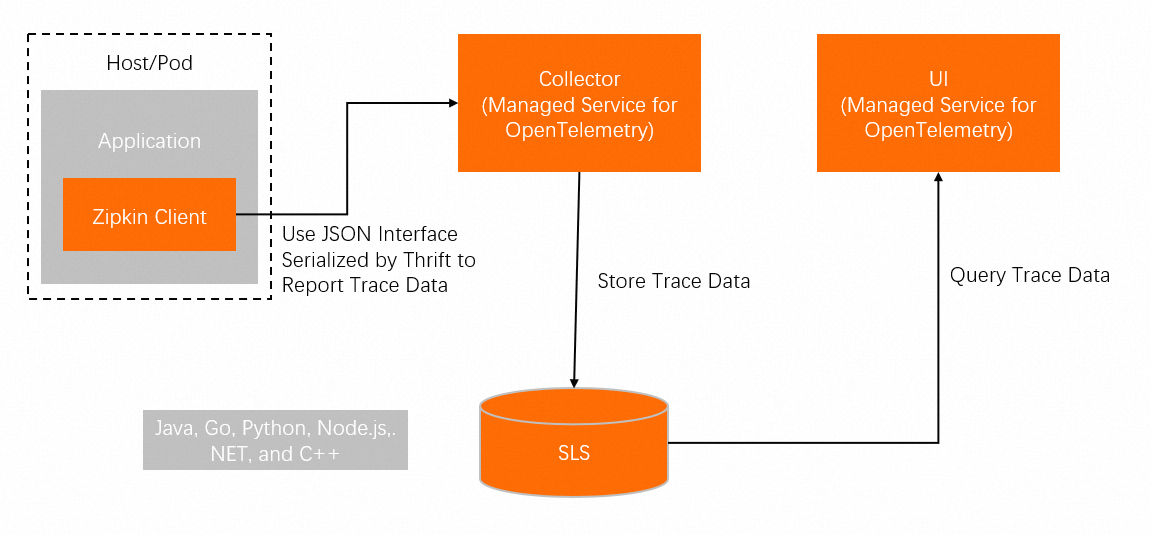
Your application uses the Brave library to create spans and report them to ARMS through a Zipkin-compatible endpoint.
Prerequisites
Get a Zipkin endpoint
To report trace data, you need a Zipkin-compatible endpoint from the Tracing Analysis console.
-
Log on to the Tracing Analysis console.
-
In the left-side navigation pane, click Cluster Configurations. Then, click the Access point information tab.
-
In the top navigation bar, select a region. In the Cluster Information section, turn on Show Token.
-
In the Client section, click Zipkin.
Copy the endpoint from the Related Information column.
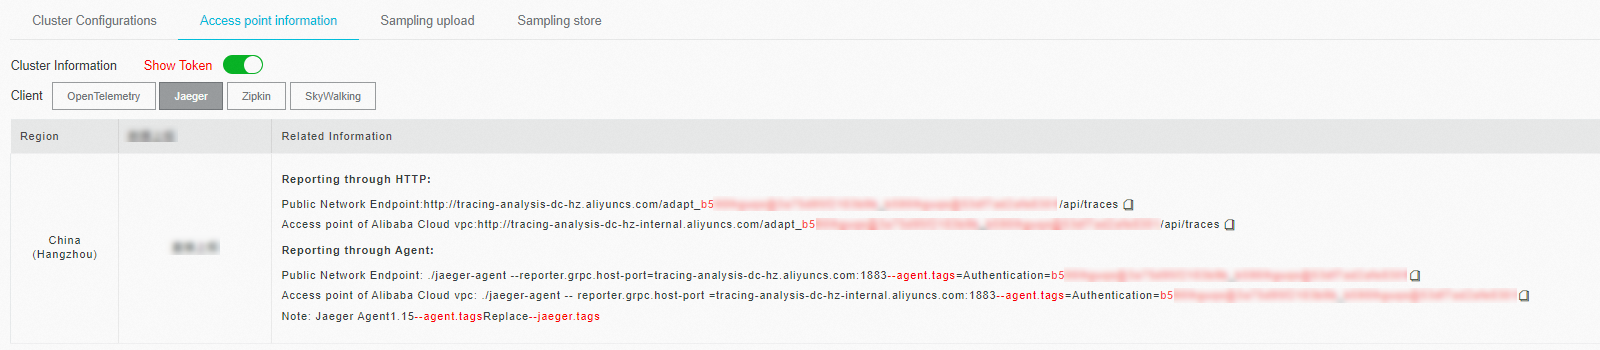
If your application runs in an Alibaba Cloud production environment, use an Alibaba Cloud VPC access point. Otherwise, use a public endpoint.
Use the v2 endpoint unless you have a specific reason to use v1.
Supported frameworks
Brave provides instrumentation for the following Java frameworks. For the full list, see brave-instrumentation.
Apache HttpClient, Dubbo, gRPC, JAX-RS 2.X, Jersey Server, JMS, Kafka, MySQL, Netty, OkHttp, Servlet, Spark, Spring Boot, Spring MVC
Demo project
A working demo is available for each instrumentation method. Download the demo project and follow the README in the corresponding directory.
| Method | Demo directory |
|---|---|
| Manual instrumentation | manualDemo |
| Spring 2.5 or 3.0 MVC | springMvcDemo\webmvc3|webmvc25 |
| Spring 4.0 MVC or Spring Boot | springMvcDemo\webmvc4-boot|webmv4 |
| Dubbo | dubboDemo |
| Spring Sleuth | sleuthDemo |
Instrument with Spring Sleuth
Spring Cloud Sleuth provides automatic distributed tracing for Spring Boot applications with minimal configuration. It integrates natively with Zipkin for trace reporting.
Step 1: Add dependencies
Add the following dependencies to your pom.xml:
<dependency>
    <groupId>io.zipkin.brave</groupId>
    <artifactId>brave</artifactId>
    <version>5.4.2</version>
</dependency>

<dependency>
    <groupId>io.zipkin.reporter2</groupId>
    <artifactId>zipkin-sender-okhttp3</artifactId>
    <version>2.7.9</version>
</dependency>
<dependency>
    <groupId>org.springframework.boot</groupId>
    <artifactId>spring-boot-starter-web</artifactId>
    <version>2.0.1.RELEASE</version>
</dependency>
<dependency>
    <groupId>org.springframework.cloud</groupId>
    <artifactId>spring-cloud-sleuth-core</artifactId>
    <version>2.0.1.RELEASE</version>
</dependency>
<dependency>
    <groupId>org.springframework.cloud</groupId>
    <artifactId>spring-cloud-sleuth-zipkin</artifactId>
    <version>2.0.1.RELEASE</version>
</dependency>
Step 2: Configure application.yml
Set the Zipkin base URL and sampling rate. Replace <endpoint_short> with the public endpoint that ends with api/v2/spans, obtained from the Access point information tab in the Tracing Analysis console.
spring:
   application:
     # This ends up as the service name in zipkin
     name: sleuthDemo
   zipkin:
     # Uncomment to send to zipkin, replacing 192.168.99.100 with your zipkin IP address
     baseUrl: <endpoint_short>

   sleuth:
     sampler:
       probability: 1.0

   sample:
   zipkin:
     # When enabled=false, traces log to the console. Comment to send to zipkin
     enabled: true
Step 3: Verify the setup
Send an HTTP request to trigger trace reporting:
http://localhost:3380/tracedAfter sending the request, check the Tracing Analysis console for incoming trace data. For additional request paths, see the methods under com.alibaba.apm.SampleController in the demo project.
Instrument with Spring 4.0 MVC or Spring Boot
Configure tracing through Java annotations for Spring 4.0 MVC or Spring Boot applications.
For a working example, see the springMvcDemo\webmvc4-boot|webmv4 directory in the demo project.
Step 1: Configure tracing and filter beans
Add the following configuration class. Replace <endpoint> with the endpoint you obtained in Prerequisites.
/** Configuration for how to send spans to Zipkin */
@Bean Sender sender() {
  return OkHttpSender.create("<endpoint>");
}

/** Configuration for how to buffer spans into messages for Zipkin */
@Bean AsyncReporter<Span> spanReporter() {
  return AsyncReporter.create(sender());
}

/** Controls aspects of tracing such as the name that shows up in the UI */
@Bean Tracing tracing(@Value("${spring.application.name}") String serviceName) {
  return Tracing.newBuilder()
      .localServiceName(serviceName)
      .propagationFactory(ExtraFieldPropagation.newFactory(B3Propagation.FACTORY, "user-name"))
      .currentTraceContext(ThreadLocalCurrentTraceContext.newBuilder()
          .addScopeDecorator(MDCScopeDecorator.create()) // puts trace IDs into logs
          .build()
      )
      .spanReporter(spanReporter()).build();
}

/** decides how to name and tag spans. By default they are named the same as the http method. */
@Bean HttpTracing httpTracing(Tracing tracing) {
  return HttpTracing.create(tracing);
}

/** Creates client spans for http requests */
// We are using a BPP as the Frontend supplies a RestTemplate bean prior to this configuration
@Bean BeanPostProcessor connectionFactoryDecorator(final BeanFactory beanFactory) {
  return new BeanPostProcessor() {
    @Override public Object postProcessBeforeInitialization(Object bean, String beanName) {
      return bean;
    }

    @Override public Object postProcessAfterInitialization(Object bean, String beanName) {
      if (!(bean instanceof RestTemplate)) return bean;

      RestTemplate restTemplate = (RestTemplate) bean;
      List<ClientHttpRequestInterceptor> interceptors =
          new ArrayList<>(restTemplate.getInterceptors());
      interceptors.add(0, getTracingInterceptor());
      restTemplate.setInterceptors(interceptors);
      return bean;
    }

    // Lazy lookup so that the BPP doesn't end up needing to proxy anything.
    ClientHttpRequestInterceptor getTracingInterceptor() {
      return TracingClientHttpRequestInterceptor.create(beanFactory.getBean(HttpTracing.class));
    }
  };
}

/** Creates server spans for http requests */
@Bean Filter tracingFilter(HttpTracing httpTracing) {
  return TracingFilter.create(httpTracing);
}

@Autowired SpanCustomizingAsyncHandlerInterceptor webMvcTracingCustomizer;

/** Decorates server spans with application-defined web tags */
@Override public void addInterceptors(InterceptorRegistry registry) {
  registry.addInterceptor(webMvcTracingCustomizer);
}
Step 2: Enable auto-configuration
Add the following line to src/main/resources/META-INF/spring.factories:
org.springframework.boot.autoconfigure.EnableAutoConfiguration=\
brave.webmvc.TracingConfiguration
Instrument with Spring 2.5 or 3.0 MVC
Configure tracing through XML bean definitions for Spring 2.5 or 3.0 MVC applications.
For a working example, see the springMvcDemo\webmvc3|webmvc25 directory in the demo project.
Step 1: Configure the tracing object
Add the following bean definitions to your applicationContext.xml. Replace <endpoint> with the endpoint you obtained in Prerequisites.
<bean class="zipkin2.reporter.beans.OkHttpSenderFactoryBean">
  <property name="endpoint" value="<endpoint>"/>
</bean>

<!-- allows us to read the service name from spring config -->
<context:property-placeholder/>

<bean class="brave.spring.beans.TracingFactoryBean">
  <property name="localServiceName" value="brave-webmvc3-example"/>
  <property name="spanReporter">
    <bean class="zipkin2.reporter.beans.AsyncReporterFactoryBean">
      <property name="encoder" value="JSON_V2"/>
      <property name="sender" ref="sender"/>
      <!-- wait up to half a second for any in-flight spans on close -->
      <property name="closeTimeout" value="500"/>
    </bean>
  </property>
  <property name="propagationFactory">
    <bean class="brave.propagation.ExtraFieldPropagation" factory-method="newFactory">
      <constructor-arg index="0">
        <util:constant static-field="brave.propagation.B3Propagation.FACTORY"/>
      </constructor-arg>
      <constructor-arg index="1">
        <list>
          <value>user-name</value>
        </list>
      </constructor-arg>
    </bean>
  </property>
  <property name="currentTraceContext">
    <bean class="brave.spring.beans.CurrentTraceContextFactoryBean">
      <property name="scopeDecorators">
        <bean class="brave.context.log4j12.MDCScopeDecorator" factory-method="create"/>
      </property>
    </bean>
  </property>
</bean>

<bean class="brave.spring.beans.HttpTracingFactoryBean">
  <property name="tracing" ref="tracing"/>
</bean>
Step 2: Add interceptors
Register the tracing HTTP client builder and handler interceptor:
<bean class="brave.httpclient.TracingHttpClientBuilder"
      factory-method="create">
    <constructor-arg type="brave.http.HttpTracing" ref="httpTracing"/>
  </bean>

  <bean factory-bean="httpClientBuilder" factory-method="build"/>

  <bean class="org.springframework.web.servlet.mvc.annotation.DefaultAnnotationHandlerMapping">
    <property name="interceptors">
      <list>
        <bean class="brave.spring.webmvc.SpanCustomizingHandlerInterceptor"/>
      </list>
    </property>
  </bean>

  <!-- Loads the controller -->
  <context:component-scan base-package="brave.webmvc"/>
Step 3: Add a servlet filter
Add the tracing filter to your web.xml to intercept all incoming requests:
<!-- Add the delegate to the standard tracing filter and map it to all paths -->
<filter>
  <filter-name>tracingFilter</filter-name>
  <filter-class>brave.spring.webmvc.DelegatingTracingFilter</filter-class>
</filter>
<filter-mapping>
  <filter-name>tracingFilter</filter-name>
  <url-pattern>/*</url-pattern>
</filter-mapping>
Instrument with Dubbo
The Brave Dubbo instrumentation library adds distributed tracing to Dubbo RPC applications.
For a working example, see the dubboDemo directory in the demo project.
Step 1: Add dependencies
Add the following dependencies to your pom.xml:
<dependency>
    <groupId>io.zipkin.brave</groupId>
    <artifactId>brave</artifactId>
    <version>5.4.2</version>
</dependency>

<dependency>
    <groupId>io.zipkin.brave</groupId>
    <artifactId>brave-instrumentation-dubbo-rpc</artifactId>
    <version>5.4.2</version>
</dependency>

<dependency>
    <groupId>io.zipkin.brave</groupId>
    <artifactId>brave-spring-beans</artifactId>
    <version>5.4.2</version>
</dependency>

<dependency>
    <groupId>io.zipkin.brave</groupId>
    <artifactId>brave-context-slf4j</artifactId>
    <version>5.4.2</version>
</dependency>

<dependency>
    <groupId>io.zipkin.reporter2</groupId>
    <artifactId>zipkin-sender-okhttp3</artifactId>
    <version>2.7.9</version>
</dependency>
Step 2: Configure the tracing object
Add the following bean definitions to your Spring XML configuration. Replace <endpoint> with the endpoint you obtained in Prerequisites.
<bean class="zipkin2.reporter.beans.OkHttpSenderFactoryBean">
    <property name="endpoint" value="<endpoint>"/>
</bean>

<bean class="brave.spring.beans.TracingFactoryBean">
    <property name="localServiceName" value="double-provider"/>
    <property name="spanReporter">
        <bean class="zipkin2.reporter.beans.AsyncReporterFactoryBean">
            <property name="sender" ref="sender"/>
            <!-- wait up to half a second for any in-flight spans on close -->
            <property name="closeTimeout" value="500"/>
        </bean>
    </property>
    <property name="currentTraceContext">
        <bean class="brave.spring.beans.CurrentTraceContextFactoryBean">
            <property name="scopeDecorators">
                <bean class="brave.context.slf4j.MDCScopeDecorator" factory-method="create"/>
            </property>
        </bean>
    </property>
</bean>
Step 3: Add tracing filters
Apply the tracing filter to both provider and consumer configurations:
// Server configuration
<dubbo:provider filter="tracing" />
// Client configuration
<dubbo:consumer filter="tracing" />
Manually instrument a Java application
Manual instrumentation gives you fine-grained control over which operations are traced and what metadata is attached to each span. Use this method when automatic instrumentation does not cover your framework or when you need custom span granularity.
For a working example, see the manualDemo directory in the demo project.
Step 1: Add dependencies
Add the following dependencies to your pom.xml:
<dependency>
    <groupId>io.zipkin.brave</groupId>
    <artifactId>brave</artifactId>
    <version>5.4.2</version>
</dependency>
<dependency>
    <groupId>io.zipkin.reporter2</groupId>
    <artifactId>zipkin-sender-okhttp3</artifactId>
    <version>2.7.9</version>
</dependency>
Step 2: Create a tracer
Initialize the tracer with your Zipkin endpoint. Replace <endpoint> with the endpoint you obtained in Prerequisites.
private static final String zipkinEndPoint = "<endpoint>";
...
// Create a sender to transmit span data
OkHttpSender sender = OkHttpSender.newBuilder().endpoint(zipkinEndPoint).build();

// Create an asynchronous reporter
Reporter<Span> reporter = AsyncReporter.builder(sender).build();

tracing = Tracing.newBuilder().localServiceName(localServiceName).spanReporter(reporter).build();
Step 3: Create spans
Create a root span and nest child spans to represent sub-operations:
private void firstBiz() {
    // Create a root span
    tracing.tracer().startScopedSpan("parentSpan");
    Span span =  tracing.tracer().currentSpan();
    span.tag("key", "firstBiz");
    secondBiz();
    span.finish();
}

private void secondBiz() {
    tracing.tracer().startScopedSpanWithParent("childSpan", tracing.tracer().currentSpan().context());
    Span childSpan =  tracing.tracer().currentSpan();
    childSpan.tag("key", "secondBiz");
    childSpan.finish();
    System.out.println("end tracing,id:" + childSpan.context().traceIdString());
}
Step 4: Add custom tags (optional)
Attach metadata to spans for easier troubleshooting. For example, record an HTTP status code:
tracer.activeSpan().setTag("http.status_code", "500");Step 5: Propagate trace context across services
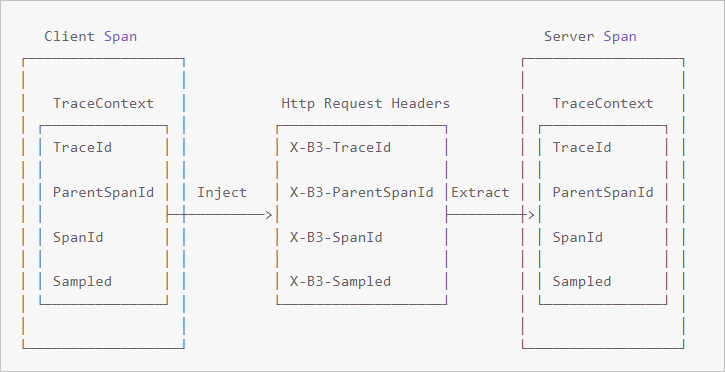
In distributed systems, trace context (TraceId, ParentSpanId, SpanId, Sampled) must travel with each RPC request. Call Inject on the client to embed context into request headers, and call Extract on the server to read it back.
Client side -- inject context
// Start a new span representing a client request
oneWaySend = tracer.nextSpan().name(service + "/" + method).kind(CLIENT);
--snip--

// Add the trace context to the request, so it can be propagated in-band
tracing.propagation().injector(Request::addHeader)
                 .inject(oneWaySend.context(), request);

// Fire off the request asynchronously, totally dropping any response
request.execute();

// Start the client side and flush instead of finish
oneWaySend.start().flush();
Server side -- extract context
// Pull the context out of the incoming request
extractor = tracing.propagation().extractor(Request::getHeader);

// Convert that context to a span which you can name and add tags to
oneWayReceive = nextSpan(tracer, extractor.extract(request))
    .name("process-request")
    .kind(SERVER)
    ... add tags etc.

// Start the server side and flush instead of finish
oneWayReceive.start().flush();

// You should not modify this span anymore as it is complete. However,
// you can create children to represent follow-up work.
next = tracer.newSpan(oneWayReceive.context()).name("step2").start();
FAQ
Q: No trace data appears after running the demo.
A: This usually indicates an incorrect endpoint configuration. To diagnose the issue:
-
Verify that the endpoint matches the one shown on the Access point information tab of the Tracing Analysis console.
-
Make sure you selected the correct client type (Zipkin, not Jaeger) when copying the endpoint.
-
If you use a VPC access point, confirm that your application runs within the same VPC.
-
To debug further, set a breakpoint in the
parseResponsemethod ofzipkin2.reporter.okhttp3.HttpCalland inspect the HTTP response. A403error indicates that the username configuration is invalid. Check your endpoint configuration.