Instrument a C++ application with Jaeger to report trace data to Managed Service for OpenTelemetry. After integration, you can view topology maps, distributed traces, abnormal and slow transactions, and SQL analysis in the console.
We recommend that you connect your application to Managed Service for OpenTelemetry by using OpenTelemetry Protocol (OTLP). In this case, you are provided with more features, more advanced tracing capabilities, and the best user experience. Alibaba Cloud provides detailed instructions on how to integrate OpenTelemetry with an application and the best practices of using OpenTelemetry to help you quickly get started with Managed Service for OpenTelemetry. For more information, see Preparations.
How data reporting works
Trace data flows from your application to Managed Service for OpenTelemetry through one of two paths:
Without Jaeger Agent: Your application sends trace data directly to the Managed Service for OpenTelemetry backend.

With Jaeger Agent: Your application sends trace data to a local Jaeger Agent, which forwards it to the backend.

Prerequisites
Before you begin, make sure that you have:
A C++ compiler with GCC 4.9.2 or later
CMake installed
An endpoint from the Managed Service for OpenTelemetry console (see Obtain an endpoint)
Obtain an endpoint
Obtain an endpoint from the Managed Service for OpenTelemetry console.
New console
Log on to the Managed Service for OpenTelemetry console.
In the left-side navigation pane, click Integration Center.
On the Integration Center page, in the Open Source Frameworks section, click the Jaeger card.
In the Jaeger panel, click the Start Integration tab, and then select the region where you want to report data.
NoteWhen you access a region for the first time, resources are automatically initialized.
Set Connection Type and Export Protocol, and then copy the endpoint.
Parameter Guidance Connection Type If your service runs on Alibaba Cloud in the selected region, select Alibaba Cloud VPC Network. Otherwise, select Public Network. Export Protocol Select HTTP (recommended) or gRPC, depending on the protocol your client supports. 
Old console
Log on to the Managed Service for OpenTelemetry console.
In the left-side navigation pane, click Cluster Configurations. On the page that appears, click the Access point information tab.
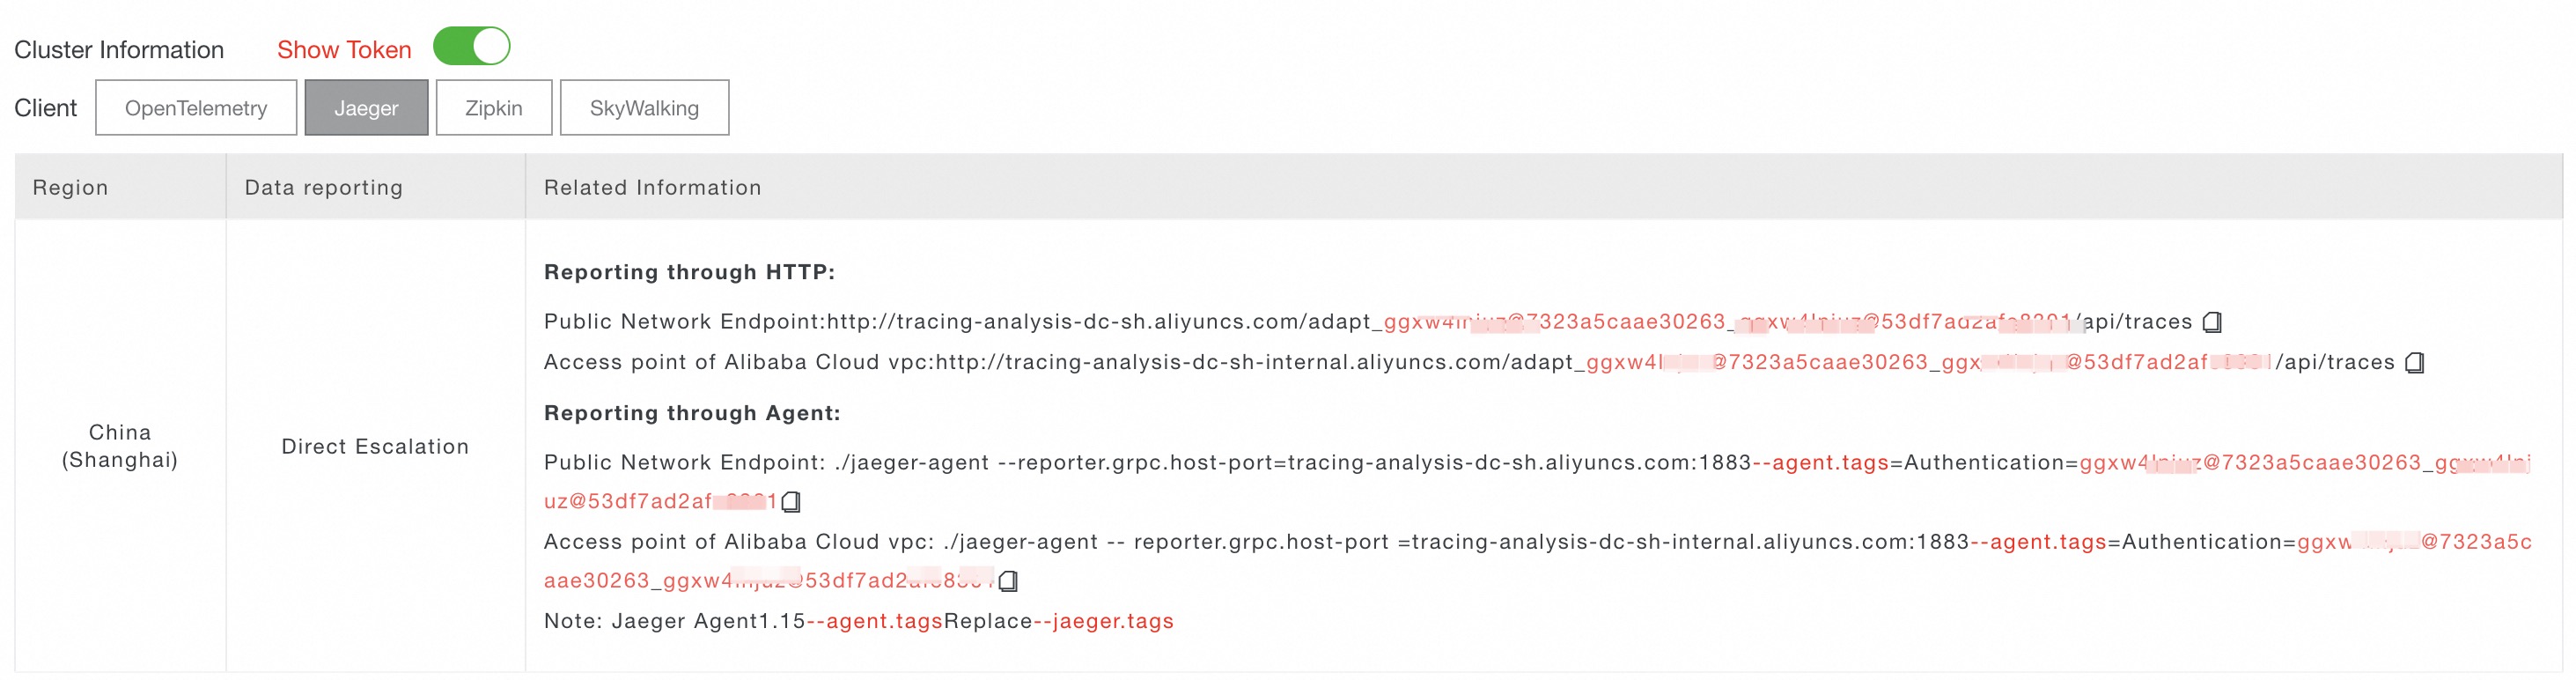
In the top navigation bar, select the region where you want to report data. In the Cluster Information section, turn on Show Token.
Set Client to Jaeger. In the Related Information column, copy an endpoint.
NoteIf your application runs in an Alibaba Cloud production environment, use a VPC endpoint. Otherwise, use a public endpoint.
Run the example project
Follow these steps to download the Jaeger C++ client, build the example project, start the Jaeger Agent, and verify that traces appear in the console.
Step 1: Download and build jaeger-client-cpp
Download and extract the source code:
wget https://github.com/jaegertracing/jaeger-client-cpp/archive/master.zip && unzip master.zipExtract the package and enter the directory. Then, build the project:
NoteThe build requires CMake and GCC 4.9.2 or later.
mkdir build
cd build
cmake ..
make
Step 2: Start the Jaeger Agent
Download Jaeger Agent and start it with your endpoint:
nohup ./jaeger-agent --reporter.grpc.host-port=tracing-analysis-dc-sz.aliyuncs.com:1883 --jaeger.tags=<endpoint>Replace the following placeholder with your actual value:
| Placeholder | Description | Example |
|---|---|---|
<endpoint> | The endpoint obtained from the console. Varies by region. | tracing-analysis-dc-sz.aliyuncs.com:1883 |
Step 3: Run the example
From the build directory, run the included example:
./app ../examples/config.ymlWhen reporter.logSpans is set to true in the configuration file, the application logs each span to the console.
Step 4: Verify traces
Open the Managed Service for OpenTelemetry console and go to the Applications page. Click the application name to view its trace data, including topology, traces, and transaction analysis. If traces do not appear within a few minutes, verify that the Jaeger Agent started without errors and that the endpoint is correct.
Instrument your application
To integrate Jaeger tracing into your own C++ application, create a Tracer, configure it, and create spans to capture operations.
Create a Tracer
A Tracer generates spans that represent units of work. Initialize it from a YAML configuration file and register it as the global tracer:
#include <jaegertracing/Tracer.h>
#include <yaml-cpp/yaml.h>

void setUpTracer(const char* configFilePath)
{
    auto configYAML = YAML::LoadFile(configFilePath);

    // Parse the Jaeger configuration from the YAML file.
    auto config = jaegertracing::Config::parse(configYAML);

    // Create a tracer with a service name and console logger.
    auto tracer = jaegertracing::Tracer::make(
        "example-service", config, jaegertracing::logging::consoleLogger());

    // Register the tracer as a global instance.
    opentracing::Tracer::InitGlobal(
        std::static_pointer_cast<opentracing::Tracer>(tracer));
}
Use the following YAML configuration:
disabled: false
reporter:
  logSpans: true
sampler:
  type: const
param: 1| Parameter | Description |
|---|---|
disabled | Set to false to enable tracing. |
reporter.logSpans | Set to true to log spans to the console. |
sampler.type | Sampling strategy. const samples every trace. |
sampler.param | Sampling parameter. 1 means sample all traces; 0 means sample none. |
Create spans
Spans represent individual operations within a trace. Create root spans for top-level operations and child spans for sub-operations:
#include <opentracing/tracer.h>

// Create a child span under an existing parent span.
void tracedSubroutine(const std::unique_ptr<opentracing::Span>& parentSpan)
{
    auto span = opentracing::Tracer::Global()->StartSpan(
        "tracedSubroutine",
        { opentracing::ChildOf(&parentSpan->context()) });
}

// Create a root span (no parent).
void tracedFunction()
{
    auto span = opentracing::Tracer::Global()->StartSpan("tracedFunction");
    tracedSubroutine(span);
}
After the Jaeger Agent is running (see Step 2: Start the Jaeger Agent), spans are automatically reported to Managed Service for OpenTelemetry.