The SkyWalking Node.js agent (skywalking-backend-js) automatically instruments your Node.js application and reports trace data to Managed Service for OpenTelemetry. After setup, you can view application topology, traces, abnormal and slow transactions, and SQL analysis in the console.
Prerequisites
Before you begin, make sure you have:
Node.js installed
An endpoint and authentication token from the Managed Service for OpenTelemetry console (see the Get an endpoint section below)
Step 1: Install the agent
In your Node.js project directory, run:
npm install --save skywalking-backend-jsStep 2: Initialize the agent
Import and start the agent at the very top of your application entry file, before any other require or import statements.
The agent patches module loading to enable automatic instrumentation. If you import it after other modules, those modules will not be instrumented. This is the most common cause of missing trace data.
// MUST be the first import in your application
const { default: agent } = require("skywalking-backend-js");

agent.start({
  // Service name displayed in the Managed Service for OpenTelemetry console
  serviceName: "<your-service-name>",
  // Endpoint from the console (see Prerequisites)
  collectorAddress: "<your-collector-endpoint>",
  // Authentication token from the console
  authorization: "<your-auth-token>",
});

// All other imports go below
const express = require("express");
// ...
Replace the placeholders with your actual values:
| Placeholder | Description | Example |
|---|---|---|
<your-service-name> | Name that identifies your application in the console | my-node-app |
<your-collector-endpoint> | Endpoint copied from the console | See the Get an endpoint section below |
<your-auth-token> | Authentication token from the console | See the Get an endpoint section below |
Alternative: use environment variables (recommended)
Set the following environment variables instead of hardcoding values in source code:
export SW_AGENT_COLLECTOR_BACKEND_SERVICES=<your-collector-endpoint>
export SW_AGENT_AUTHENTICATION=<your-auth-token>
export SW_AGENT_NAME=<your-service-name>
Then start the agent without configuration parameters:
const { default: agent } = require("skywalking-backend-js");
agent.start({});
The following table maps each environment variable to its corresponding configuration parameter:
| Environment variable | Configuration parameter | Description |
|---|---|---|
SW_AGENT_COLLECTOR_BACKEND_SERVICES | collectorAddress | Endpoint of the collector |
SW_AGENT_AUTHENTICATION | authorization | Authentication token |
SW_AGENT_NAME | serviceName | Application name in the console |
This approach keeps credentials out of source code and is recommended for production deployments.
Step 3: Verify the setup
Restart your Node.js application.
Send a few requests to your application to generate trace data.
Open the Managed Service for OpenTelemetry console and check for your service name in the application list.
Trace data typically appears within a few minutes. If your service does not appear, verify that:
The agent import is the first
requirestatement in your entry fileThe endpoint and token values are correct
Your application can reach the collector endpoint over the network
Sample code
For a complete working example, see the skywalking-demo repository on GitHub.
Get an endpoint
Get your endpoint and authentication token from the Managed Service for OpenTelemetry console before instrumenting your application.
New console
Log on to the Managed Service for OpenTelemetry console. In the left-side navigation pane, click Integration Center.
On the Integration Center page, click the SkyWalking card in the Open Source Frameworks section.
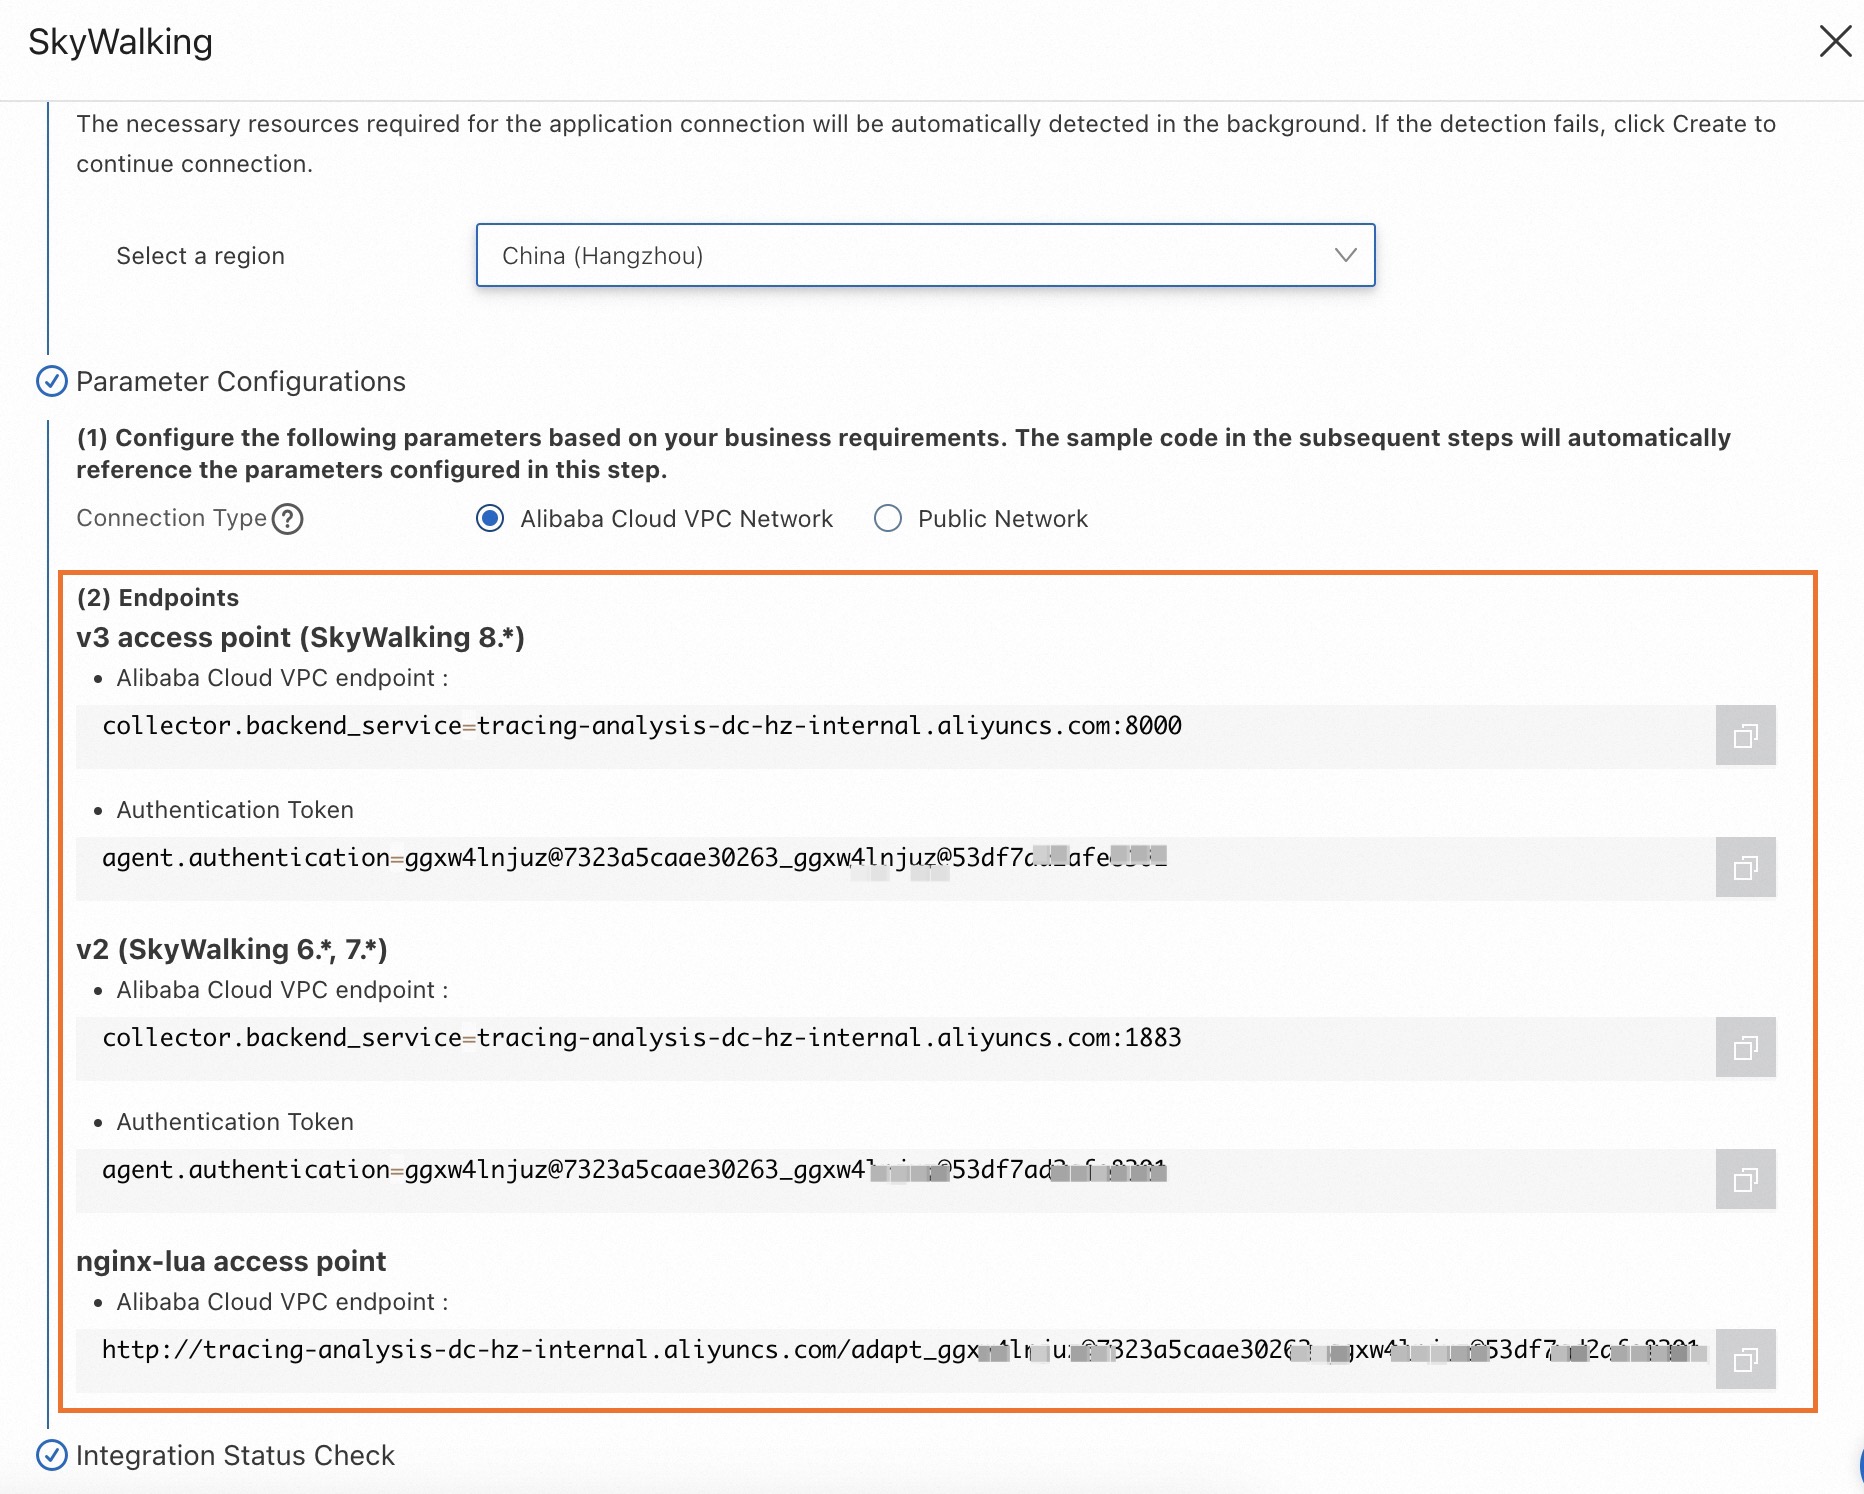
In the SkyWalking panel, click the Start Integration tab, and then select the region where you want to report data.
NoteWhen you access a region for the first time, resources are automatically initialized there.
Configure the Connection Type parameter and copy the endpoint.
If your service runs on Alibaba Cloud in the selected region, select Alibaba Cloud VPC Network.
Otherwise, select Public Network.
Old console
Log on to the Managed Service for OpenTelemetry console.
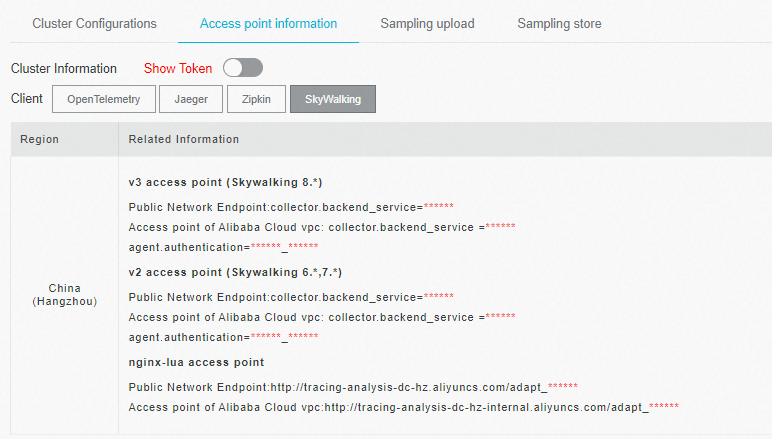
In the left-side navigation pane, click Cluster Configurations. On the page that appears, click the Access point information tab.
In the top navigation bar, select the region where you want to report data. In the Cluster Information section, turn on Show Token.
Set the Client parameter to SkyWalking. In the Related Information column, copy the endpoint.
NoteIf your application runs in an Alibaba Cloud production environment, use a VPC endpoint. Otherwise, use a public endpoint.
Background
SkyWalking is an open-source Application Performance Monitoring (APM) and distributed tracing system originally developed in China. It is designed for microservices, cloud-native architectures, and container-based environments (Docker, Kubernetes, Mesos).
skywalking-backend-js is the current official SkyWalking Node.js agent. It replaces the discontinued skyapm-nodejs package.