When you need distributed tracing for your Go services, Managed Service for OpenTelemetry can collect trace data through the Jaeger client. You instrument your Go application once, choose a reporting method, and traces appear in the console for analysis.
Two reporting methods are available:
| Method | Transport | Best for |
|---|---|---|
| Jaeger SDK (recommended) | HTTP direct to endpoint | Simple deployments where each service manages its own reporting. No additional components to install. |
| Jaeger agent | UDP to a local agent, then forwarded to the endpoint | Production environments where you want to decouple trace transport from your application, or when multiple services share a single agent. |
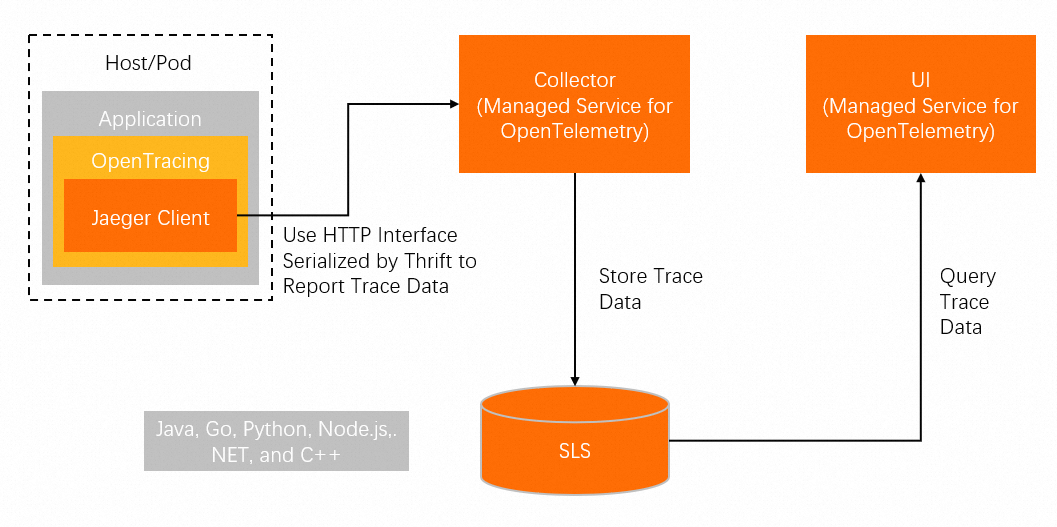
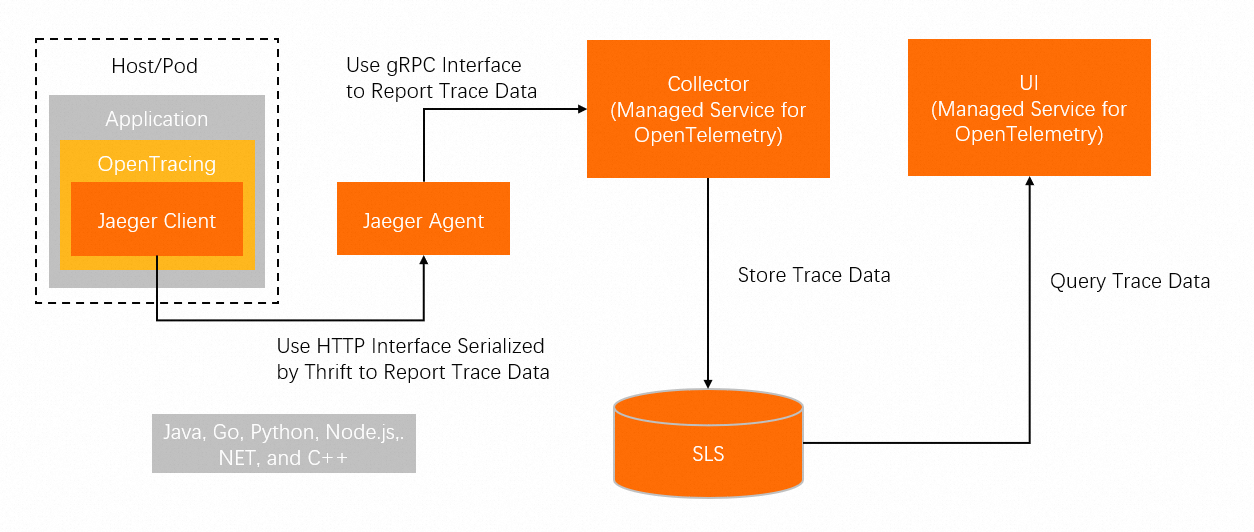
The following diagrams show the data flow for each method.
Direct reporting without the Jaeger agent:
Reporting through the Jaeger agent:
Get a Jaeger endpoint
Before you instrument your application, get the endpoint that the Jaeger client sends traces to.
Log on to the Managed Service for OpenTelemetry console.
In the left-side navigation pane, click Cluster Configurations. Then, click the Access point information tab.
In the top navigation bar, select a region. In the Cluster Information section, turn on Show Token.
In the Client section, click Jaeger or Zipkin.
Copy the endpoint from the Related Information column.
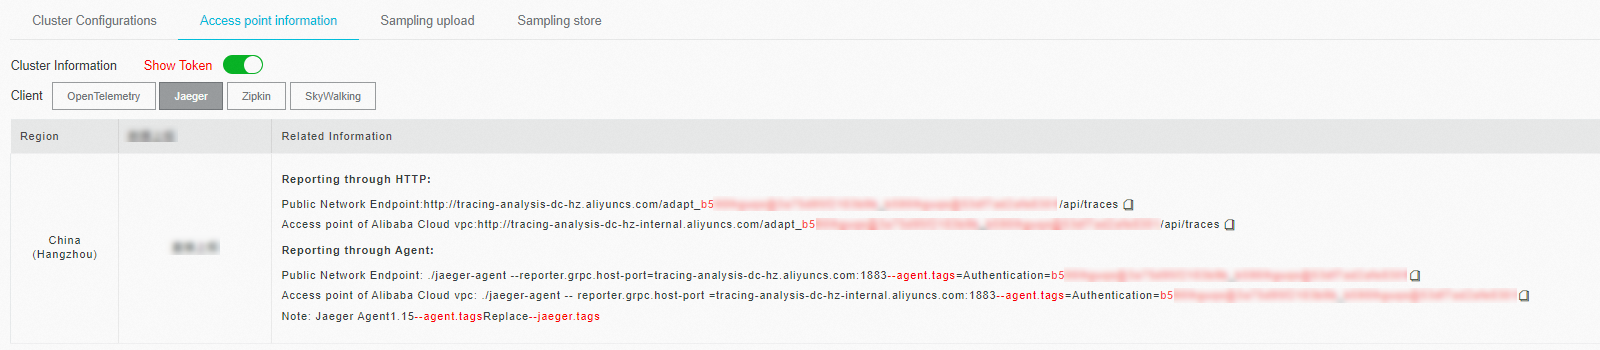
Use a Virtual Private Cloud (VPC) endpoint if your application runs in an Alibaba Cloud production environment. Use a public endpoint for all other environments. For Zipkin, use the v2 endpoint unless you have a specific reason to use v1.
Install the Jaeger client library
Both reporting methods use the same Go client library. Install it with Go modules:
go get github.com/uber/jaeger-client-goInitialize the tracer
Choose one of the following options based on the reporting method you selected.
Option A: Direct reporting with the Jaeger SDK
Create a tracer that sends spans over HTTP directly to the Managed Service for OpenTelemetry endpoint:
import (
    "io"

    "github.com/opentracing/opentracing-go"
    "github.com/uber/jaeger-client-go"
    "github.com/uber/jaeger-client-go/transport"
)

func NewJaegerTracer(service string) (opentracing.Tracer, io.Closer) {
    sender := transport.NewHTTPTransport(
        // Replace with the endpoint from the Access point information tab.
        // Use a VPC endpoint for production; use a public endpoint otherwise.
        "<endpoint>",
    )

    tracer, closer := jaeger.NewTracer(
        service,
        jaeger.NewConstSampler(true),
        jaeger.NewRemoteReporter(sender),
    )
    return tracer, closer
}
Replace the following placeholder with your actual value:
| Placeholder | Description | Example |
|---|---|---|
<endpoint> | Jaeger endpoint from the Access point information tab | http://tracing-analysis-dc-hz.aliyuncs.com/... |
Option B: Reporting through the Jaeger agent
Before you create the tracer, install and start the Jaeger agent. See Install the Jaeger agent.
Then create a tracer that sends spans over UDP to the local agent:
import (
    "io"

    "github.com/opentracing/opentracing-go"
    "github.com/uber/jaeger-client-go"
)

func NewJaegerTracer(serviceName string) (opentracing.Tracer, io.Closer) {
    sender, _ := jaeger.NewUDPTransport("", 0)

    tracer, closer := jaeger.NewTracer(
        serviceName,
        jaeger.NewConstSampler(true),
        jaeger.NewRemoteReporter(sender),
    )
    return tracer, closer
}
Create spans and propagate context
After initializing the tracer, create spans to capture operations in your application.
Start a root span
Use this pattern at the entry point of an incoming request, where no parent span exists:
// Start a new root span for the operation.
span := tracer.StartSpan("myspan")
// Always call Finish() to flush the span to the reporter when the function returns.
defer span.Finish()

// Attach metadata to the span for filtering and analysis in the console.
clientSpan.SetTag("mytag", "123")

// Inject the trace context into outgoing HTTP headers
// so downstream services can continue the trace.
tracer.Inject(span.Context(), opentracing.HTTPHeaders, opentracing.HTTPHeadersCarrier(req.Header))
Continue a trace from an incoming request
Use this pattern when handling a request from an already-instrumented upstream service:
// Extract the trace context from the incoming HTTP or RPC request headers.
spanCtx, _ := tracer.Extract(opentracing.HTTPHeaders, opentracing.HTTPHeadersCarrier(r.Header))

// Create a child span linked to the extracted parent context.
span := tracer.StartSpan("myspan", opentracing.ChildOf(spanCtx))
defer span.Finish()
For the full API reference, see Jaeger Bindings for Go OpenTracing API.
Run the demo
A prebuilt demo application covers both reporting methods. Download and configure it to verify your setup.
Download and extract the demo:
wget https://arms-apm-cn-hangzhou.oss-cn-hangzhou.aliyuncs.com/demo/tracing-demo.zip && unzip tracing-demo.zipOpen
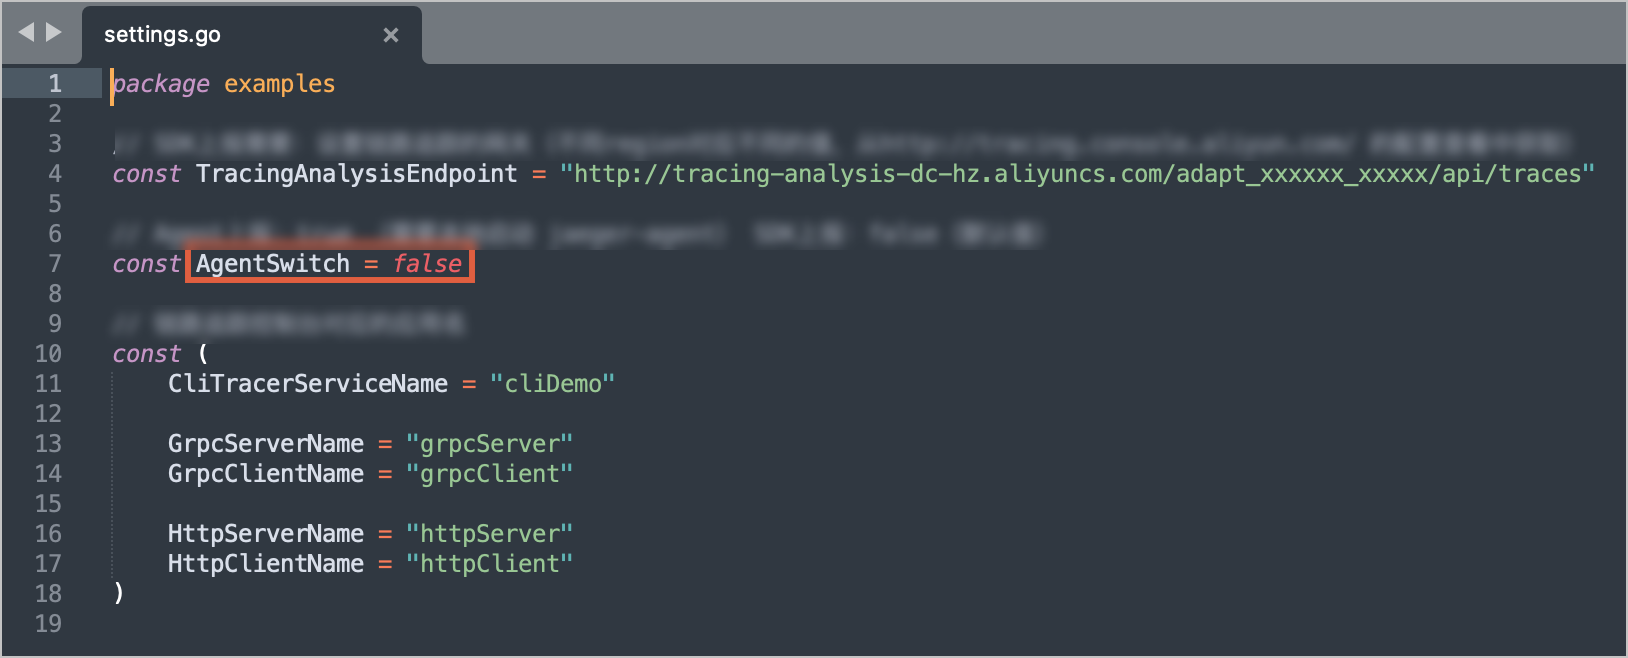
examples/settings.goand configure the demo for your reporting method: For direct SDK reporting, setTracingAnalysisEndpointto the endpoint you obtained in Get a Jaeger endpoint. For Jaeger agent reporting, start the Jaeger agent first (see Install the Jaeger agent), then setAgentSwitchtotrue.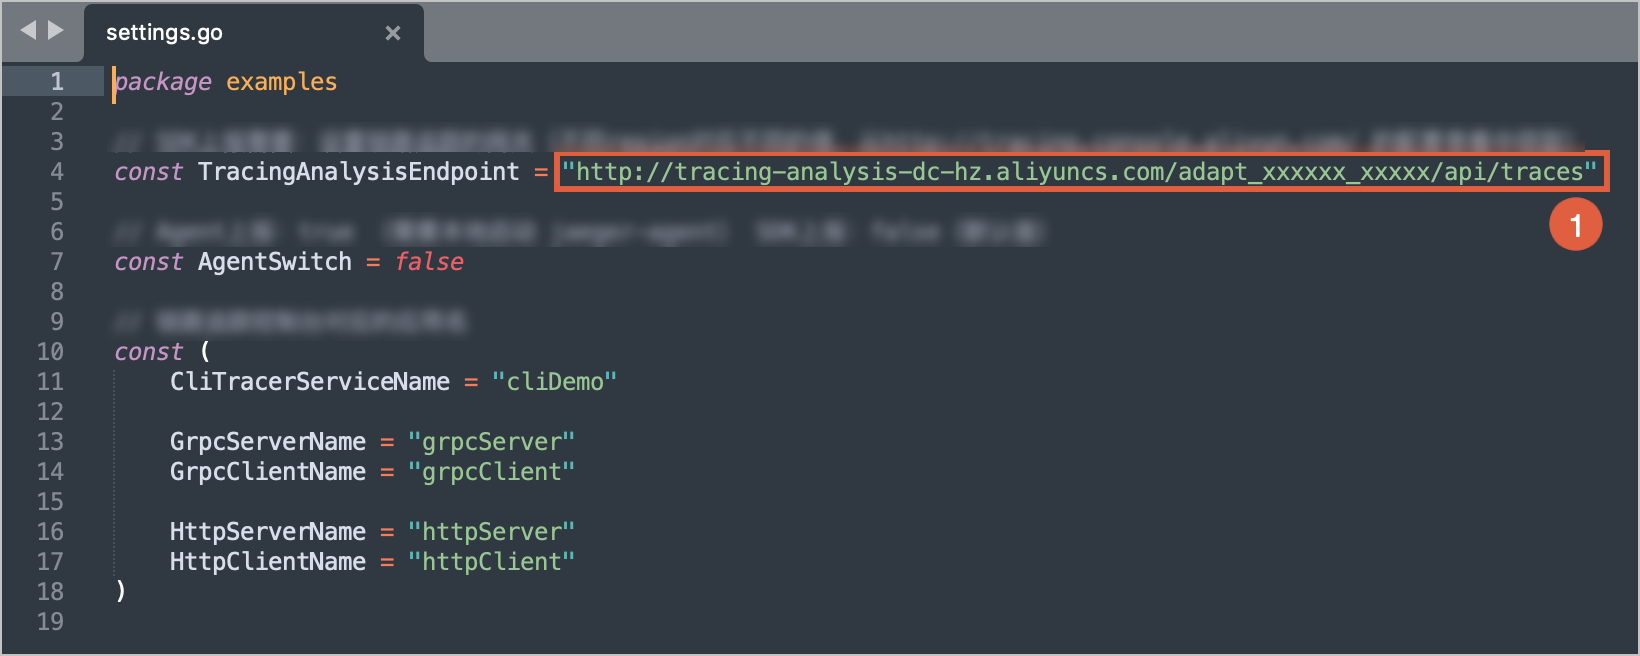
Install dependencies and run the demo:
   go mod tidy
   go run tracingdemo
FAQ
Why do I get a 403 error when reporting data?
2021/06/28 21:11:54 ERROR: error when flushing the buffer: error from collector: 403The endpoint is invalid. To resolve this issue:
Log on to the Managed Service for OpenTelemetry console.
Go to Cluster Configurations > Access point information.
Turn on Show Token and copy the full endpoint string again.
Update the endpoint in your application configuration and restart the application.