Managed Service for OpenTelemetry collects distributed traces from your Ruby applications, giving you visibility into request flows, latency, and errors across services. To start viewing traces in the console, instrument your application using one of these approaches:
Auto-instrumentation (recommended) -- Automatically creates spans for supported frameworks like Rails, Sinatra, and Sidekiq. You do not need to manually create spans, but you must add a configuration file.
Manual instrumentation -- Gives you full control over which operations generate spans, what attributes they carry, and how errors are recorded.
Before you begin
Get your endpoint
Log on to the Managed Service for OpenTelemetry console.
In the left-side navigation pane, click Cluster Configurations, then click the Access point information tab.
In the top navigation bar, select a region. In the Cluster Information section, turn on Show Token.
In the Client section, click OpenTelemetry.
Copy the endpoint from the Related Information column.
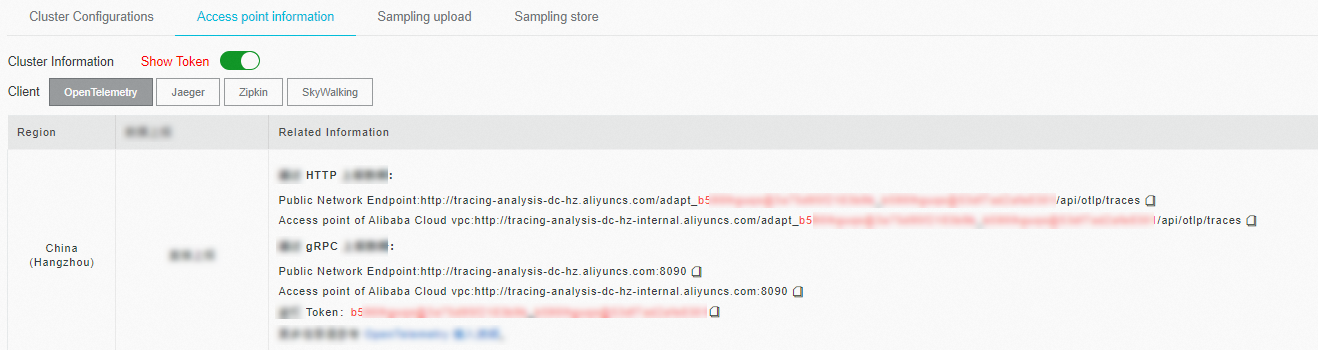
Use a VPC endpoint if your application runs in an Alibaba Cloud production environment. Use a public endpoint for all other environments.
Check Ruby version compatibility
OpenTelemetry supports the following Ruby runtimes:
| Runtime | Minimum version |
|---|---|
| MRI Ruby | 3.0 |
| JRuby | 9.3.2.0 |
| TruffleRuby | 22.1 |
Auto-instrumentation (Rails)
Auto-instrumentation is the fastest way to collect traces. It automatically creates spans for supported libraries without requiring you to manually create spans, but you must add a configuration file. For more information about the frameworks supported by auto-instrumentation, see the OpenTelemetry Ruby instrumentation repository.
Step 1: Create or prepare a Rails project
To create a new Rails project:
gem install rails
rails new <your-project-name>
cd <your-project-name>
Replace <your-project-name> with your application name, for example rails new otel-demo.
If the terminal returns Rails is not currently installed on this system, close and reopen the terminal, then run the command again.Step 2: Add OpenTelemetry gems
Add the following gems to your Gemfile:
gem 'opentelemetry-sdk'
gem 'opentelemetry-exporter-otlp'
gem 'opentelemetry-instrumentation-all'| Gem | Purpose |
|---|---|
opentelemetry-sdk | Core SDK for creating and managing spans |
opentelemetry-exporter-otlp | Exports trace data to an OTLP-compatible backend |
opentelemetry-instrumentation-all | Enables auto-instrumentation for all supported libraries |
Install the dependencies:
gem install bundler
bundle install
Step 3: Configure the SDK
Create config/initializers/opentelemetry.rb with the following content:
# config/initializers/opentelemetry.rb
require 'opentelemetry/sdk'
require 'opentelemetry/exporter/otlp'
require 'opentelemetry/instrumentation/all'

OpenTelemetry::SDK.configure do |c|
  c.add_span_processor(
    OpenTelemetry::SDK::Trace::Export::BatchSpanProcessor.new(
      OpenTelemetry::Exporter::OTLP::Exporter.new(
        endpoint: '<endpoint>' # Replace with your HTTP endpoint from the console.
      )
    )
  )
  c.resource = OpenTelemetry::SDK::Resources::Resource.create({
    OpenTelemetry::SemanticConventions::Resource::HOST_NAME => '<your-host-name>',
  })
  c.service_name = '<your-service-name>'
  c.use_all() # Instrument all supported libraries automatically.
end
Replace the following placeholders:
| Placeholder | Description | Example |
|---|---|---|
<endpoint> | HTTP endpoint from the console | http://tracing-analysis-dc-hz.aliyuncs.com/... |
<your-host-name> | Hostname of the machine running your application | my-server-01 |
<your-service-name> | A name that identifies your application in the console | my-rails-app |
Step 4: Start the application
rails serverExpected output:
* Puma version: 5.6.5 (ruby 2.7.2-p137) ("Birdie's Version")
*  Min threads: 5
*  Max threads: 5
*  Environment: development
*          PID: 79842
* Listening on http://127.0.0.1:3000
* Listening on http://[::1]:3000
Use Ctrl-C to stop
Step 5: Verify trace data
Open
http://127.0.0.1:3000in a browser. The terminal should log a request similar to:Started GET "/" for 127.0.0.1 at 2023-01-01 10:00:00 +0800 Processing by Rails::WelcomeController#index as HTML Rendering ... Rendered ... (Duration: 0.8ms | Allocations: 665) Completed 200 OK in 6ms (Views: 2.1ms | ActiveRecord: 0.0ms | Allocations: 5440)In the Managed Service for OpenTelemetry console, open the Applications page and click your application name to view trace data.
Manual instrumentation
Use manual instrumentation when you need full control over which operations generate spans, what attributes they carry, and how errors are recorded.
Step 1: Install dependencies
gem install opentelemetry-api
gem install opentelemetry-sdk
gem install opentelemetry-exporter-otlp
Step 2: Initialize the SDK
Create a file (for example, manual.rb) and configure the exporter:
require 'opentelemetry/sdk'
require 'opentelemetry-exporter-otlp'

OpenTelemetry::SDK.configure do |c|
  c.add_span_processor(
    OpenTelemetry::SDK::Trace::Export::BatchSpanProcessor.new(
      OpenTelemetry::Exporter::OTLP::Exporter.new(
        endpoint: '<endpoint>' # Replace with your HTTP endpoint from the console.
      )
    )
  )
  c.resource = OpenTelemetry::SDK::Resources::Resource.create({
    OpenTelemetry::SemanticConventions::Resource::SERVICE_NAMESPACE => 'tracing',
    OpenTelemetry::SemanticConventions::Resource::SERVICE_NAME => 'ruby_demo',
    OpenTelemetry::SemanticConventions::Resource::SERVICE_VERSION => '0.0.1',
  })
end
Step 3: Create spans
Get a tracer, then wrap your application logic in a span:
tracer = OpenTelemetry.tracer_provider.tracer('my_app_tracer', '0.1.0')

tracer.in_span('parent_span') do |parent_span|
  # Your application logic here.
end
Step 4: Add attributes and events
Attach key-value attributes and timestamped events to a span:
tracer.in_span('parent_span') do |parent_span|
  # Set attributes in bulk for better performance.
  parent_span.add_attributes({
    'language' => 'ruby',
    'component' => 'manual-demo'
  })

  # Record an event with metadata.
  parent_span.add_event('process_started', attributes: {
    'pid' => Process.pid,
    'signal' => 'SIGHUP'
  })

  # Read the trace ID and span ID.
  current_span = OpenTelemetry::Trace.current_span
  pp current_span.context.trace_id
  pp current_span.context.span_id
end
Tip: Useadd_attributeswith a hash instead of callingset_attributemultiple times. Spans are thread-safe structures that require locks on mutation, so bulk assignment is more efficient.
Step 5: Create nested spans
Nest spans to represent parent-child relationships between operations:
tracer.in_span('parent_span') do |parent_span|
  parent_span.set_attribute('language', 'ruby')

  tracer.in_span('child_span') do |child_span|
    child_span.add_attributes({
      'key1' => 'value1',
      'key2' => 'value2'
    })

    # Record errors properly.
    begin
      raise 'An error has occurred'
    rescue => e
      child_span.status = OpenTelemetry::Trace::Status.error(e.message)
      child_span.record_exception(e) # Captures exception type, message, and stack trace.
    end
  end
end
Step 6: Run the application
ruby manual.rbThe BatchSpanProcessor flushes spans asynchronously. Add a sleep 10 at the end of your script to give the batch time to export before the process exits.
View trace data
Log on to the Managed Service for OpenTelemetry console.
On the Applications page, click your application name.
Browse spans, trace topology, and latency data on the application detail page.
Sample code
Download the complete sample project from the ruby-opentelemetry-demo repository on GitHub.