Report trace data from a Node.js application to Managed Service for OpenTelemetry by using the Jaeger client library. The Jaeger client sends spans over HTTP to the collector endpoint, where you can visualize and analyze them in the console.
Quick start
The following example initializes the Jaeger tracer, creates a span, and reports it to the collector. Replace <endpoint> with your collector endpoint. To get the endpoint, see the "Get the collector endpoint" section below.
const initTracer = require("jaeger-client").initTracer;

const config = {
    serviceName: 'node-service',
    sampler: {
        type: "const",
        param: 1
    },
    reporter: {
        collectorEndpoint: "<endpoint>"
    },
};
const tracer = initTracer(config);

// Create a span
const span = tracer.startSpan("say-hello");
span.setTag("tagKey-01", "tagValue-01");
span.log({ event: "timestamp", value: Date.now() });
span.finish();
After you run this code, log on to the Managed Service for OpenTelemetry console and check for trace data under the node-service application.
For a production-ready example with Express, see the "Report traces from an Express application" section below.
How it works
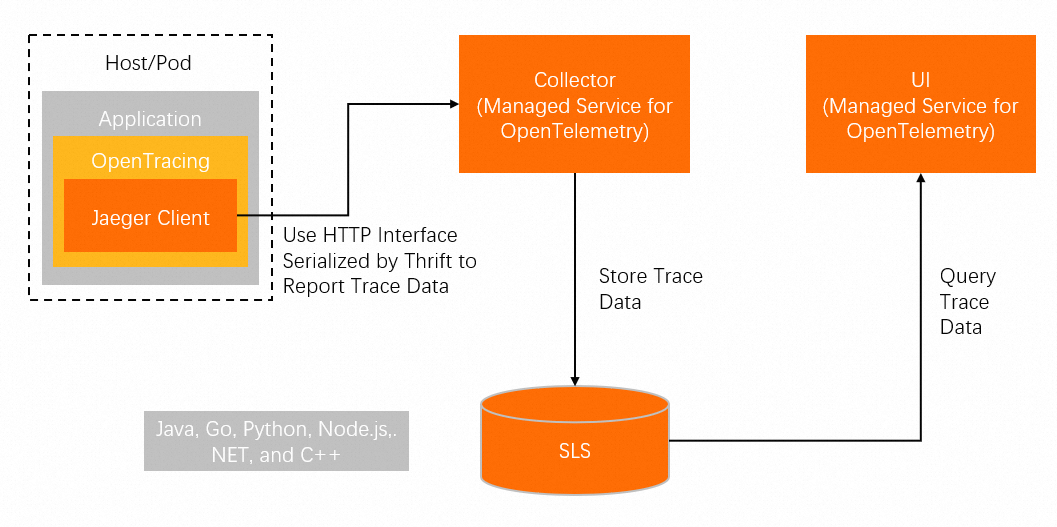
The Jaeger client supports two reporting paths:
Direct reporting: The application sends spans directly to the collector endpoint over HTTP. This path is simpler to set up and suits development and low-volume production workloads.
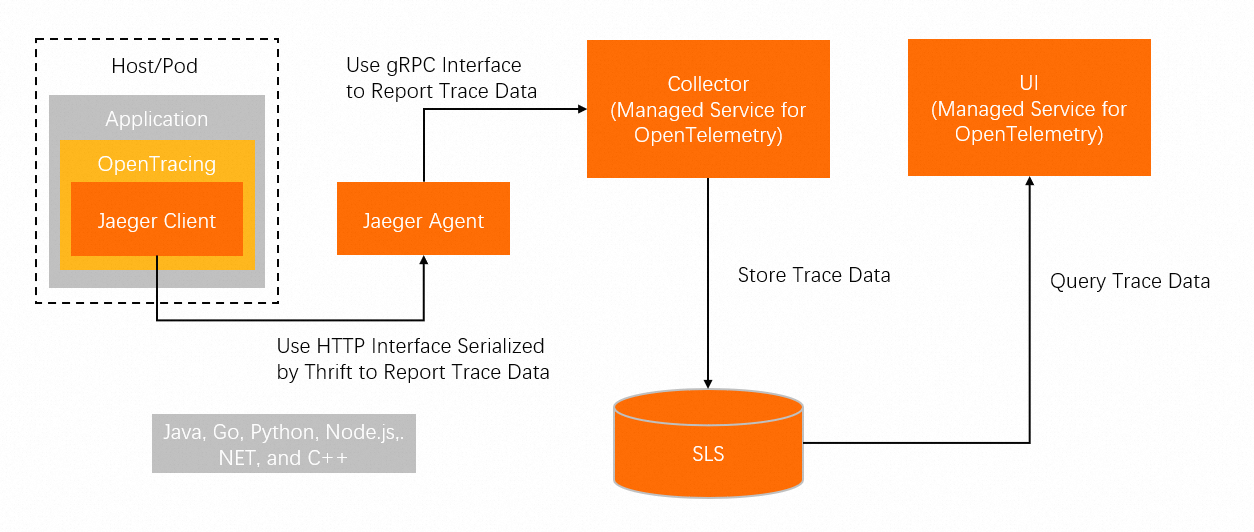
Agent-based reporting: The application sends spans to a locally running Jaeger agent, which forwards them to the collector. This approach adds resilience through buffering and reduces the number of outbound connections from your application.
This guide covers direct reporting. For agent-based reporting, see jaeger-client-node.
Prerequisites
Before you begin, make sure that you have:
A Node.js project with npm initialized
The
jaeger-clientpackage installed:"dependencies": { "jaeger-client": "^3.12.0" }A collector endpoint from the Managed Service for OpenTelemetry console. See the "Get the collector endpoint" section below
Initialize the tracer
Import the Jaeger client and configure it with your service name, sampling strategy, and collector endpoint.
Replace <endpoint> with the collector endpoint you copied from the Access point information tab in the Managed Service for OpenTelemetry console.
const initTracer = require("jaeger-client").initTracer;

const config = {
    serviceName: 'node-service',
    sampler: {
        type: "const",
        param: 1
    },
    reporter: {
        collectorEndpoint: "<endpoint>"
    },
};

const tracer = initTracer(config);
Configuration parameters
| Parameter | Value | Description |
|---|---|---|
serviceName | 'node-service' | Identifies your service in trace data. Replace with your actual service name. |
sampler.type | "const" | Uses a constant sampling strategy. |
sampler.param | 1 | Samples every request. Set to 0 to disable sampling. |
reporter.collectorEndpoint | "<endpoint>" | The Managed Service for OpenTelemetry collector endpoint. |
Create and annotate spans
After you initialize the tracer, create spans to track individual operations. Add tags and logs to enrich the trace data with context.
// Start a new span for the operation
const span = tracer.startSpan("say-hello");

// Add metadata as key-value tags
span.setTag("tagKey-01", "tagValue-01");

// Add timestamped log entries
span.log({ event: "timestamp", value: Date.now() });

// Mark the span as complete
span.finish();
Verify traces in the console
After your application runs and sends spans:
Log on to the Managed Service for OpenTelemetry console.
In the left-side navigation pane, find your application by the
serviceNamevalue you configured (for example,node-service).Verify that spans appear with the tags and logs you added.
If no traces appear, check the following:
The collector endpoint is correct and reachable from your application.
The
sampler.paramvalue is set to1(sample all requests).Network connectivity allows outbound HTTP requests to the endpoint.
Report traces from an Express application
This Express application wraps each incoming request in a span and reports it to the collector.
const express = require("express");
const initTracer = require("jaeger-client").initTracer;
const app = express();

// Initialize the tracer
const config = {
    serviceName: 'node-service',
    sampler: {
        type: "const",
        param: 1
    },
    reporter: {
        collectorEndpoint: "<endpoint>"
    },
};
const tracer = initTracer(config);

// Create a span for every incoming request
app.all('*', function (req, res, next) {
    req.span = tracer.startSpan("say-hello");
    next();
});

// Handle the /api route and finish the span
app.get("/api", function (req, res) {
    const span = req.span;
    span.log({ event: "timestamp", value: Date.now() });
    req.span.finish();
    res.send({ code: 200, msg: "success" });
});

app.listen(3000, '127.0.0.1', function () {
    console.log('start');
});
Replace <endpoint> with your actual collector endpoint, then start the application:
node app.jsSend a test request to generate a trace:
curl http://127.0.0.1:3000/apiExpected response:
{"code":200,"msg":"success"}This response confirms the server is running. Open the Managed Service for OpenTelemetry console to verify that trace data appears under the node-service application.
Get the collector endpoint
To get a Jaeger or Zipkin collector endpoint:
Log on to the Managed Service for OpenTelemetry console.
In the left-side navigation pane, click Cluster Configurations. Then, click the Access point information tab.
In the top navigation bar, select a region. In the Cluster Information section, turn on Show Token.
In the Client section, click Jaeger or Zipkin.
Copy the endpoint from the Related Information column.
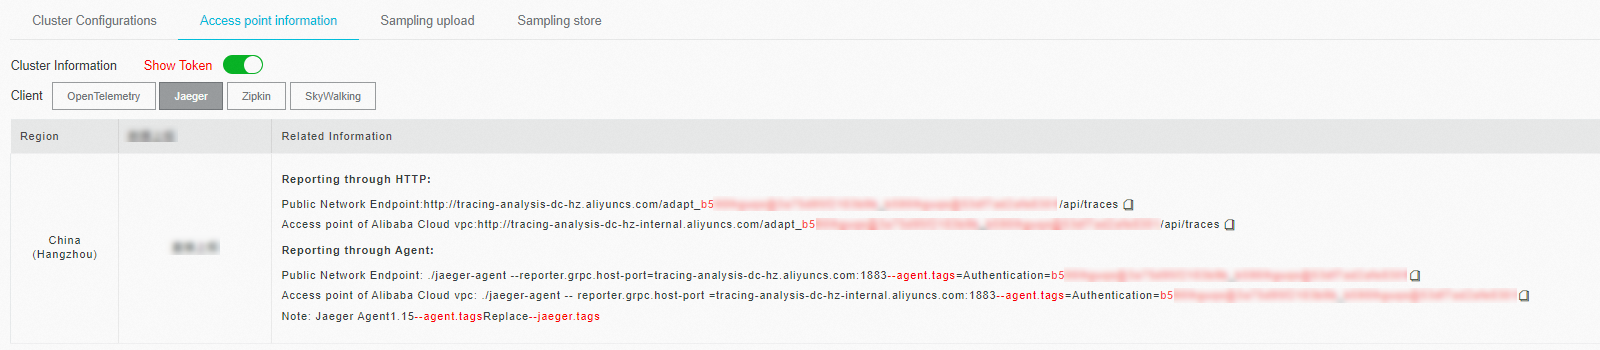
If your application runs in an Alibaba Cloud production environment, use a VPC endpoint. Otherwise, use a public endpoint. For Zipkin, use the v2 endpoint unless you have a specific reason to use v1.