Managed Service for OpenTelemetry collects trace data from C++ applications instrumented with the OpenTelemetry C++ SDK. After traces are ingested, the console provides application topology, traces, abnormal and slow transaction detection, and SQL analysis.
This guide walks through installing the OpenTelemetry C++ SDK, instrumenting a sample application, and exporting traces over HTTP or gRPC. For the complete working example, see the cpp-demo repository on GitHub.
Prerequisites
Before you begin, make sure that you have:
A C++ 11 or later toolchain (see supported C++ versions and platforms)
The Managed Service for OpenTelemetry endpoint for your region
Get your endpoint
Log on to the Managed Service for OpenTelemetry console.
In the left-side navigation pane, click Cluster Configurations. On the page that appears, click the Access point information tab.
In the top navigation bar, select a region. In the Cluster Information section, turn on Show Token.
Set the Client parameter to OpenTelemetry.
Copy the endpoint from the Related Information column.
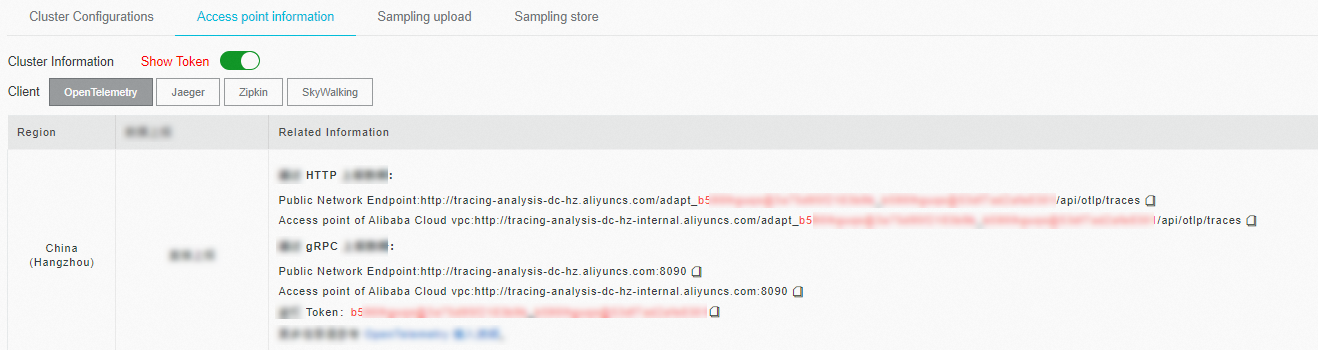
If your application runs in an Alibaba Cloud production environment, use the Virtual Private Cloud (VPC) endpoint. Otherwise, use the public endpoint.
Step 1: Set up the build environment
(Optional) Use a Docker container
Pull the GCC Docker image (Debian-based) and start a container:
docker pull gcc
docker run -it --name otel-cpp-demo gcc bash
Install dependencies
Install the build tools and libraries required for protobuf and gRPC:
apt-get update
apt-get install sudo

sudo apt-get install git cmake g++ libcurl4-openssl-dev

# protobuf
sudo apt-get install protobuf-compiler libprotobuf-dev

# gRPC
sudo apt-get install -y libgrpc++-dev libgrpc-dev protobuf-compiler-grpc
Step 2: Build and install the OpenTelemetry C++ SDK
Clone the repository with all submodules, then build with both OTLP HTTP and gRPC exporter support:
git clone --recurse-submodules https://github.com/open-telemetry/opentelemetry-cpp

cd opentelemetry-cpp
mkdir build && cd build

# Enable OTLP exporters for both HTTP and gRPC
cmake -DBUILD_TESTING=OFF -DWITH_OTLP_GRPC=ON -DWITH_OTLP_HTTP=ON ..

cmake --build . --target all

# Install to the default path /usr/local
cmake --install .

# To install to a custom path instead, run:
# cmake --install . --prefix /opentelemetry-cpp-lib
Step 3: Instrument and export traces
Choose one of the following export methods based on your environment:
| Method | When to use |
|---|---|
| HTTP | No authentication token required in the code. |
| gRPC | Requires a token for authentication. Supports optional SSL/TLS with a custom CA certificate. |
Export over HTTP
1. Create the project
mkdir otel-http-export-demo
cd otel-http-export-demo
2. Write CMakeLists.txt
Create a CMakeLists.txt file with the following content:
cmake_minimum_required(VERSION 3.25.1)
project(otel-http-export-demo)

add_executable(otel-http-export-demo http_exporter.cc)

find_package(opentelemetry-cpp CONFIG REQUIRED)
find_package(protobuf)
find_package(gRPC)
find_package(CURL)
find_package(nlohmann_json)

include_directories("${OPENTELEMETRY_CPP_INCLUDE_DIRS}")

target_link_libraries(
    otel-http-export-demo
    opentelemetry_trace
    opentelemetry_common
    opentelemetry_http_client_curl
    opentelemetry_exporter_otlp_http
    opentelemetry_exporter_otlp_grpc
    opentelemetry_exporter_otlp_http_client
    opentelemetry_otlp_recordable
    opentelemetry_resources
)
3. Write the application code
Create a file named http_exporter.cc with the following content. This sample application initializes a tracer, creates nested spans to demonstrate parent-child relationships, and exports them over HTTP.
// Copyright The OpenTelemetry Authors
// SPDX-License-Identifier: Apache-2.0

#include "opentelemetry/exporters/otlp/otlp_http_exporter_factory.h"
#include "opentelemetry/exporters/otlp/otlp_http_exporter_options.h"
#include "opentelemetry/context/propagation/global_propagator.h"
#include "opentelemetry/context/propagation/text_map_propagator.h"
#include "opentelemetry/exporters/ostream/span_exporter_factory.h"
#include "opentelemetry/nostd/shared_ptr.h"
#include "opentelemetry/sdk/trace/simple_processor_factory.h"
#include "opentelemetry/sdk/trace/tracer_context.h"
#include "opentelemetry/sdk/trace/tracer_context_factory.h"
#include "opentelemetry/sdk/trace/tracer_provider_factory.h"
#include "opentelemetry/trace/propagation/http_trace_context.h"
#include "opentelemetry/trace/provider.h"
#include "opentelemetry/ext/http/client/http_client_factory.h"
#include "opentelemetry/sdk/resource/semantic_conventions.h"
#include "opentelemetry/sdk/common/global_log_handler.h"

#include <string>


namespace trace     = opentelemetry::trace;
namespace trace_sdk = opentelemetry::sdk::trace;
namespace otlp      = opentelemetry::exporter::otlp;
namespace internal_log = opentelemetry::sdk::common::internal_log;
namespace resource = opentelemetry::sdk::resource;

namespace nostd = opentelemetry::nostd;

namespace
{
    opentelemetry::exporter::otlp::OtlpHttpExporterOptions opts;
    void InitTracer()
    {
        // Create an OTLP HTTP exporter with the configured options
        auto exporter  = otlp::OtlpHttpExporterFactory::Create(opts);
        auto processor = trace_sdk::SimpleSpanProcessorFactory::Create(std::move(exporter));

        // Set resource attributes to identify the application in traces
        // Replace the placeholder values with your actual service name and hostname
        resource::ResourceAttributes attributes = {
                {resource::SemanticConventions::kServiceName, "${ServiceName}"},
                {resource::SemanticConventions::kHostName, "${HostName}"}
        };
        auto resource = opentelemetry::sdk::resource::Resource::Create(attributes);

        // Create and register the tracer provider
        std::shared_ptr<opentelemetry::trace::TracerProvider> provider =
                trace_sdk::TracerProviderFactory::Create(std::move(processor), std::move(resource));

        trace::Provider::SetTracerProvider(provider);
    }

    void CleanupTracer()
    {
        std::shared_ptr<opentelemetry::trace::TracerProvider> none;
        trace::Provider::SetTracerProvider(none);
    }

    nostd::shared_ptr<trace::Tracer> get_tracer()
    {
        auto provider = trace::Provider::GetTracerProvider();
        return provider->GetTracer("library name to trace", OPENTELEMETRY_SDK_VERSION);
    }

    // Example functions that create nested spans to demonstrate parent-child relationships
    void f1()
    {
        auto scoped_span = trace::Scope(get_tracer()->StartSpan("f1"));
    }

    void f2()
    {
        auto scoped_span = trace::Scope(get_tracer()->StartSpan("f2"));

        f1();
        f1();
    }

    void foo_library()
    {
        auto scoped_span = trace::Scope(get_tracer()->StartSpan("library"));

        f2();
    }
}  // namespace

/*
  Usage:
  - example_otlp_http
  - example_otlp_http <URL>
  - example_otlp_http <URL> <DEBUG>
  - example_otlp_http <URL> <DEBUG> <BIN>
  <DEBUG> = yes|no, to turn console debug on or off
  <BIN> = bin, to export in binary format
*/
int main(int argc, char *argv[])
{
    if (argc > 1)
    {
        opts.url = argv[1];
        if (argc > 2)
        {
            std::string debug  = argv[2];
            opts.console_debug = debug != "" && debug != "0" && debug != "no";
        }

        if (argc > 3)
        {
            std::string binary_mode = argv[3];
            if (binary_mode.size() >= 3 && binary_mode.substr(0, 3) == "bin")
            {
                opts.content_type = otlp::HttpRequestContentType::kBinary;
            }
        }
    }

    if (opts.console_debug)
    {
        internal_log::GlobalLogHandler::SetLogLevel(internal_log::LogLevel::Debug);
    }

    InitTracer();

    foo_library();

    CleanupTracer();
}
Replace the following placeholders in the code:
| Placeholder | Description | Example |
|---|---|---|
${ServiceName} | Your application name, used to identify the service in traces | my-cpp-app |
${HostName} | The hostname of the machine running the application | prod-server-01 |
How the code works:
InitTracer()creates an OTLP HTTP exporter, wraps it in aSimpleSpanProcessor, sets resource attributes (service name, hostname), and registers theTracerProviderglobally.get_tracer()retrieves aTracerfrom the global provider.StartSpancreates a span, andtrace::Scopebinds it to the current execution context, enabling automatic parent-child span relationships.main()accepts the endpoint URL as its first argument, with optional flags for console debugging and binary export format.
4. Build the project
mkdir build && cd build && cmake .. && make5. Run the application
Pass your HTTP endpoint from the Prerequisites section as the first argument:
./otel-http-export-demo <http-endpoint>Replace <http-endpoint> with your actual endpoint. For example:
./otel-http-export-demo http://tracing-analysis-dc-hz.aliyuncs.com/adapt_xxxxx_xxxxx/api/otlp/tracesTo enable console debug output and verify that spans are being exported, pass yes as the second argument:
./otel-http-export-demo http://tracing-analysis-dc-hz.aliyuncs.com/adapt_xxxxx_xxxxx/api/otlp/traces yesExport over gRPC
1. Create the project
mkdir otel-grpc-export-demo
cd otel-grpc-export-demo
2. Write CMakeLists.txt
Create a CMakeLists.txt file with the following content:
cmake_minimum_required(VERSION 3.25.1)
project(otel-grpc-export-demo)

add_executable(otel-grpc-export-demo grpc_exporter.cc)

find_package(opentelemetry-cpp CONFIG REQUIRED)
find_package(protobuf)
find_package(gRPC)
find_package(CURL)
find_package(nlohmann_json)

include_directories("${OPENTELEMETRY_CPP_INCLUDE_DIRS}")

target_link_libraries(
    otel-grpc-export-demo ${OPENTELEMETRY_CPP_LIBRARIES}
    opentelemetry_trace
    opentelemetry_common
    opentelemetry_http_client_curl
    opentelemetry_exporter_otlp_http
    opentelemetry_exporter_otlp_grpc
    opentelemetry_exporter_otlp_http_client
    opentelemetry_otlp_recordable
    opentelemetry_resources
)
3. Write the application code
Create a file named grpc_exporter.cc with the following content. This sample is similar to the HTTP version but uses the gRPC exporter with token-based authentication.
// Copyright The OpenTelemetry Authors
// SPDX-License-Identifier: Apache-2.0

#include "opentelemetry/exporters/otlp/otlp_grpc_exporter_factory.h"
#include "opentelemetry/exporters/otlp/otlp_grpc_exporter_options.h"
#include "opentelemetry/context/propagation/global_propagator.h"
#include "opentelemetry/context/propagation/text_map_propagator.h"
#include "opentelemetry/exporters/ostream/span_exporter_factory.h"
#include "opentelemetry/nostd/shared_ptr.h"
#include "opentelemetry/sdk/trace/simple_processor_factory.h"
#include "opentelemetry/sdk/trace/tracer_context.h"
#include "opentelemetry/sdk/trace/tracer_context_factory.h"
#include "opentelemetry/sdk/trace/tracer_provider_factory.h"
#include "opentelemetry/trace/propagation/http_trace_context.h"
#include "opentelemetry/trace/provider.h"
#include "opentelemetry/ext/http/client/http_client_factory.h"
#include "opentelemetry/sdk/resource/semantic_conventions.h"
#include "opentelemetry/sdk/common/global_log_handler.h"

#include <string>


namespace trace     = opentelemetry::trace;
namespace trace_sdk = opentelemetry::sdk::trace;
namespace otlp      = opentelemetry::exporter::otlp;
namespace internal_log = opentelemetry::sdk::common::internal_log;
namespace resource = opentelemetry::sdk::resource;

namespace nostd = opentelemetry::nostd;

namespace
{
    opentelemetry::exporter::otlp::OtlpGrpcExporterOptions opts;
    void InitTracer()
    {
        // Create an OTLP gRPC exporter with the configured options
        auto exporter  = otlp::OtlpGrpcExporterFactory::Create(opts);
        auto processor = trace_sdk::SimpleSpanProcessorFactory::Create(std::move(exporter));

        // Set resource attributes to identify the application in traces
        // Replace the placeholder values with your actual service name and hostname
        resource::ResourceAttributes attributes = {
                {resource::SemanticConventions::kServiceName, "${ServiceName}"},
                {resource::SemanticConventions::kHostName, "${HostName}"}
        };
        auto resource = opentelemetry::sdk::resource::Resource::Create(attributes);

        // Create and register the tracer provider
        std::shared_ptr<opentelemetry::trace::TracerProvider> provider =
                trace_sdk::TracerProviderFactory::Create(std::move(processor), std::move(resource));

        trace::Provider::SetTracerProvider(provider);
    }

    void CleanupTracer()
    {
        std::shared_ptr<opentelemetry::trace::TracerProvider> none;
        trace::Provider::SetTracerProvider(none);
    }

    nostd::shared_ptr<trace::Tracer> get_tracer()
    {
        auto provider = trace::Provider::GetTracerProvider();
        return provider->GetTracer("library name to trace", OPENTELEMETRY_SDK_VERSION);
    }

    // Example functions that create nested spans to demonstrate parent-child relationships
    void f1()
    {
        auto scoped_span = trace::Scope(get_tracer()->StartSpan("f1"));
    }

    void f2()
    {
        auto scoped_span = trace::Scope(get_tracer()->StartSpan("f2"));

        f1();
        f1();
    }

    void foo_library()
    {
        auto scoped_span = trace::Scope(get_tracer()->StartSpan("library"));

        f2();
    }
}  // namespace

/*
  Usage:
  - example_otlp_grpc
  - example_otlp_grpc <URL> <TOKEN>
*/
int main(int argc, char *argv[])
{
    if (argc > 1)
    {
        opts.endpoint = argv[1];
        if (argc > 2)
        {
            // Pass the authentication token as gRPC metadata
            opts.metadata.insert(std::pair<std::string, std::string>("authentication",argv[2]));
        }

        if (argc > 3)
        {
            // Enable SSL/TLS with a custom CA certificate
            opts.use_ssl_credentials         = true;
            opts.ssl_credentials_cacert_path = argv[3];
        }
    }

    InitTracer();

    foo_library();

    CleanupTracer();
}
Replace the following placeholders in the code:
| Placeholder | Description | Example |
|---|---|---|
${ServiceName} | Your application name, used to identify the service in traces | my-cpp-app |
${HostName} | The hostname of the machine running the application | prod-server-01 |
Differences from the HTTP exporter:
Uses
OtlpGrpcExporterFactoryandOtlpGrpcExporterOptionsinstead of their HTTP counterparts.Passes the authentication token through gRPC metadata under the key
"authentication".Supports optional SSL/TLS by accepting a CA certificate path as the third argument.
4. Build the project
mkdir build && cd build && cmake .. && make5. Run the application
Pass your gRPC endpoint and authentication token from the Prerequisites section:
./otel-grpc-export-demo <grpc-endpoint> <token>Replace <grpc-endpoint> and <token> with your actual values. For example:
./otel-grpc-export-demo http://tracing-analysis-dc-hz.aliyuncs.com:8090 xxxxx_xxxxxxVerify traces in the console
After the application runs, verify that traces are being reported:
Log on to the Managed Service for OpenTelemetry console.
In the left-side navigation pane, click Applications.
Find and click your application name (matching the
${ServiceName}value you set in the code) to view the trace data, including the application topology, individual traces, and transaction analysis.
If no traces appear, check the following:
| Symptom | Possible cause | Solution |
|---|---|---|
| No application listed | Incorrect endpoint URL | Verify the endpoint matches the one in the Related Information column of the console |
| No application listed | Network connectivity | Confirm the application can reach the endpoint. For VPC endpoints, the application must run within the same Alibaba Cloud VPC. |
| Traces missing (gRPC) | Invalid authentication token | Confirm the token matches the one shown in the console with Show Token enabled |
Troubleshooting
Shared library not found
Running the demo may produce the following error:
./otel-grpc-export-demo: error while loading shared libraries: libopentelemetry_proto_grpc.so: cannot open shared object file: No such file or directoryAdd the OpenTelemetry C++ library path to the LD_LIBRARY_PATH environment variable:
export LD_LIBRARY_PATH=$LD_LIBRARY_PATH:/usr/local/lib//usr/local/lib is the default install path. If you installed the SDK to a custom path (using the --prefix flag in Step 2), use that path instead.
What's next
Explore the complete cpp-demo sample code on GitHub
Learn about the OpenTelemetry C++ SDK for additional instrumentation options