When your Node.js services grow beyond a single process, diagnosing latency and failures across service boundaries requires distributed tracing. Managed Service for OpenTelemetry collects trace data from your application and provides application topology, trace analysis, anomaly and slow transaction detection, and SQL analysis. This guide covers two instrumentation approaches for Express-based applications: automatic (zero-code) and manual (SDK-level).
Prerequisites
Node.js 14 or later
ImportantIf your Node.js version is earlier than 14, use Jaeger to report trace data instead. For more information, see Report Node.js application data.
The endpoint and authentication token from the Managed Service for OpenTelemetry console
Get the endpoint
Log on to the Managed Service for OpenTelemetry console.
In the left-side navigation pane, click Cluster Configurations. On the page that appears, click the Access point information tab.
In the top navigation bar, select a region. In the Cluster Information section, turn on Show Token.
Set Client to OpenTelemetry.
In the Related Information column, copy the endpoint.
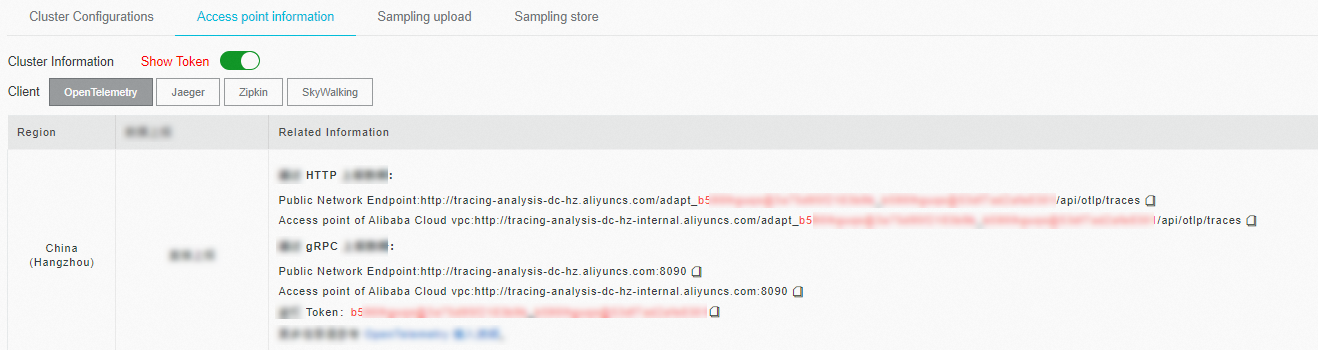
If your application runs in an Alibaba Cloud production environment, use the Virtual Private Cloud (VPC) endpoint. Use the public endpoint for all other environments.
Sample code
Download the complete sample project from opentelemetry-nodejs-demo.
Automatic instrumentation (recommended)
Automatic instrumentation adds tracing to your application without code changes. The OpenTelemetry auto-instrumentation package detects supported frameworks at startup and creates spans automatically.
When to use: Start here for most use cases. Automatic instrumentation supports Express, Fastify, Koa, and 30+ other frameworks. Switch to manual instrumentation only when you need custom span processors, advanced sampling, or fine-grained control over SDK initialization.
Step 1: Install dependencies
cd auto-instrumentation
npm init -y
npm install express axios
Step 2: Install OpenTelemetry packages
npm install --save @opentelemetry/api @opentelemetry/auto-instrumentations-nodeStep 3: Create the application
The following example creates a basic Express server with two routes:
"use strict";

const axios = require("axios").default;
const express = require("express");
const app = express();

app.get("/", async (req, res) => {
  const result = await axios.get("http://localhost:7001/hello");
  return res.status(201).send(result.data);
});

app.get("/hello", async (req, res) => {
  console.log("hello world!")
  res.json({ code: 200, msg: "success" });
});

app.use(express.json());

app.listen(7001, () => {
  console.log("Listening on http://localhost:7001");
});
Step 4: Set environment variables and start the application
Set the following environment variables, then start the application:
export OTEL_TRACES_EXPORTER="otlp"
export OTEL_EXPORTER_OTLP_TRACES_ENDPOINT="<your-endpoint>"
export OTEL_NODE_RESOURCE_DETECTORS="env,host,os"
export OTEL_SERVICE_NAME="<your-service-name>"
export NODE_OPTIONS="--require @opentelemetry/auto-instrumentations-node/register"
node main.js
Replace the following placeholders with your actual values:
| Placeholder | Description | Example |
|---|---|---|
<your-endpoint> | The HTTP endpoint obtained in Get the endpoint | https://tracing-analysis-dc-hz.aliyuncs.com/... |
<your-service-name> | A name that identifies your application in the console | my-express-app |
The following table describes each environment variable:
| Variable | Description |
|---|---|
OTEL_TRACES_EXPORTER | Export protocol. Set to otlp for the OpenTelemetry Protocol. |
OTEL_EXPORTER_OTLP_TRACES_ENDPOINT | The HTTP endpoint that receives trace data. |
OTEL_NODE_RESOURCE_DETECTORS | Resource detectors to run at startup. env,host,os collects environment, host, and OS metadata. |
OTEL_SERVICE_NAME | The service name displayed in the Managed Service for OpenTelemetry console. |
NODE_OPTIONS | Loads the auto-instrumentation module before the application starts. |
For details on all available OpenTelemetry environment variables, see Automatic Instrumentation Configuration.
Step 5: Generate trace data
Send a request to generate traces:
curl localhost:7001/helloAfter the request completes, the SDK exports trace data to Managed Service for OpenTelemetry.
Manual instrumentation
Manual instrumentation gives you full control over SDK initialization, including custom span processors, advanced sampling, and application-specific configuration. This approach replaces automatic instrumentation -- do not use both simultaneously.
The manual instrumentation path uses gRPC for the export protocol, while the automatic path uses HTTP. If your firewall policies do not support gRPC, use automatic instrumentation with HTTP or configure the HTTP exporter (@opentelemetry/exporter-trace-otlp-http) instead.
Step 1: Add OpenTelemetry dependencies
Add the following dependencies to your package.json file:
"dependencies": {
    "@opentelemetry/api": "^1.0.4",
    "@opentelemetry/exporter-trace-otlp-grpc": "^0.27.0",
    "@opentelemetry/instrumentation": "^0.27.0",
    "@opentelemetry/instrumentation-express": "^0.27.0",
    "@opentelemetry/instrumentation-http": "^0.27.0",
    "@opentelemetry/resources": "^1.0.1",
    "@opentelemetry/sdk-trace-base": "^1.0.1",
    "@opentelemetry/sdk-trace-node": "^1.0.1"
}
Step 2: Create the tracer provider
Import and initialize the tracer provider at the top of your entry file, before any other application imports. OpenTelemetry must patch framework libraries before they are loaded. Incorrect initialization order is the most common cause of missing spans.
const { Resource } = require("@opentelemetry/resources");
const { NodeTracerProvider } = require("@opentelemetry/sdk-trace-node");
const {
  SemanticResourceAttributes,
} = require("@opentelemetry/semantic-conventions");

const provider = new NodeTracerProvider({
  resource: new Resource({
    [SemanticResourceAttributes.HOST_NAME]: require("os").hostname(),
    // Replace "opentelemetry-express" with your service name
    [SemanticResourceAttributes.SERVICE_NAME]: "opentelemetry-express",
  }),
});
Step 3: Register framework instrumentations
Register HTTP and Express instrumentations to trace incoming and outgoing requests automatically:
const { registerInstrumentations } = require("@opentelemetry/instrumentation");
const { HttpInstrumentation } = require("@opentelemetry/instrumentation-http");
const {
  ExpressInstrumentation,
} = require("@opentelemetry/instrumentation-express");

registerInstrumentations({
  tracerProvider: provider,
  instrumentations: [new HttpInstrumentation(), ExpressInstrumentation],
});
To instrument other Node.js frameworks, see the OpenTelemetry auto-instrumentations-node package for available plugins.
Step 4: Configure the exporter
Configure an OTLP exporter over gRPC to send trace data to Managed Service for OpenTelemetry:
const metadata = new grpc.Metadata();
metadata.set("Authentication", "<your-token>");

const exporter = new OTLPTraceExporter({ url: "<your-endpoint>", metadata });
provider.addSpanProcessor(new SimpleSpanProcessor(exporter));
provider.register();
Replace the following placeholders with your actual values:
| Placeholder | Description |
|---|---|
<your-endpoint> | The gRPC endpoint obtained in Get the endpoint |
<your-token> | The authentication token displayed after you turn on Show Token |
Step 5 (optional): Add custom events and attributes
Attach events and attributes to the current span for application-specific context:
const api = require("@opentelemetry/api");
const currentSpan = api.trace.getSpan(api.context.active());

// Add a timestamped event
currentSpan.addEvent("timestamp", { value: Date.now() });

// Add a custom attribute
currentSpan.setAttribute("tagKey-01", "tagValue-01");
For more on the OpenTelemetry tracing API, see the OpenTelemetry JS getting started guide.
View trace data in the ARMS console
Log on to the Managed Service for OpenTelemetry console.
In the left-side navigation pane, click Applications.
Click your application name to view traces, topology, and performance data.
Troubleshooting
Application does not appear in the console
Verify that
OTEL_EXPORTER_OTLP_TRACES_ENDPOINT(automatic) or theurlparameter inOTLPTraceExporter(manual) matches the endpoint from the console.Confirm network connectivity to the endpoint. If your application runs outside Alibaba Cloud, use the public endpoint instead of the VPC endpoint.
Make sure your application has received at least one request. OpenTelemetry buffers spans before exporting them.
For manual instrumentation, confirm the tracer provider is initialized before any application imports. Incorrect initialization order causes missing spans.
Enable debug logging
Set the OpenTelemetry log level to debug to inspect SDK behavior:
export OTEL_LOG_LEVEL=debugRestart the application and check the console output for span export logs and errors. A successful export produces log entries similar to:
@opentelemetry/api: Registered a global for diag v1.x.x
...
items to be sent [{"traceId":"...","spanId":"...","name":"GET /hello",...}]
If no span entries appear, verify that your application has processed at least one request and that the endpoint is reachable.
Supported Node.js frameworks
OpenTelemetry provides auto-instrumentation plugins for the following frameworks. For the full list, see the OpenTelemetry JS contrib repository.
View all supported frameworks
Complete sample code
The following code combines all manual instrumentation steps into a single runnable Express application. The example uses the gRPC-based OTLPTraceExporter to submit trace data to Managed Service for OpenTelemetry.
"use strict";

const { Resource } = require("@opentelemetry/resources");
const {
  OTLPTraceExporter,
} = require("@opentelemetry/exporter-trace-otlp-grpc");
const { NodeTracerProvider } = require("@opentelemetry/sdk-trace-node");
const { SimpleSpanProcessor } = require("@opentelemetry/sdk-trace-base");
const {
  ExpressInstrumentation,
} = require("@opentelemetry/instrumentation-express");
const { registerInstrumentations } = require("@opentelemetry/instrumentation");
const { HttpInstrumentation } = require("@opentelemetry/instrumentation-http");
const {
  SemanticResourceAttributes,
} = require("@opentelemetry/semantic-conventions");
const grpc = require("@grpc/grpc-js");

// 1. Create a tracer provider with service metadata
const provider = new NodeTracerProvider({
  resource: new Resource({
    [SemanticResourceAttributes.HOST_NAME]: require("os").hostname(),
    [SemanticResourceAttributes.SERVICE_NAME]: "opentelemetry-express",
  }),
});

// 2. Register HTTP and Express instrumentations
registerInstrumentations({
  tracerProvider: provider,
  instrumentations: [new HttpInstrumentation(), ExpressInstrumentation],
});

// 3. Configure the gRPC exporter with authentication
const metadata = new grpc.Metadata();
metadata.set("Authentication", "<your-token>");

const exporter = new OTLPTraceExporter({ url: "<your-endpoint>", metadata });
provider.addSpanProcessor(new SimpleSpanProcessor(exporter));
provider.register();

// 4. Application code (must come after provider registration)
const api = require("@opentelemetry/api");
const axios = require("axios").default;
const express = require("express");
const app = express();

app.get("/", async (req, res) => {
  const result = await axios.get("http://localhost:7001/api");
  return res.status(201).send(result.data);
});

app.get("/api", async (req, res) => {
  const currentSpan = api.trace.getSpan(api.context.active());
  currentSpan.addEvent("timestamp", { value: Date.now() });
  currentSpan.setAttribute("tagKey-01", "tagValue-01");
  res.json({ code: 200, msg: "success" });
});

app.use(express.json());

app.listen(7001, () => {
  console.log("Listening on http://localhost:7001");
});
Replace <your-token> and <your-endpoint> with the token and gRPC endpoint obtained in Get the endpoint.