After you instrument your application with the SkyWalking Rust Agent and report trace data to Managed Service for OpenTelemetry, Managed Service for OpenTelemetry starts monitoring your application. You can view key metrics, such as application topology, traces, failed and slow transactions, and SQL analysis.
Prerequisites
-
Protobuf is installed.
macOS
brew install protobufDebian
sudo apt install protobuf-compiler -
New console
-
Log on to the Managed Service for OpenTelemetry console. In the left-side navigation pane, click Integration Center.
-
On the Integration Center page, click the SkyWalking card in the Open Source Frameworks section.
-
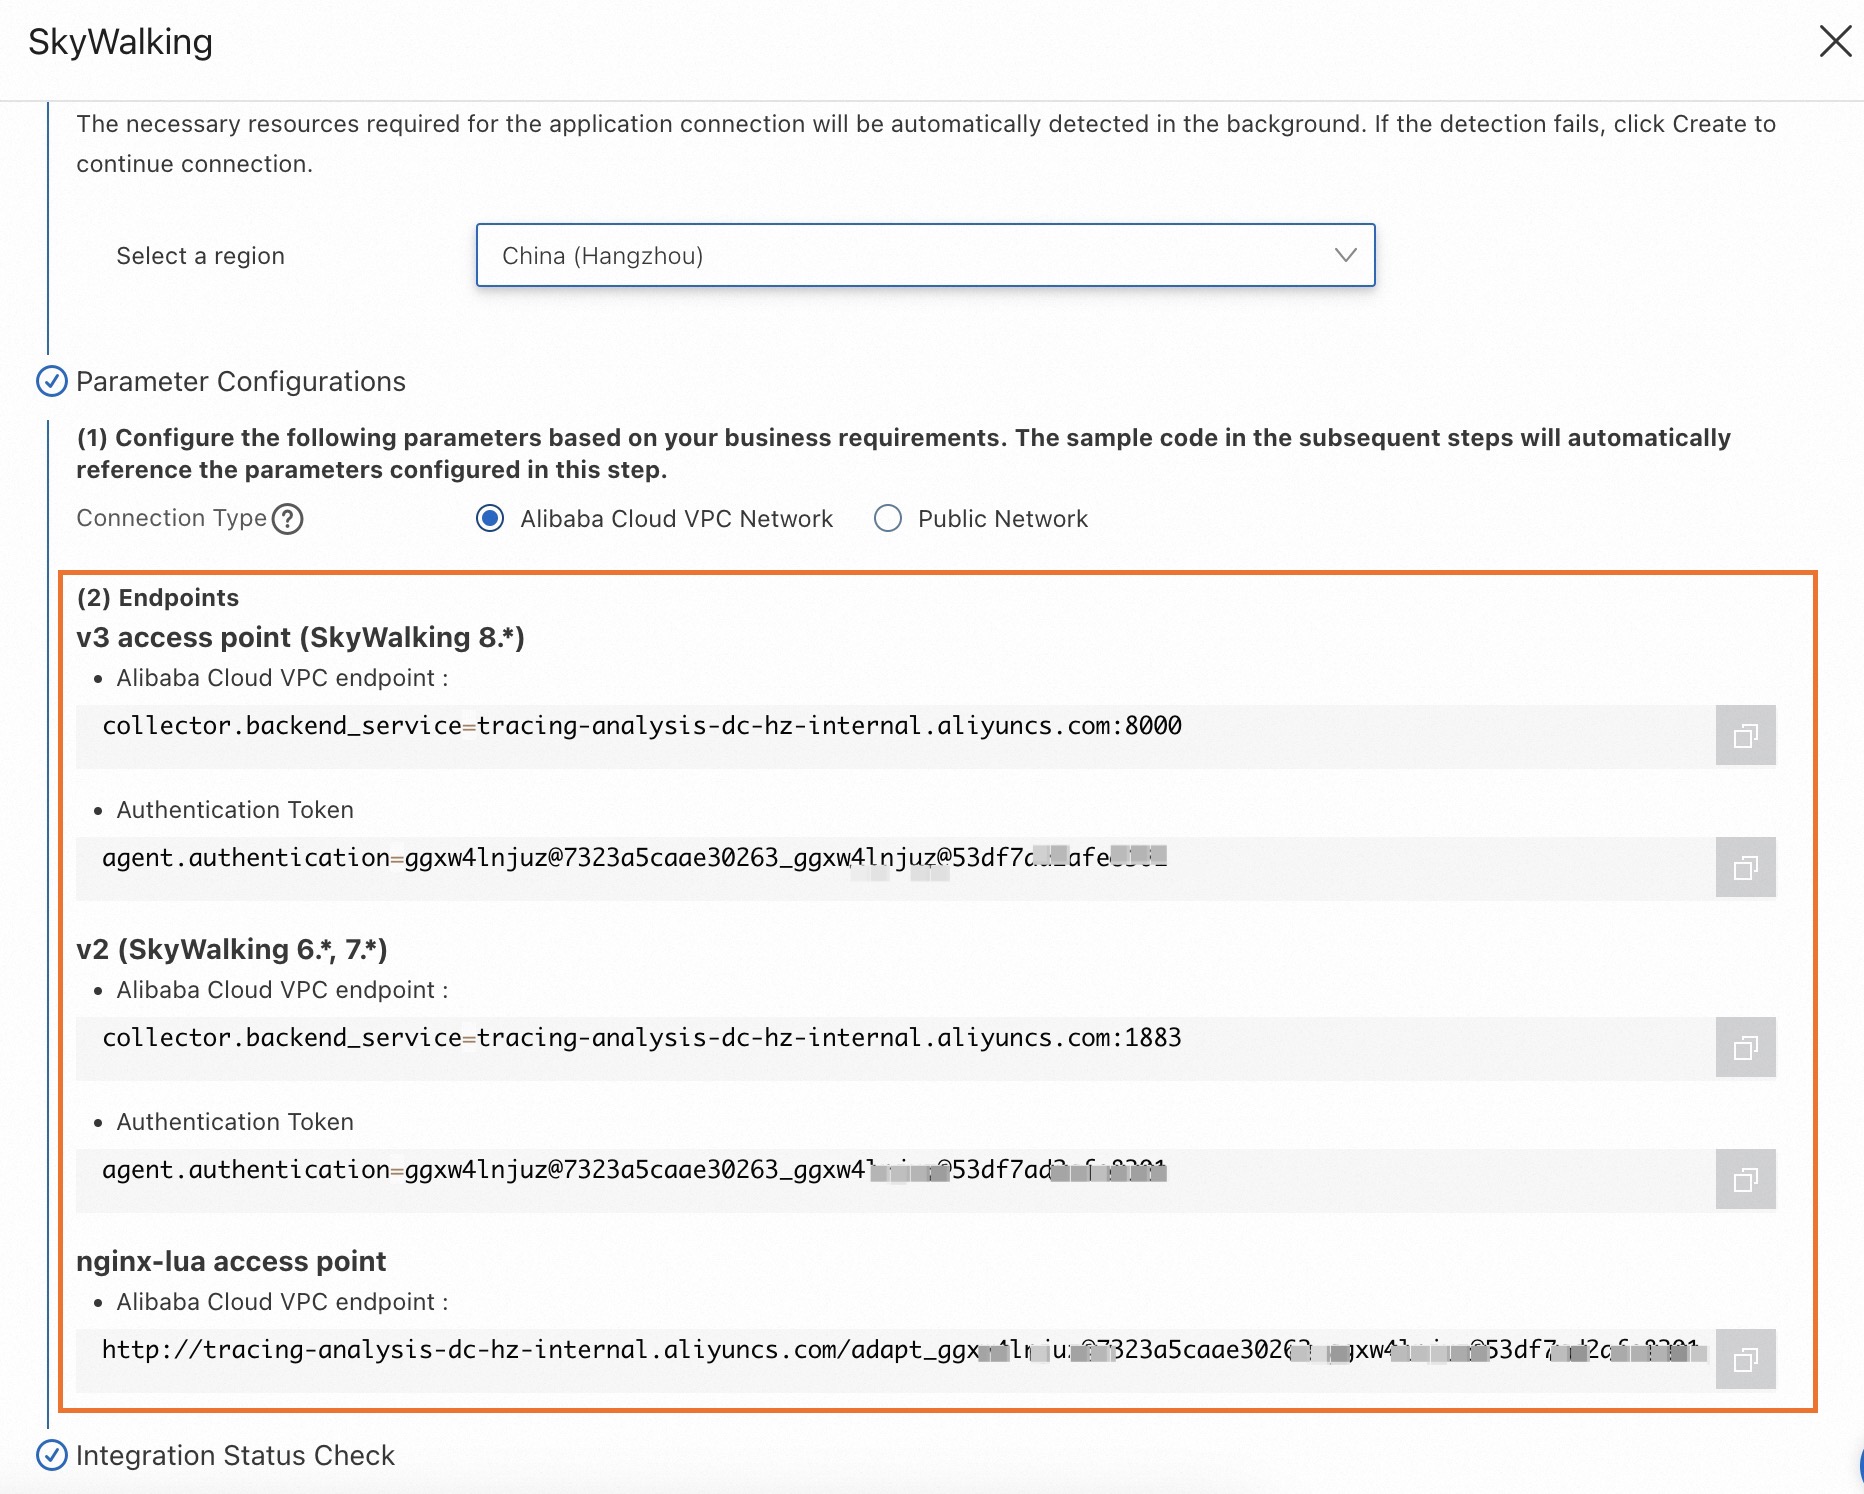
In the SkyWalking panel, click the Start Integration tab, and then select a region in which you want to report data.
NoteWhen you access a region for the first time, resources are automatically initialized there.
-
Configure the Connection Type parameter and copy an endpoint.
If your service is deployed on Alibaba Cloud and resides in the region that you selected, we recommend that you set this parameter to Alibaba Cloud VPC Network. Otherwise, set this parameter to Public Network.
Old console
-
Log on to the Managed Service for OpenTelemetry console.
-
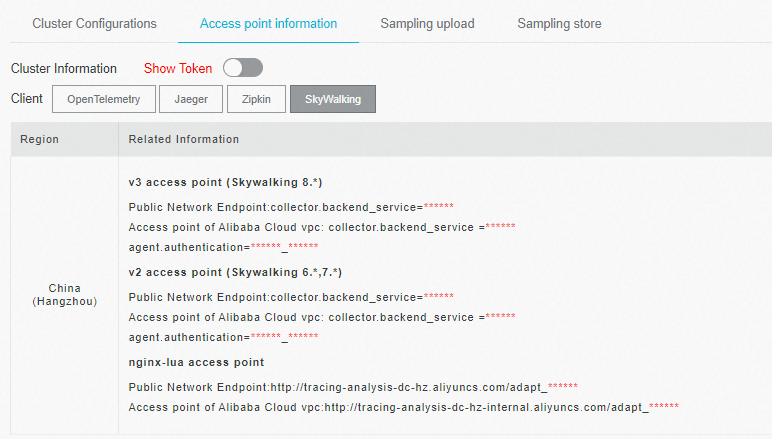
In the left-side navigation pane, click Cluster Configurations. On the page that appears, click the Access point information tab.
-
In the top navigation bar, select a region in which you want to report data. In the Cluster Information section, turn on Show Token.
-
Set the Client parameter to SkyWalking.
In the Related Information column of the table, copy an endpoint.
 Note
NoteIf your application is deployed in an Alibaba Cloud production environment, use a VPC endpoint. Otherwise, use a public endpoint.
-
Background information
SkyWalking is a popular open-source Application Performance Monitoring (APM) tool for microservices, cloud-native, and containerized (such as Docker, Kubernetes, and Mesos) applications. At its core, SkyWalking is a distributed tracing system.
The skywalking-rust crate is the official SkyWalking Rust Agent library. You can integrate it to monitor Rust applications. Currently, skywalking-rust provides limited automatic instrumentation and requires manual instrumentation.
Demo
Demo repository: SkyWalking Demo
This demo provides a simple HTTP server based on the hyper framework for Rust. It uses manual instrumentation with skywalking-rust to report data to the Managed Service for OpenTelemetry console.
Manually instrument a Rust application
-
Add the SkyWalking dependency to your Rust project.
NoteThis topic uses SkyWalking 0.8.0 as an example.
cargo.toml
# Add the following line under [dependencies]
skywalking = { version = "0.8.0", features = ["vendored"] }
cargo add
cargo add skywalking --features vendored -
Import the SkyWalking modules in your source code.
# Import modules in the source code that requires instrumentation. use skywalking::{reporter::grpc::GrpcReporter, trace::tracer::Tracer}; -
Perform manual instrumentation.
// Use entry span, local span, and exit span to manually instrument a trace. // These three span types enable complete end-to-end tracing. // // entry span: Used on the server side to extract the tracing context from an incoming HTTP request. // local span: Used for instrumenting operations within the same process. // exit span: Used on the client side to inject the tracing context into an outgoing HTTP request. // // For cross-process traces, refer to the following example: // // client.rs: let mut ctx = tracer.create_trace_context(); { // do something... let span = ctx.create_exit_span("operation1", "remote_peer"); } // server.rs: let mut ctx = tracer.create_trace_context(); { let span = ctx.create_entry_span("operation1"); // do something... } -
Configure the endpoint and token.
Obtain the endpoint address and authentication token from the Prerequisites section.
// Replace with the endpoint address, with the authentication token, // and with your application name. let endpoint = "<endpoint>"; let token = "<token>"; let service_name = "<service_name>"; let instance_name = "<instance_name>"; let reporter = GrpcReporter::connect(endpoint).await?; let reporter = reporter.with_authentication(token); let tracer = Tracer::new(service_name, instance_name, reporter.clone()); -
Restart your application.
FAQ
My Rust project fails to build with the following error:
   Compiling tokio-io v0.1.13
   Compiling hyper v0.14.27
error: failed to run custom build command for `skywalking v0.8.0`
Caused by:
  process didn't exit successfully: `/Users/whlongxi/work/test/skywalking-test-demo/skywalking-rust-demo/target/debug/build/skywalking-12f2124cc5c4c6c4/build-script-build` (exit status:
101)
  --- stdout
  cargo:rerun-if-changed=./skywalking-data-collect-protocol/language-agent/Meter.proto
  cargo:rerun-if-changed=./skywalking-data-collect-protocol/language-agent/Tracing.proto
  cargo:rerun-if-changed=./skywalking-data-collect-protocol/logging/Logging.proto
  cargo:rerun-if-changed=./skywalking-data-collect-protocol/management/Management.proto
  cargo:rerun-if-changed=./skywalking-data-collect-protocol
  --- stderr
  thread 'main' panicked at 'Could not find `protoc` installation and this build crate cannot proceed without
      this knowledge. If `protoc` is installed and this crate had trouble finding
      it, you can set the `PROTOC` environment variable with the specific path to your
      installed `protoc` binary.You could try running `brew install protobuf` or downloading it from https://github.com/protocolbuffers/protobuf/releases
This error indicates that the protoc compiler is missing. To fix this, install protobuf as described in the Prerequisites section.