When your application experiences slow responses or errors, you need to quickly identify which spans are causing issues. The Interface Calls page in Managed Service for OpenTelemetry shows response time, request count, and error count for every span -- across client, server, and internal calls. Use this page to pinpoint bottlenecks, trace dependencies between services, and drill into individual traces.
Open the Interface Calls page
Log on to the Managed Service for OpenTelemetry console.
In the left-side navigation pane, click Applications.
On the Applications page, select a region in the top navigation bar, then click the application name.
In the left-side navigation pane, click Interface Invocation.
Identify slow or failing spans
The Interface Calls page lists all spans involved in your application's calls. Use the tabs and sort controls to surface the spans that need attention:
| Action | How to |
|---|---|
| Sort by metric | Click the Response Time, Requests, or Exceptions tab, then click the sort arrow to toggle order. |
| Search for a span | Enter a keyword in the search box and click the search icon. |
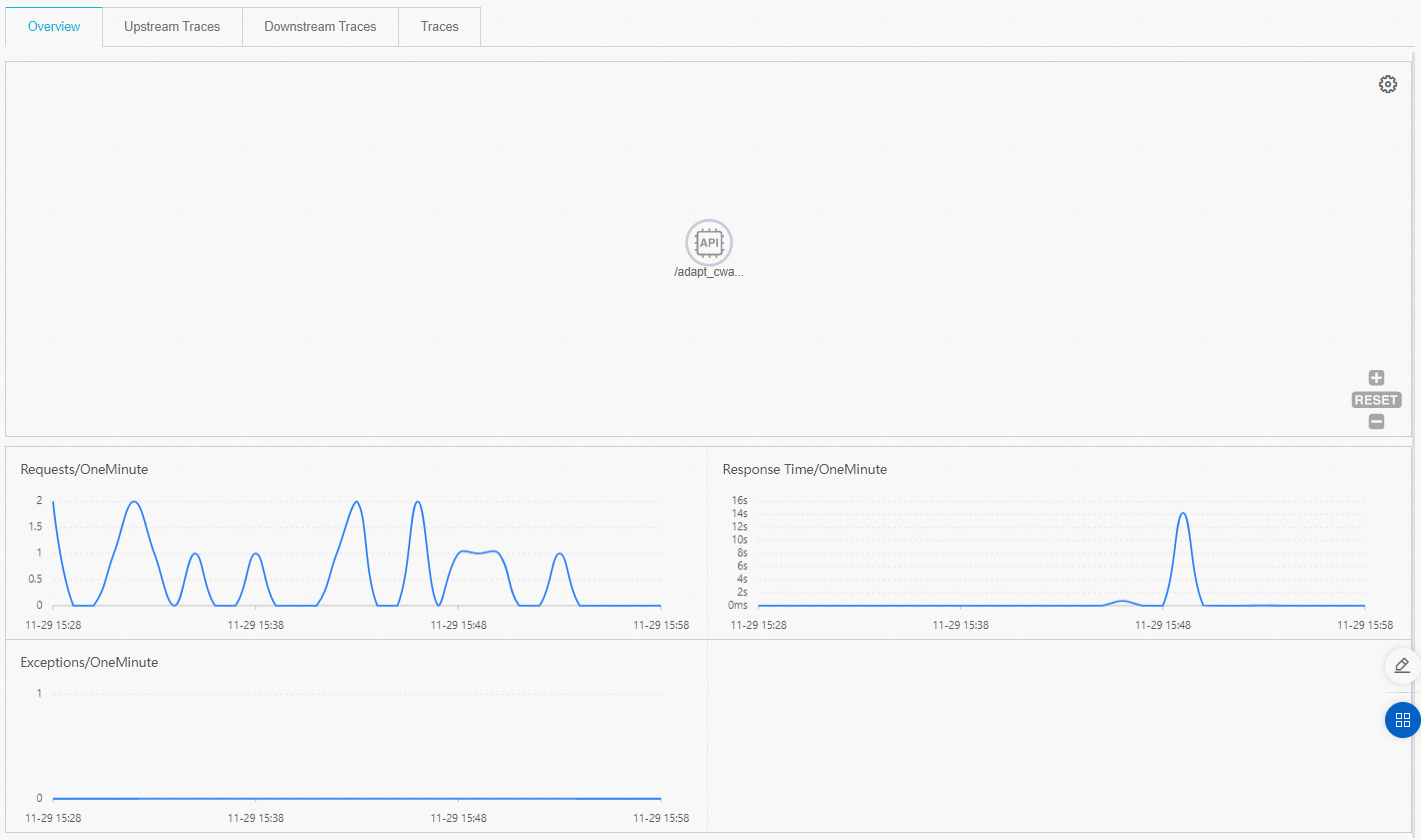
Click a span to open the Overview tab, which displays:
A topology diagram of the span's call path
Line charts for request count, response time, and error count over time
Trace upstream and downstream services
The Upstream Services and Downstream Services tabs show every service that calls your application (upstream) and every service your application calls (downstream). Each entry includes response time, request count, and error count.
Switch to the Upstream Traces or Downstream Traces tab for trace-level details.
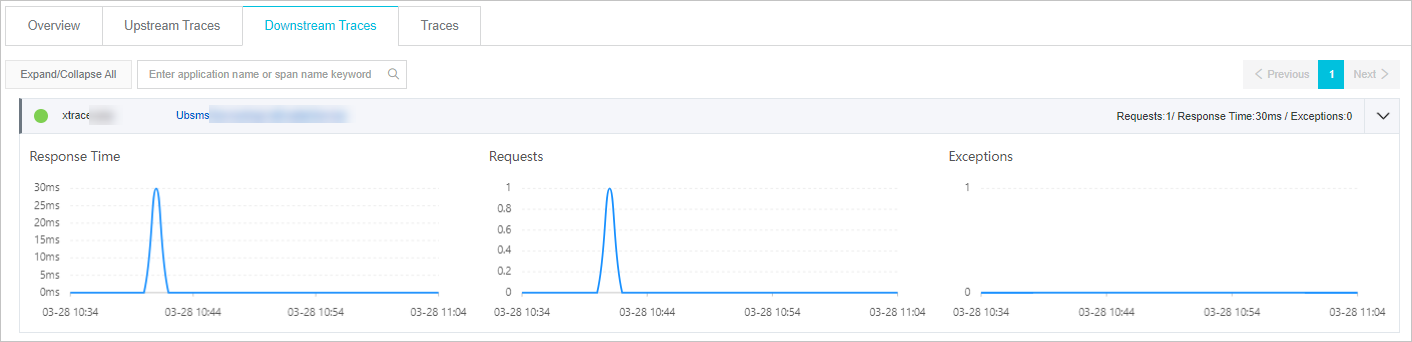
On the Upstream Traces or Downstream Traces tab:
| Action | How to |
|---|---|
| Show or hide all interfaces | Click Expand/Collapse All. |
| Filter by application or span name | Enter a keyword in the search box and click the search icon. |
| Show or hide an interface's metrics | Click the collapse panel or the arrow at the end of the row. |
Find and filter traces
The Traces tab lists up to 100 traces with the highest elapsed time on the specified host within the selected time range.
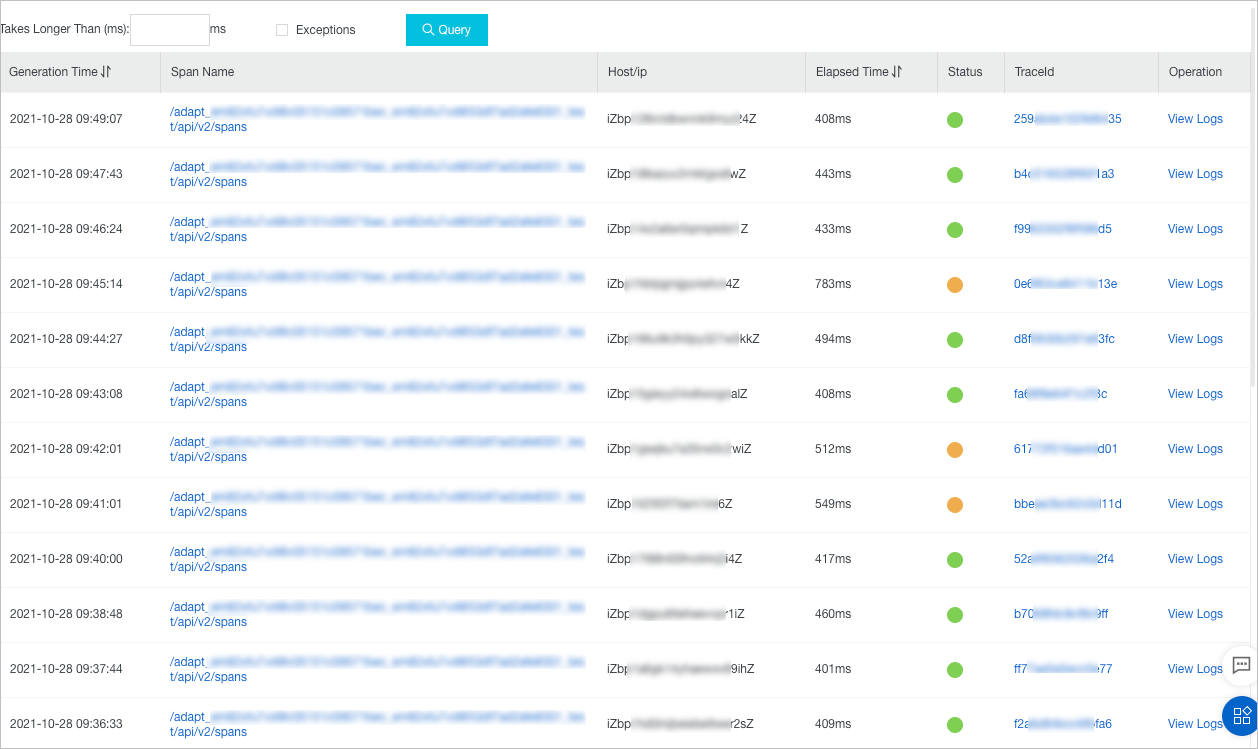
Status indicators
The Status column uses color-coded icons:
| Color | Meaning |
|---|---|
| Green | Elapsed time < 500 ms |
| Yellow | Elapsed time between 500 ms and 1,000 ms |
| Red | Elapsed time > 1,000 ms, or a tag key is set to error |
Filter and sort traces
| Action | How to |
|---|---|
| Filter by duration | Enter a value accurate to milliseconds in the Takes Longer Than (ms) field and click Query. Traces whose elapsed time exceeds the specified value are displayed. |
| Filter by errors | Select Exceptions and click Query. Abnormal traces are displayed. |
| Sort traces | Click the arrow next to Generation Time or Elapsed Time to toggle ascending or descending order. |
Analyze a trace waterfall chart
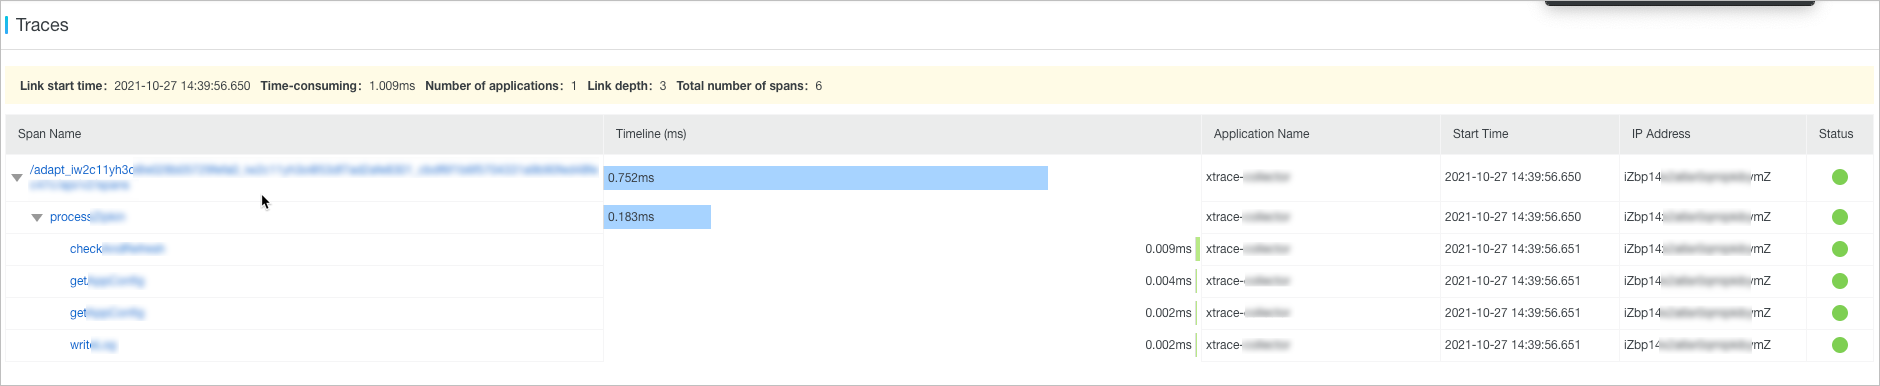
Click a trace ID on the Traces tab to open the Traces page, which displays a waterfall chart for that trace.
The waterfall chart shows the following details for each span:
| Column | Description |
|---|---|
| Span name | The operation name of the span |
| Timeline | Visual representation of the span's duration relative to the trace |
| Application name | The service that generated the span |
| Start time | When the span began |
| Server IP address | The server that processed the span |
| Status | Color-coded elapsed time indicator |
The IP Address column may display IP addresses or server names, depending on the display settings on the Application Settings page. For details, see Manage applications and tags.
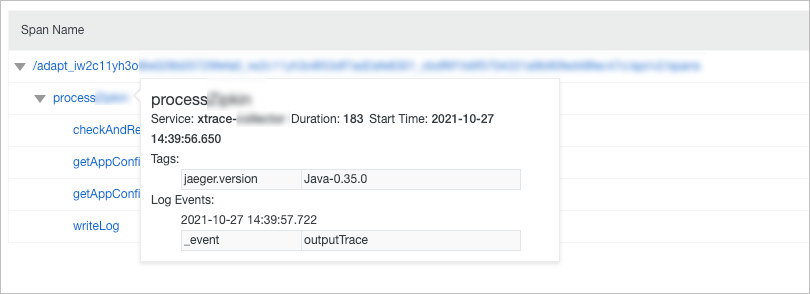
Hover over a span name to view its duration, start time, tags, and log events.
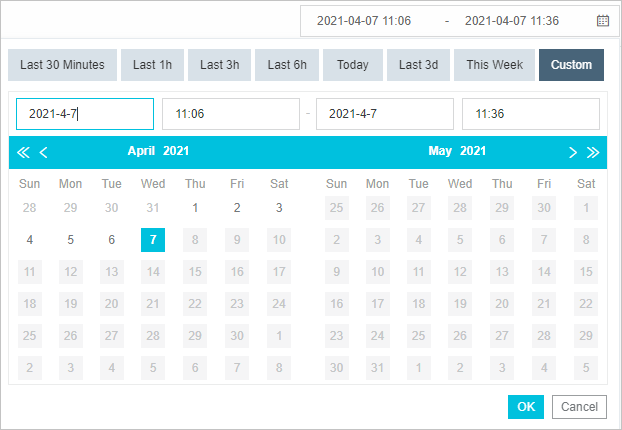
Set a time range
The date and time picker in the upper-right corner controls the time range for all displayed data.
| Option | How to |
|---|---|
| Predefined range | Click the picker and select a range such as Last 30 Minutes, Today, or This Week. |
| Custom range | Select Custom, then select a start and end time in the calendar or enter them manually, and click OK. |
Use the format YYYY-MM-DD for dates and HH:MM for times.