The Jaeger client for C# is no longer maintained. Use OpenTelemetry SDK for .NET to report trace data instead. The following guide applies only to legacy applications that still use the Jaeger client.
Instrument a .NET application with the Jaeger client to report trace data to Managed Service for OpenTelemetry. After trace data reaches the backend, the console displays application topology, traces, abnormal and slow transactions, and SQL analysis.
This topic covers three instrumentation approaches for .NET Core 3.1 and .NET 6.0:
| Approach | Framework | Effort |
|---|---|---|
| Automatic instrumentation with OpenTracing | ASP.NET Core | Low -- add NuGet packages and configure an endpoint |
| Automatic instrumentation with gRPC | gRPC services | Low -- add interceptors to server and client |
| Manual instrumentation | Any .NET application | Medium -- create and manage spans in code |
Prerequisites
Before you begin, make sure that you have:
Jaeger 1.0.2
.NET 6.0 or .NET Core 3.1 (depending on your target framework)
A Jaeger endpoint from the Managed Service for OpenTelemetry console
Log on to the Managed Service for OpenTelemetry console.
In the left-side navigation pane, click Cluster Configurations. Then, click the Access point information tab.
In the top navigation bar, select a region. In the Cluster Information section, turn on Show Token.
In the Client section, click Jaeger or Zipkin.
Copy the endpoint from the Related Information column.
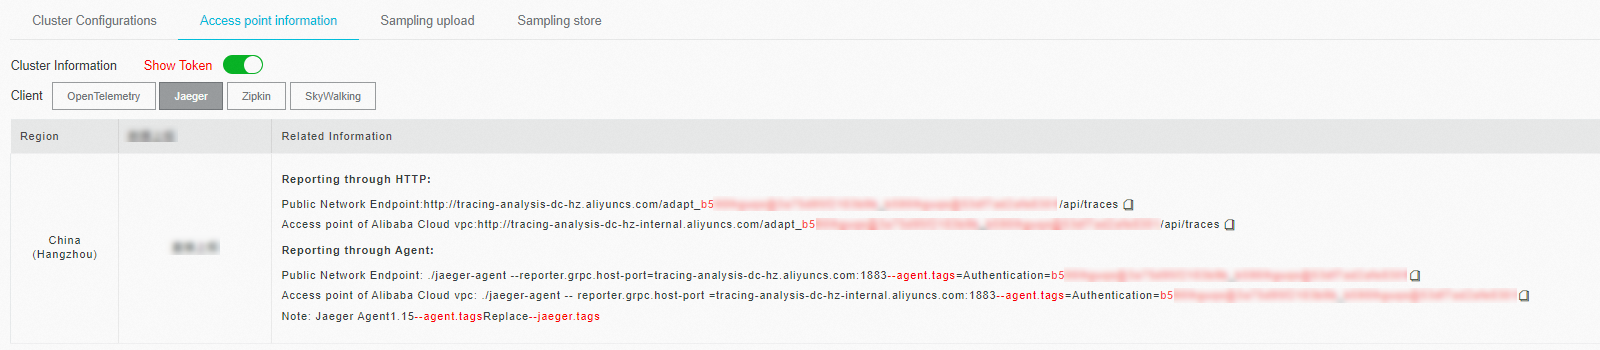
If your application runs in an Alibaba Cloud production environment, use a VPC endpoint. Otherwise, use a public endpoint. For Zipkin, use the v2 endpoint unless you have a specific reason to use v1.
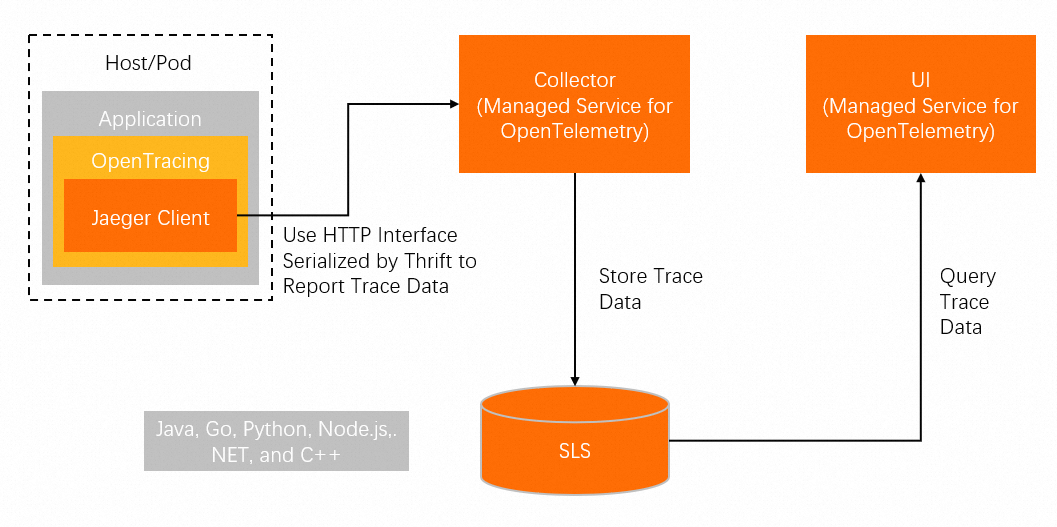
Trace data can reach the backend through two paths:
Direct reporting -- The application sends trace data straight to the Managed Service for OpenTelemetry backend, bypassing a local Jaeger agent.
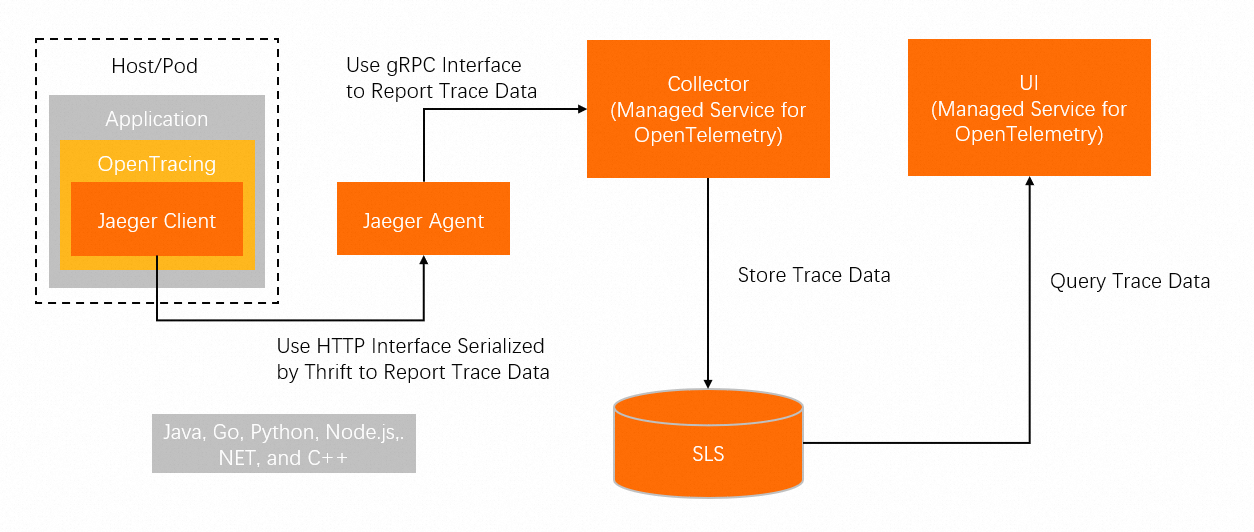
Agent-based reporting -- The application sends trace data to a local Jaeger agent, which forwards it to the backend.
Sample code
Download the complete sample project from dotnet-demo.
Instrument a .NET 6.0 application with OpenTracing
Step 1: Configure the Jaeger endpoint
Open dotnet-demo/net6.0/Shared/JaegerServiceCollectionExtensions.cs. Set the Jaeger endpoint URL and application name:
public static class JaegerServiceCollectionExtensions
{
    // Replace with your Jaeger endpoint.
    // See the "Get a Jaeger endpoint" section for details.
    private static readonly Uri _jaegerUri = new Uri("<your-jaeger-endpoint>");

    public static IServiceCollection AddJaeger(this IServiceCollection services)
    {
        if (services == null)
            throw new ArgumentNullException(nameof(services));

        services.AddSingleton<ITracer>(serviceProvider =>
        {
            // The application name defaults to the assembly name.
            string serviceName = Assembly.GetEntryAssembly().GetName().Name;

            ILoggerFactory loggerFactory = serviceProvider.GetRequiredService<ILoggerFactory>();

            ISampler sampler = new ConstSampler(sample: true);

            IReporter reporter = new RemoteReporter.Builder()
                .WithSender(new HttpSender.Builder(_jaegerUri.ToString()).Build())
                .Build();

            ITracer tracer = new Tracer.Builder(serviceName)
                .WithLoggerFactory(loggerFactory)
                .WithSampler(sampler)
                .WithReporter(reporter)
                .Build();

            GlobalTracer.Register(tracer);

            return tracer;
        });

        // Prevent endless loops when OpenTracing tracks
        // HTTP requests to the Jaeger endpoint.
        services.Configure<HttpHandlerDiagnosticOptions>(options =>
        {
            options.IgnorePatterns.Add(request => _jaegerUri.IsBaseOf(request.RequestUri));
        });

        return services;
    }
}
Replace the following placeholder:
| Placeholder | Description | Example |
|---|---|---|
<your-jaeger-endpoint> | Jaeger endpoint from the console | http://tracing-analysis-dc-sz.aliyuncs.com/adapt_your_token/api/traces |
Step 2: Run the application
Navigate to the dotnet-demo/net6.0/CustomersApi directory and run:
dotnet run --framework:net6.0Step 3: Verify trace data
Access the health endpoint to confirm the application is running:
http://localhost:5001/healthIn the Managed Service for OpenTelemetry console, open the Applications page and search for your application by name. Trace data should appear within a few moments.
Instrument a .NET Core 3.1 application with ASP.NET Core
Step 1: Configure the Jaeger endpoint
Open dotnet-demo/netcoreapp3.1/Shared/JaegerServiceCollectionExtensions.cs. Set the Jaeger endpoint URL:
public static class JaegerServiceCollectionExtensions
{
    // Replace with your Jaeger endpoint.
    // See the "Get a Jaeger endpoint" section for details.
    private static readonly Uri _jaegerUri = new Uri("<your-jaeger-endpoint>");

    public static IServiceCollection AddJaeger(this IServiceCollection services)
    {
        if (services == null)
            throw new ArgumentNullException(nameof(services));

        services.AddSingleton<ITracer>(serviceProvider =>
        {
            // The application name defaults to the assembly name.
            string serviceName = Assembly.GetEntryAssembly().GetName().Name;

            ILoggerFactory loggerFactory = serviceProvider.GetRequiredService<ILoggerFactory>();

            ISampler sampler = new ConstSampler(sample: true);

            IReporter reporter = new RemoteReporter.Builder()
                .WithSender(new HttpSender.Builder(_jaegerUri.ToString()).Build())
                .Build();

            ITracer tracer = new Tracer.Builder(serviceName)
                .WithLoggerFactory(loggerFactory)
                .WithSampler(sampler)
                .WithReporter(reporter)
                .Build();

            GlobalTracer.Register(tracer);

            return tracer;
        });

        // Prevent endless loops when OpenTracing tracks
        // HTTP requests to the Jaeger endpoint.
        services.Configure<HttpHandlerDiagnosticOptions>(options =>
        {
            options.IgnorePatterns.Add(request => _jaegerUri.IsBaseOf(request.RequestUri));
        });

        return services;
    }
}
Step 2: Install the ASP.NET Core middleware
Install the OpenTracing middleware in both the Shared and CustomersApi directories:
# In the dotnet-demo/netcoreapp3.1/Shared directory
dotnet add package OpenTracing.Contrib.NetCore

# In the dotnet-demo/netcoreapp3.1/CustomersApi directory
dotnet add package OpenTracing.Contrib.NetCore
Step 3: Run the application
Navigate to the dotnet-demo/netcoreapp3.1/CustomersApi directory and run:
dotnet run --framework:netcoreapp3.1Step 4: Verify trace data
Access the health endpoint to confirm the application is running:
http://localhost:5001/healthIn the Managed Service for OpenTelemetry console, open the Applications page and search for your application by name. Trace data should appear within a few moments.
Instrument a .NET Core 3.1 application with gRPC
Step 1: Install the required NuGet packages
# gRPC middleware for OpenTracing
dotnet add package OpenTracing.Contrib.grpc

# Jaeger implementation of OpenTracing
dotnet add package Jaeger
Step 2: Initialize the ITracer object
Configure the tracer with your Jaeger endpoint:
public static Tracer InitTracer(string serviceName, ILoggerFactory loggerFactory)
{
    Configuration.SamplerConfiguration samplerConfiguration = new Configuration.SamplerConfiguration(loggerFactory)
        .WithType(ConstSampler.Type)
        .WithParam(1);

    Configuration.SenderConfiguration senderConfiguration = new Configuration.SenderConfiguration(loggerFactory)
        // Replace with your Jaeger endpoint.
        .WithEndpoint("<your-jaeger-endpoint>");

    Configuration.ReporterConfiguration reporterConfiguration = new Configuration.ReporterConfiguration(loggerFactory)
        .WithSender(senderConfiguration);

    return (Tracer)new Configuration(serviceName, loggerFactory)
        .WithSampler(samplerConfiguration)
        .WithReporter(reporterConfiguration)
        .GetTracer();
}
Step 3: Add server-side instrumentation
Build a ServerTracingInterceptor and bind it to the gRPC server:
ILoggerFactory loggerFactory = new LoggerFactory().AddConsole();
ITracer tracer = TracingHelper.InitTracer("dotnetGrpcServer", loggerFactory);
ServerTracingInterceptor tracingInterceptor = new ServerTracingInterceptor(tracer);
Server server = new Server
{
    Services = { Greeter.BindService(new GreeterImpl()).Intercept(tracingInterceptor) },
    Ports = { new ServerPort("localhost", Port, ServerCredentials.Insecure) }
};
Step 4: Add client-side instrumentation
Build a ClientTracingInterceptor and bind it to the channel:
ILoggerFactory loggerFactory = new LoggerFactory().AddConsole();
ITracer tracer = TracingHelper.InitTracer("dotnetGrpcClient", loggerFactory);
ClientTracingInterceptor tracingInterceptor = new ClientTracingInterceptor(tracer);
Channel channel = new Channel("127.0.0.1:50051", ChannelCredentials.Insecure);

var client = new Greeter.GreeterClient(channel.Intercept(tracingInterceptor));
Step 5: Run the server and client
Start the gRPC server. Navigate to the
dotnet-demo/netcoreapp3.1/GreeterServerdirectory and run:dotnet run --framework:netcoreapp3.1In a separate terminal, start the gRPC client. Navigate to the
dotnet-demo/netcoreapp3.1/GreeterClientdirectory and run:dotnet run --framework:netcoreapp3.1
If the output shows Greeting: Hello you, the server and client are connected. The trace data for dotnetGrpcServer and dotnetGrpcClient now appears in the Managed Service for OpenTelemetry console.
Manually instrument a .NET Core 3.1 application
Use manual instrumentation when the available plug-ins do not meet your requirements.
Step 1: Install the required NuGet packages
# Jaeger implementation of OpenTracing
dotnet add package Jaeger

# Console logging
dotnet add package Microsoft.Extensions.Logging.Console
Step 2: Create an ITracer object
Specify the Jaeger endpoint and sample rate during initialization:
public static ITracer InitTracer(string serviceName, ILoggerFactory loggerFactory)
{
    Configuration.SamplerConfiguration samplerConfiguration = new Configuration.SamplerConfiguration(loggerFactory)
        .WithType(ConstSampler.Type)
        .WithParam(1);

    Configuration.SenderConfiguration senderConfiguration = new Configuration.SenderConfiguration(loggerFactory)
        // Replace with your Jaeger endpoint.
        .WithEndpoint("<your-jaeger-endpoint>");

    Configuration.ReporterConfiguration reporterConfiguration = new Configuration.ReporterConfiguration(loggerFactory)
        .WithSender(senderConfiguration);

    return (Tracer)new Configuration(serviceName, loggerFactory)
        .WithSampler(samplerConfiguration)
        .WithReporter(reporterConfiguration)
        .GetTracer();
}
Step 3: Register the tracer globally
Register the ITracer object with GlobalTracer for convenient access throughout your application:
GlobalTracer.Register(InitTracer("dotnetManualDemo", loggerFactory));Step 4: Create spans to record requests
Create a span to record a request:
ITracer tracer = GlobalTracer.Instance;
ISpan span = tracer.BuildSpan("parentSpan").WithTag("mytag", "parentSapn").Start();
tracer.ScopeManager.Activate(span, false);
// ... your business logic
span.Finish();
To record nested operations within the same request, use AsChildOf to create child spans:
ITracer tracer = GlobalTracer.Instance;
ISpan parentSpan = tracer.ActiveSpan;
ISpan childSpan = tracer.BuildSpan("childSpan").AsChildOf(parentSpan).WithTag("mytag", "spanSecond").Start();
tracer.ScopeManager.Activate(childSpan, false);
// ... your business logic
childSpan.Finish();
Step 5 (optional): Add custom tags
Add custom tags to spans for easier troubleshooting. For example, record the HTTP status code:
tracer.activeSpan().setTag("http.status_code", "200");Step 6: Propagate trace context across services
In a distributed system, Remote Procedure Call (RPC) requests carry trace data (TraceId, ParentSpanId, SpanId, and Sampled) in HTTP headers. Use Inject on the client and Extract on the server to pass this context.
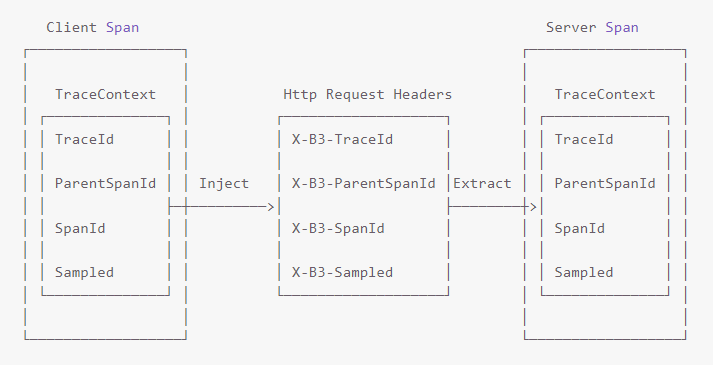
Inject the span context into the outgoing request headers on the client:
Tracer.Inject(span.Context, BuiltinFormats.HttpHeaders, new HttpHeadersInjectAdapter(request.Headers));Extract the span context from the incoming request headers on the server:
ISpanContext extractedSpanContext = _tracer.Extract(BuiltinFormats.HttpHeaders, new RequestHeadersExtractAdapter(request.Headers));
ISpan childSpan = _tracer.BuildSpan(operationName).AsChildOf(extractedSpanContext);
Step 7: Run the application
Navigate to the dotnet-demo/netcoreapp3.1/ManualDemo directory and run:
dotnet run --framework:netcoreapp3.1The trace data for dotnetManualDemo now appears in the Managed Service for OpenTelemetry console.
FAQ
Why does no trace data appear after running the demo?
Check the endpoint in senderConfiguration. An incorrect or expired endpoint is the most common cause.
Configuration.SenderConfiguration senderConfiguration = new Configuration.SenderConfiguration(loggerFactory)
    // Verify this URL matches the endpoint from your console.
    .WithEndpoint("http://tracing-analysis-dc-sz.aliyuncs.com/adapt_your_token/api/traces");
If the endpoint is correct, verify that your network can reach it. Applications in an Alibaba Cloud VPC must use a VPC endpoint, not a public one.
How do I configure the sample rate?
See the Jaeger C# client sampler documentation for available strategies and configuration options.