When you run distributed .NET services, tracing requests across service boundaries is essential for diagnosing latency and failures. OpenTelemetry provides a vendor-neutral instrumentation standard for .NET applications. After you instrument your application and export traces to Managed Service for OpenTelemetry, the console displays application topology, traces, abnormal transactions, slow transactions, and SQL analysis.
This guide covers three instrumentation approaches. Start with automatic instrumentation to get traces flowing quickly, then add manual spans for application-specific operations as needed.
| Approach | Best for | Effort |
|---|---|---|
| Automatic instrumentation | Quick setup with zero code changes (.NET 6+) | Low |
| Manual instrumentation | Full control over which operations generate spans | Medium |
| Automatic + manual instrumentation | Auto-instrumented frameworks plus custom spans for business logic (recommended for production) | Medium |
Sample code
Download complete working examples from the dotnet-demo repository.
.NET and OpenTelemetry concepts
.NET implements the OpenTelemetry Tracing API through its System.Diagnostics namespace, so the class names differ from other languages:
| OpenTelemetry concept | .NET equivalent | Description |
|---|---|---|
| Tracer | ActivitySource | Creates spans for a named component |
| Span | Activity | Represents a single operation in a trace |
| TracerProvider | TracerProvider | Manages tracer lifecycle and exporter pipeline |
In .NET code, you use ActivitySource where other languages use a tracer, and Activity where other languages use a span.
Automatic instrumentation
Automatic instrumentation captures traces from supported frameworks without code changes. OpenTelemetry injects instrumentation at runtime through a startup hook.
Limitations
Requires .NET SDK 6.0 or later
Does not support .NET Framework
For supported frameworks, see Available instrumentations in the OpenTelemetry documentation
Step 1: Create a sample ASP.NET Core application
If you already have a .NET 6+ application, skip to Step 2.
Create a new web application:
   mkdir dotnet-simple-demo
   cd dotnet-simple-demo
   dotnet new web
Replace the contents of
Properties/launchSettings.json:{ "$schema": "http://json.schemastore.org/launchsettings.json", "profiles": { "http": { "commandName": "Project", "dotnetRunMessages": true, "launchBrowser": true, "applicationUrl": "http://localhost:8080", "environmentVariables": { "ASPNETCORE_ENVIRONMENT": "Development" } } } }Build the application:
dotnet build
Step 2: Install the automatic instrumentation agent
Download and run the OpenTelemetry .NET automatic instrumentation installer:
curl -L -O https://github.com/open-telemetry/opentelemetry-dotnet-instrumentation/releases/latest/download/otel-dotnet-auto-install.sh

./otel-dotnet-auto-install.sh
Step 3: Configure and run the application
Set the required environment variables and activate the instrumentation agent. Replace the placeholders with your actual values.
NoteFor more configuration options, see Configuration and settings in the OpenTelemetry documentation.
Variable Description Example <service-name>Application name displayed in the Managed Service for OpenTelemetry console my-dotnet-app<endpoint>gRPC endpoint from your Managed Service for OpenTelemetry instance -- <token>Authentication token from your Managed Service for OpenTelemetry instance -- export OTEL_TRACES_EXPORTER=otlp \ OTEL_METRICS_EXPORTER=none \ OTEL_LOGS_EXPORTER=none \ OTEL_SERVICE_NAME=<service-name> \ OTEL_EXPORTER_OTLP_PROTOCOL=grpc \ OTEL_EXPORTER_OTLP_ENDPOINT=<endpoint> \ OTEL_EXPORTER_OTLP_HEADERS="Authentication=<token>" . $HOME/.otel-dotnet-auto/instrument.shRun the application:
dotnet runGenerate trace data by sending a request: The automatic instrumentation agent captures this HTTP request and exports the resulting trace to Managed Service for OpenTelemetry.
curl localhost:8080/
Verify traces
After sending a few requests, open the Managed Service for OpenTelemetry console. On the Applications page, find your application by the service name you configured. Click the application name to view traces, topology, and other monitoring data.
If your application does not appear within a few minutes:
Confirm the endpoint URL and token are correct.
Verify the instrumentation script was sourced successfully (
. $HOME/.otel-dotnet-auto/instrument.sh).Check for error messages in the application's standard error output.
Manual instrumentation
Manual instrumentation gives you full control over which operations produce spans. Use this approach to trace specific business logic, or when targeting .NET versions that do not support automatic instrumentation.
Supported .NET versions
.NET 5.0 and later
.NET Core 2.0 and later
.NET Framework 4.6.1 and later
Step 1: Add NuGet packages
Navigate to your project directory (for the sample code, use dotnet-demo/opentelemetry-demo/manual-demo) and add the required packages:
dotnet add package OpenTelemetry
dotnet add package OpenTelemetry.Exporter.OpenTelemetryProtocol
dotnet add package OpenTelemetry.Extensions.Hosting
dotnet add package OpenTelemetry.Exporter.Console  # Optional: prints trace data to stdout
Step 2: Initialize the TracerProvider and create spans
Create a file named OpentelemetryExporterDemo.cs with the following code:
using System.Diagnostics;
using OpenTelemetry;
using OpenTelemetry.Trace;
using OpenTelemetry.Resources;
using OpenTelemetry.Exporter;

namespace Demo
{
    internal static class OpentelemetryExporterDemo
    {
        internal static void Run()
        {
            Console.WriteLine("otlp running");

            // Set the service name that appears in the Managed Service for OpenTelemetry console.
            var serviceName = "otlp-test";

            using var tracerProvider = Sdk.CreateTracerProviderBuilder()
                .AddSource(serviceName)
                .SetResourceBuilder(
                    ResourceBuilder.CreateDefault().AddService(serviceName))
                .AddOtlpExporter(opt =>
                {
                    // Replace with your Managed Service for OpenTelemetry HTTP endpoint.
                    opt.Endpoint = new Uri("<endpoint>");
                    opt.Protocol = OtlpExportProtocol.HttpProtobuf;
                })
                .AddConsoleExporter() // Optional: export to stdout for debugging
                .Build();

            // Create spans using ActivitySource (the .NET equivalent of an OpenTelemetry Tracer).
            for (int i = 0; i < 10; i++)
            {
                var MyActivitySource = new ActivitySource(serviceName);
                using var activity = MyActivitySource.StartActivity("SayHello");
                activity?.SetTag("bar", "Hello World");
            }
        }
    }
}| Placeholder | Description |
|---|---|
<endpoint> | The HTTP endpoint from your Managed Service for OpenTelemetry instance |
Step 3: Update Program.cs
Modify Program.cs to call the demo:
using System.Diagnostics;
using System.Net.Http;
using OpenTelemetry;
using OpenTelemetry.Resources;
using OpenTelemetry.Trace;

namespace Demo
{
    public class Otlp
    {
        public static void Main(string[] args)
        {
            OpentelemetryExporterDemo.Run();
        }
    }
}
Step 4: Run and verify
dotnet runIf you included AddConsoleExporter(), the console output displays the generated spans. The spans are also exported to your Managed Service for OpenTelemetry instance.
Expected console output:
otlp running
Activity.TraceId:          abc123def456...
Activity.SpanId:           789ghi012...
Activity.TraceFlags:       Recorded
Activity.DisplayName:      SayHello
Activity.Source.Name:      otlp-test
...
Open the Managed Service for OpenTelemetry console and check the Applications page for your service name (otlp-test).
Combine automatic and manual instrumentation
Use automatic instrumentation to capture traces from supported frameworks (such as ASP.NET Core HTTP handling) and add manual spans for application-specific operations. For production applications that need both broad coverage and fine-grained tracing, this is the recommended approach.
OpenTelemetry provides automatic trace instrumentation for dozens of .NET frameworks. For a full list, see Traces instrumentations.
Step 1: Create an ASP.NET Core MVC application
Navigate to the dotnet-demo/opentelemetry-demo/auto-demo directory and create a new project:
mkdir <your-project-name>
cd <your-project-name>
dotnet new mvc
Step 2: Add NuGet packages
# Exporters
dotnet add package OpenTelemetry.Exporter.Console
dotnet add package OpenTelemetry.Exporter.OpenTelemetryProtocol

# SDK and hosting integration
dotnet add package OpenTelemetry.Extensions.Hosting

# Automatic instrumentation for ASP.NET Core
dotnet add package OpenTelemetry.Instrumentation.AspNetCoreTo instrument additional frameworks (such as HttpClient, gRPC, or Entity Framework Core), add the corresponding OpenTelemetry.Instrumentation.* package. See Traces instrumentations for available packages.
Step 3: Configure OpenTelemetry in Program.cs
Add the following imports at the top of Program.cs:
using System.Diagnostics;
using OpenTelemetry.Exporter;
using OpenTelemetry.Resources;
using OpenTelemetry.Trace;
Add the DiagnosticsConfig class at the end of the file. Replace the placeholders with your actual values:
public static class DiagnosticsConfig
{
    public const string ServiceName = "<your-service-name>";  // Appears in the console
    public const string HostName = "<your-host-name>";        // Identifies the host machine
    public static ActivitySource ActivitySource = new ActivitySource(ServiceName);
}
Add the OpenTelemetry initialization code after var builder = WebApplication.CreateBuilder(args);. Choose one of the following exporter configurations:
Export over OTLP/HTTP:
builder.Services.AddOpenTelemetry()
    .WithTracing(tracerProviderBuilder =>
        tracerProviderBuilder
            .AddSource(DiagnosticsConfig.ActivitySource.Name)
            .SetResourceBuilder(OpenTelemetry.Resources.ResourceBuilder.CreateDefault()
                .AddAttributes(new Dictionary<string, object> {
                    {"service.name", DiagnosticsConfig.ServiceName},
                    {"host.name", DiagnosticsConfig.HostName}
                }))
            .AddAspNetCoreInstrumentation()
            .AddConsoleExporter() // Optional: prints trace data to stdout
            .AddOtlpExporter(opt =>
            {
                opt.Endpoint = new Uri("<http_endpoint>");
                opt.Protocol = OtlpExportProtocol.HttpProtobuf;
            })
     );
Export over OTLP/gRPC:
builder.Services.AddOpenTelemetry()
    .WithTracing(tracerProviderBuilder =>
        tracerProviderBuilder
            .AddSource(DiagnosticsConfig.ActivitySource.Name)
            .SetResourceBuilder(OpenTelemetry.Resources.ResourceBuilder.CreateDefault()
                .AddAttributes(new Dictionary<string, object> {
                    {"service.name", DiagnosticsConfig.ServiceName},
                    {"host.name", DiagnosticsConfig.HostName}
                }))
            .AddAspNetCoreInstrumentation()
            .AddConsoleExporter() // Optional: prints trace data to stdout
            .AddOtlpExporter(opt =>
            {
                opt.Endpoint = new Uri("<grpc_endpoint>");
                opt.Headers = "Authentication=<token>";
                opt.Protocol = OtlpExportProtocol.Grpc;
            })
);| Placeholder | Description |
|---|---|
<your-service-name> | Application name displayed in the Managed Service for OpenTelemetry console |
<your-host-name> | Hostname of the machine running the application |
<http_endpoint> | HTTP endpoint from your Managed Service for OpenTelemetry instance |
<grpc_endpoint> | gRPC endpoint from your Managed Service for OpenTelemetry instance |
<token> | Authentication token (required for gRPC only) |
Step 4: Run the application
dotnet runExpected output:
Building...
info: Microsoft.Hosting.Lifetime[14]
      Now listening on: http://localhost:5107
info: Microsoft.Hosting.Lifetime[0]
      Application started. Press Ctrl+C to shut down.
info: Microsoft.Hosting.Lifetime[0]
      Hosting environment: Development
info: Microsoft.Hosting.Lifetime[0]
      Content root path: /path/to/<your-project-name>
Copy the URL from the output (for example, http://localhost:5107).
Step 5: Generate and verify traces
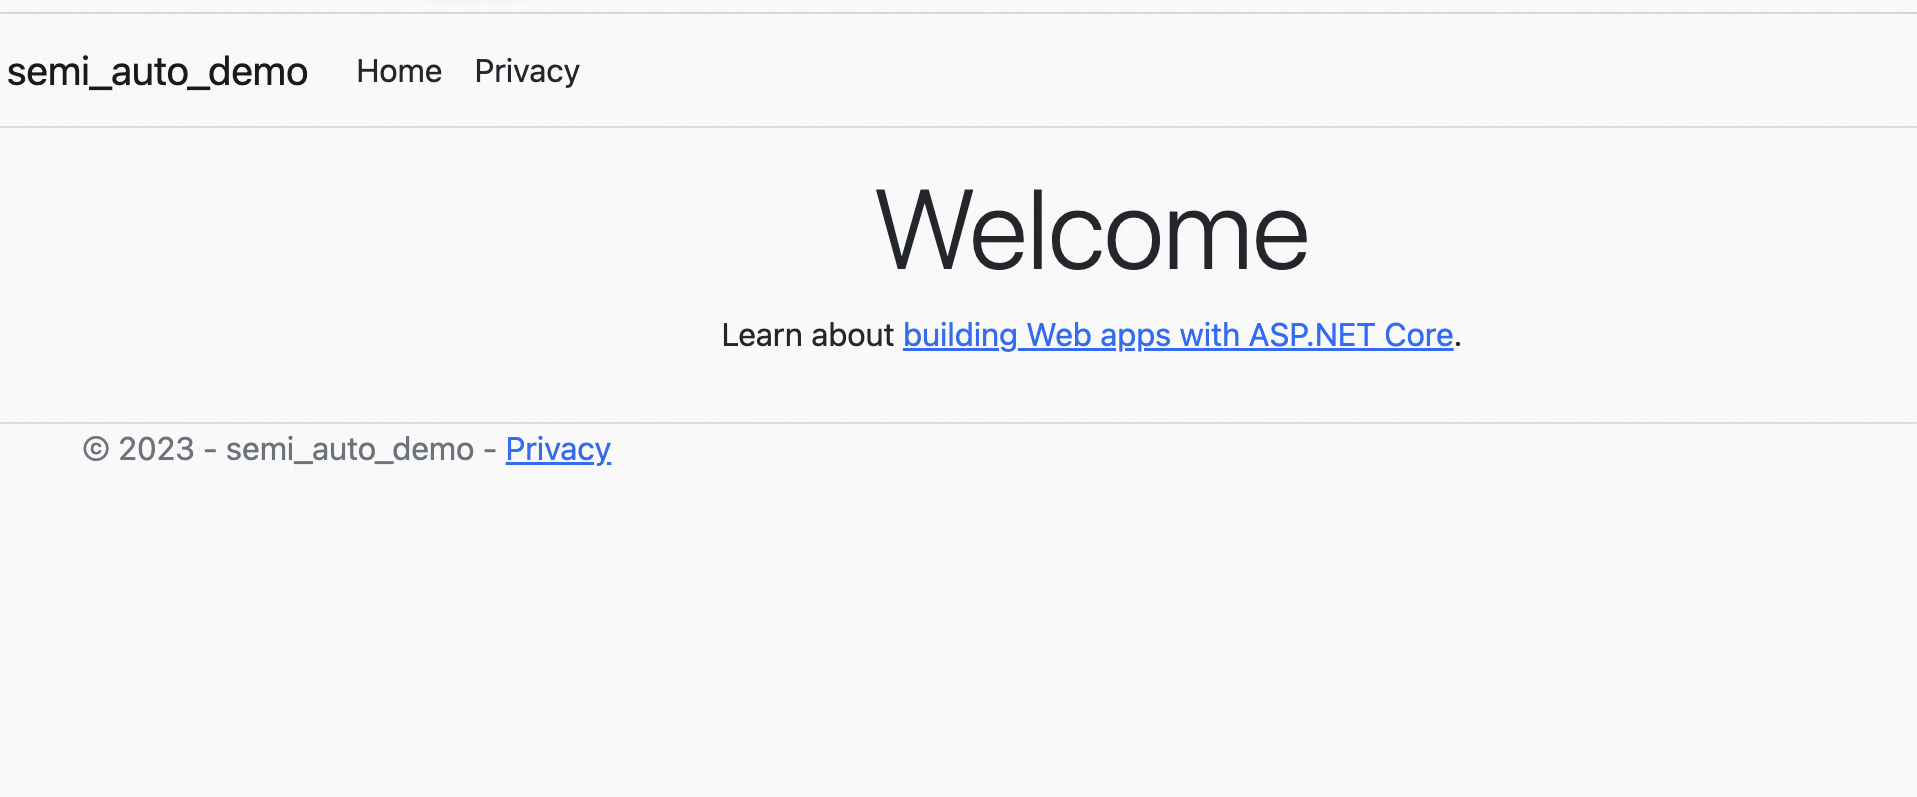
Open
http://localhost:5107in a browser. If the default ASP.NET Core welcome page loads, the application is running.If you included
AddConsoleExporter(), check the terminal for trace output. Each HTTP request produces a span similar to:Activity.TraceId: abc123def456... Activity.SpanId: 789ghi012... Activity.TraceFlags: Recorded Activity.ActivitySourceName: Microsoft.AspNetCore Activity.DisplayName: GET / ...Open the Managed Service for OpenTelemetry console. On the Applications page, find your application by the service name you configured and verify that trace data is flowing.
Supported frameworks for manual and semi-automatic instrumentation
| Framework | Windows .NET Framework | Cross-platform .NET (.NET Core) | Supported version | Instrumented library |
|---|---|---|---|---|
| ASP.NET | Yes | Not supported for MVC and Web API | N/A | N/A |
| ASP.NET Core | N/A | Yes | N/A | N/A |
| Azure | Yes | Yes | Packages with the Azure. prefix released after October 1, 2021 | Azure SDK |
| Elasticsearch | Yes | Yes | V8.0.0 up to, but not including, V8.10.0. V8.10.0 and later are covered by Elasticsearch Transport. | Elastic.Clients.Elasticsearch |
| Elasticsearch Transport | Yes | Yes | V0.4.16 and later | Elastic.Transport |
| Entity Framework Core | N/A | Yes | V6.0.12 and later | Microsoft.EntityFrameworkCore |
| GraphQL | N/A | Yes | V7.5.0 and later | GraphQL |
| gRPC Client | Yes | Yes | V2.52.0 up to, but not including, V3.0.0 | Grpc.Net.Client |
| HttpClient | Yes | Yes | All versions | System.Net.Http.HttpClient, System.Net.HttpWebRequest |
| Quartz | V4.7.1 and earlier not supported | Yes | V3.4.0 and later | Quartz |
| MassTransit | N/A | Yes | V8.0.0 and later | MassTransit |
| MongoDB | Yes | Yes | V2.13.3 up to, but not including, V3.0.0 | MongoDB.Driver.Core |
| MySQL Connector | Yes | Yes | V2.0.0 and later | MySqlConnector |
| MySQL Data | N/A | Yes | V8.1.0 and later | MySql.Data |
| Npgsql | Yes | Yes | V6.0.0 and later | Npgsql |
| NServiceBus | Yes | Yes | V8.0.0 and later | NServiceBus |
| SQL Client | Yes | Yes | Microsoft.Data.SqlClient V3 not supported | Microsoft.Data.SqlClient, System.Data.SqlClient, System.Data (shipped with .NET Framework) |
| StackExchange.Redis | N/A | Yes | V2.0.405 up to, but not including, V3.0.0 | StackExchange.Redis |
| WCF Client | Yes | Yes | N/A | N/A |
| WCF Service | Yes | N/A | N/A | N/A |
What's next
View trace data on the Applications page of the Managed Service for OpenTelemetry console.
Add more instrumentation libraries for frameworks such as HttpClient, Entity Framework Core, or gRPC.
Fine-tune automatic instrumentation with additional environment variables for sampling, resource attributes, and more.