After you instrument your application with OpenTelemetry and report Managed Service for OpenTelemetry to Managed Service for OpenTelemetry, the service begins monitoring your application. You can view a wide range of monitoring data, including application topology, traces, exceptions, slow transactions, and SQL analysis. This topic shows you how to use OpenTelemetry to instrument a Swift application and report its data.
Prerequisites
New console
-
Log on to the Managed Service for OpenTelemetry console. In the left-side navigation pane, click Integration Center.
-
On the Integration Center page, click the OpenTelemetry card in the Open Source Frameworks section.
-
In the OpenTelemetry panel, click the Start Integration tab, and then select a region in which you want to report data.
NoteWhen you access a region for the first time, resources are automatically initialized there.
-
Configure the Connection Type and Export Protocol parameters and copy an endpoint.
-
Connection Type: If your service is deployed on Alibaba Cloud and resides in the region that you selected, we recommend that you set this parameter to Alibaba Cloud VPC Network. Otherwise, set this parameter to Public Network.
-
Export Protocol: Set this parameter to HTTP (recommended) or gRPC based on the protocol that is supported by the client.

-
Old console
-
Log on to the Managed Service for OpenTelemetry console.
-
In the left-side navigation pane, click Cluster Configurations. On the page that appears, click the Access point information tab.
-
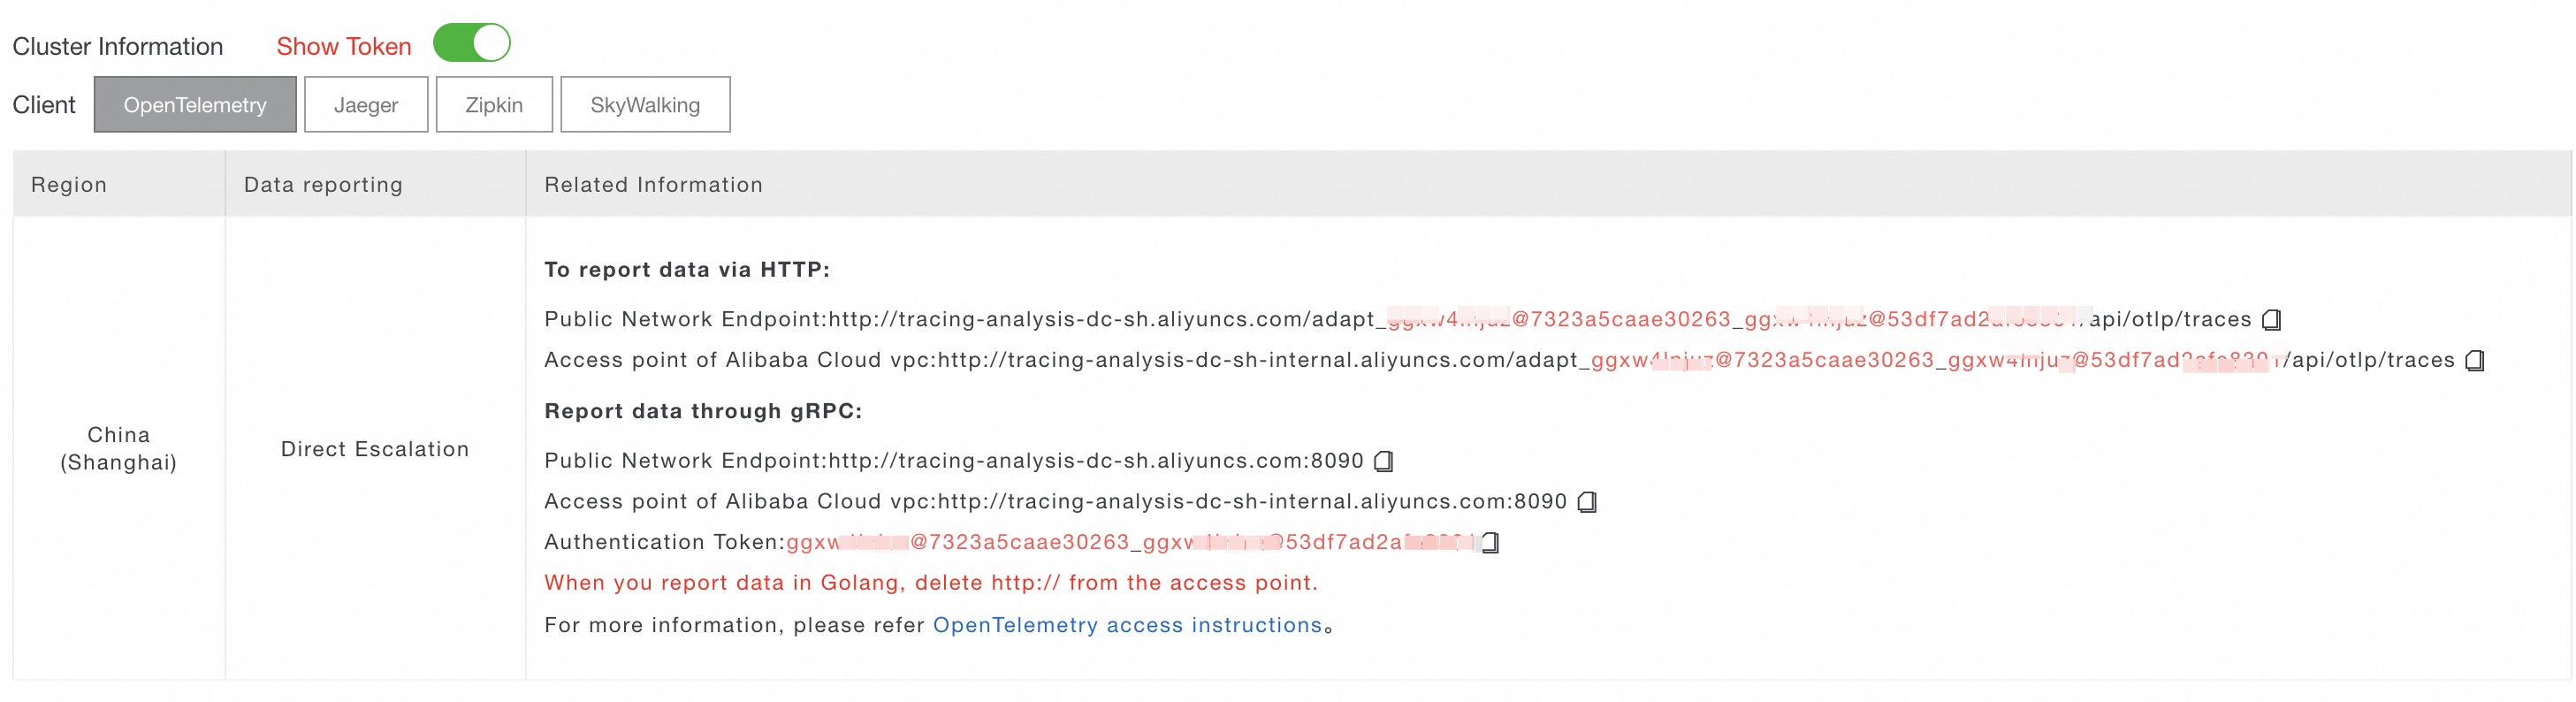
In the top navigation bar, select a region in which you want to report data. In the Cluster Information section, turn on Show Token.
-
Set the Client parameter to OpenTelemetry.
In the Related Information column of the table, copy an endpoint.
 Note
NoteIf your application is deployed in an Alibaba Cloud production environment, use a virtual private cloud (VPC) endpoint. Otherwise, use a public endpoint.
Demo
This topic demonstrates how to use OpenTelemetry to report data from a macOS command-line application written in Swift. This method also applies to iOS applications.
Sample code repository: opentelemetry-swift-demo
Step 1: Create an application and add dependencies
-
Create a macOS Command Line Tool application in Xcode.
-
In Xcode, select , enter
https://github.com/open-telemetry/opentelemetry-swiftin the search box, and select version 1.4.1.NoteFor more information about versions, see opentelemetry-swift releases.
Navigate to File > Add Packages. In the search bar, enter
https://github.com/open-telemetry/opentelemetry-swiftand select the opentelemetry-swift package. Set the Dependency Rule to Exact Version, enter1.4.1as the version, select your project from the Add to Project menu, and then click Add Package. -
Select the required package products.
The package products required for this demo include OpenTelemetryApi, OpenTelemetryProtocolExporter, OpenTelemetrySdk, ResourceExtension, StdoutExporter, and URLSessionInstrumentation.
Step 2: Initialize OpenTelemetry
-
Create an exporter to send telemetry data.
Choose one of the following three methods to report trace data.
-
Method 1: Report trace data over gRPC
-
Replace
<YOUR_GRPC_ENDPOINT>and<YOUR_GRPC_PORT>with the endpoint information from the Prerequisites section. Example:host: "tracing-analysis-dc-hz.aliyuncs.com", port: 8090. -
Replace
<YOUR_AUTHENTICATION_TOKEN>with the authentication token from the Prerequisites section.
let grpcChannel = ClientConnection( configuration: ClientConnection.Configuration.default( target: .hostAndPort("<YOUR_GRPC_ENDPOINT>", <YOUR_GRPC_PORT>), // Example endpoint: tracing-analysis-dc-hz.aliyuncs.com. Do not include the "http://" prefix. eventLoopGroup: MultiThreadedEventLoopGroup(numberOfThreads: 1) ) ) let otlpGrpcConfiguration = OtlpConfiguration( timeout: OtlpConfiguration.DefaultTimeoutInterval, headers: [ ("Authentication","<YOUR_AUTHENTICATION_TOKEN>") ] ) let otlpGrpcTraceExporter = OtlpTraceExporter(channel: grpcChannel, config: otlpGrpcConfiguration) -
-
Method 2: Report trace data over HTTP
Replace
<YOUR_HTTP_ENDPOINT>with the endpoint URL from the Prerequisites section. Example:http://tracing-analysis-dc-hz.aliyuncs.com/adapt_xxxx@xxxx_xxxx@xxxx/api/otlp/traces.let url = URL(string: "<YOUR_HTTP_ENDPOINT>") let otlpHttpTraceExporter = OtlpHttpTraceExporter(endpoint: url!) -
Method 3: Print trace data to the console
let consoleTraceExporter = StdoutExporter(isDebug: true)
-
-
Get a tracer to create spans.
-
Replace
<YOUR_SERVICE_NAME>with your application name and<YOUR_HOSTNAME>with your hostname. -
Replace
<trace-exporter>based on the method you chose in the previous step.-
Method 1: Replace
<trace-exporter>withotlpGrpcTraceExporter. -
Method 2: Replace
<trace-exporter>withotlpHttpTraceExporter. -
Method 3: Replace
<trace-exporter>withconsoleTraceExporter.
-
// Set the application name and hostname. let resource = Resource(attributes: [ ResourceAttributes.serviceName.rawValue: AttributeValue.string("<YOUR_SERVICE_NAME>"), ResourceAttributes.hostName.rawValue: AttributeValue.string("<YOUR_HOSTNAME>") ]) // Configure the TracerProvider. OpenTelemetry.registerTracerProvider(tracerProvider: TracerProviderBuilder() .add(spanProcessor: BatchSpanProcessor(spanExporter: <trace-exporter>)) // Report to Managed Service for OpenTelemetry. .with(resource: resource) .build()) // Get a tracer to create spans. let tracer = OpenTelemetry.instance.tracerProvider.get(instrumentationName: "instrumentation-library-name", instrumentationVersion: "1.0.0") -
Step 3: Create spans to track trace data
-
Create a span, add an attribute and an event, and print its trace ID.
let span = tracer.spanBuilder(spanName: "first span").startSpan() // Set an attribute. span.setAttribute(key: "http.method", value: "GET") span.setAttribute(key: "http.url", value: "www.aliyun.com") let attributes = [ "key": AttributeValue.string("value"), "result": AttributeValue.int(100) ] // your code... // Set an event. span.addEvent(name: "computation complete", attributes: attributes) // Print the TraceId. print(span.context.traceId.hexString) // your code... // End the current span. span.end() -
Create a nested span.
let parentSpan = tracer.spanBuilder(spanName: "parent span").startSpan() // your code... let childSpan = tracer.spanBuilder(spanName: "child span").setParent(parentSpan).startSpan() // your code... childSpan.end() // your code... parentSpan.end() -
Start the application.
On the Applications page of the Managed Service for OpenTelemetry console, click the name of the application. On the page that appears, view the trace data.
Step 4: Connect the client and server traces
-
Modify the trace context propagation format in the request headers.
-
Different protocols use different HTTP headers to propagate the trace context to downstream services. For example, OpenTelemetry uses the W3C Trace Context format by default but also supports other formats, while Zipkin uses the B3 or B3 Multi format. For more information, see Configure trace context propagation formats for OpenTelemetry.
-
To connect client and server traces, set the propagation format (
textPropagatorsandbaggagePropagator) in the client to match the server's protocol:-
If the server uses the default OpenTelemetry W3C Trace Context format, you do not need to set
textPropagatorsandbaggagePropagatorin the client. -
If the server uses the Zipkin B3 or B3 Multi format, set
textPropagatorstoB3PropagatorandbaggagePropagatortoZipkinBaggagePropagatorin the client.// Set the B3 propagation format. OpenTelemetry.registerPropagators(textPropagators: [B3Propagator()], baggagePropagator: ZipkinBaggagePropagator()) -
If the server uses the Jaeger protocol, set
textPropagatorstoJaegerPropagatorandbaggagePropagatortoJaegerBaggagePropagatorin the client.// Set the Jaeger propagation format. OpenTelemetry.registerPropagators(textPropagators: [JaegerPropagator()], baggagePropagator: JaegerBaggagePropagator()) -
You can also set multiple trace propagation formats simultaneously.
// Use the W3C Trace Context, B3, and Jaeger formats at the same time.
OpenTelemetry.registerPropagators(textPropagators: [W3CTraceContextPropagator(),
                                                    B3Propagator(),
                                                    JaegerPropagator()],
                                  baggagePropagator: W3CBaggagePropagator())
-
-
-
Import
URLSessionInstrumentation.URLSessionInstrumentationis a plug-in that automatically interceptsURLSessionnetwork requests to create traces.import URLSessionInstrumentation ... let networkInstrumentation = URLSessionInstrumentation(configuration: URLSessionInstrumentationConfiguration()) -
Use
URLSessionto send a network request to the server.let url = URL(string: "<YOUR_SERVER_ADDRESS>")! let request = URLRequest(url: url) let semaphore = DispatchSemaphore(value: 0) let task = URLSession.shared.dataTask(with: request) { data, _, _ in if let data = data { let string = String(decoding: data, as: UTF8.self) print(string) } semaphore.signal() } task.resume() semaphore.wait() -
Start the application and view the connected client-server trace on the Trace Explorer page.
In the trace,
HTTP GETrepresents the iOS application andzipkin-demo-serverrepresents the server application.Request attributes such as
http.method=GET,http.status_code=200, andhttp.url=http://localhost:8081/zipkin/serverappear in the Additional Information > Attributes section of the span.