Slow or overly frequent SQL queries degrade application performance and increase database costs. The Database Calls page in Managed Service for OpenTelemetry surfaces call counts, average response times, and associated traces for each SQL statement, so you can pinpoint problematic queries and trace them back to the originating request.
Metrics reference
The SQL Analysis tab provides two levels of insight:
| Level | Metrics |
|---|---|
| Aggregate | Total SQL call count per minute and average response time over the selected time range |
| Per-statement | Call count and average response time for each individual SQL statement |
Each SQL statement supports two drill-down actions from the Actions column:
| Action | Description |
|---|---|
| Call Statistics | Per-minute breakdown of call volume and response time trends for the selected statement |
| Trace Query | All traces that include the selected SQL statement, displayed on the Traces tab |
View SQL analysis results
Before you begin, make sure you have:
Instrumented your application and reported trace data. See Preparations
Verified that your application appears in the console. See Manage applications and tags
To view SQL analysis results:
Log on to the Tracing Analysis console.
In the left-side navigation pane, click Applications.
On the Applications page, select a region in the top navigation bar, then click the application name.
In the left-side navigation pane, click Database Calls.
On the SQL Analysis tab, review the aggregate call count and average response time charts.
Locate a specific SQL statement in the list, then use the Actions column:
Click Call Statistics to view per-minute call volume and average response time for that statement.
Click Trace Query to view all related traces on the Traces tab.
Change the time range
The SQL Analysis tab displays data for a predefined time range. To change it:
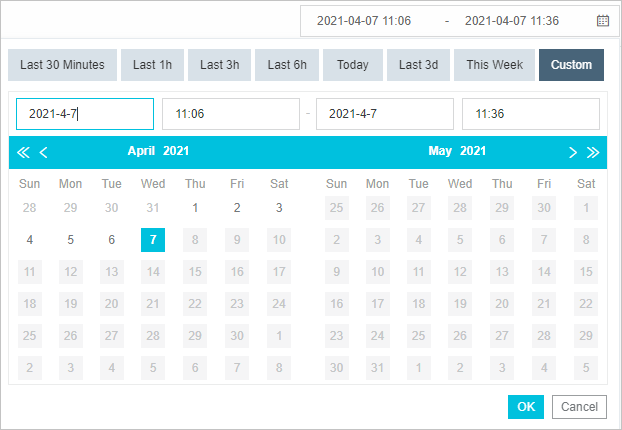
In the upper-right corner of the page, click the date and time picker.
Select a predefined range such as Last 30 Minutes, Today, or This Week.
To specify an exact range, select Custom. Select a start time and an end time in the calendar, or enter them manually, then click OK.
Note: Use the format YYYY-MM-DD for dates and HH:MM for times.