After you instrument your application by using SkyWalking and report trace data to Managed Service for OpenTelemetry, Managed Service for OpenTelemetry starts to monitor your application. You can view various monitoring data, such as application topology, traces, abnormal transactions, slow transactions, and SQL analysis. This topic describes how to use the SkyWalking Java Agent for automatic instrumentation and provides information about its configurable attributes.
Prerequisites
-
Open the SkyWalking download page and download SkyWalking 6.X.X or a later version (the latest stable version is recommended). Place the extracted agent folder in a directory accessible to the Java process.
-
All plugins are stored in the
/pluginsdirectory. To enable a new plugin, add it to this directory before startup. To disable a plugin, remove it from this directory. By default, log files are written to the/logsdirectory.
Log files, plugins, and configuration files are located in the agent folder. Do not change the directory structure.
New console
-
Log on to the Managed Service for OpenTelemetry console. In the left-side navigation pane, click Integration Center.
-
On the Integration Center page, click the SkyWalking card in the Open Source Frameworks section.
-
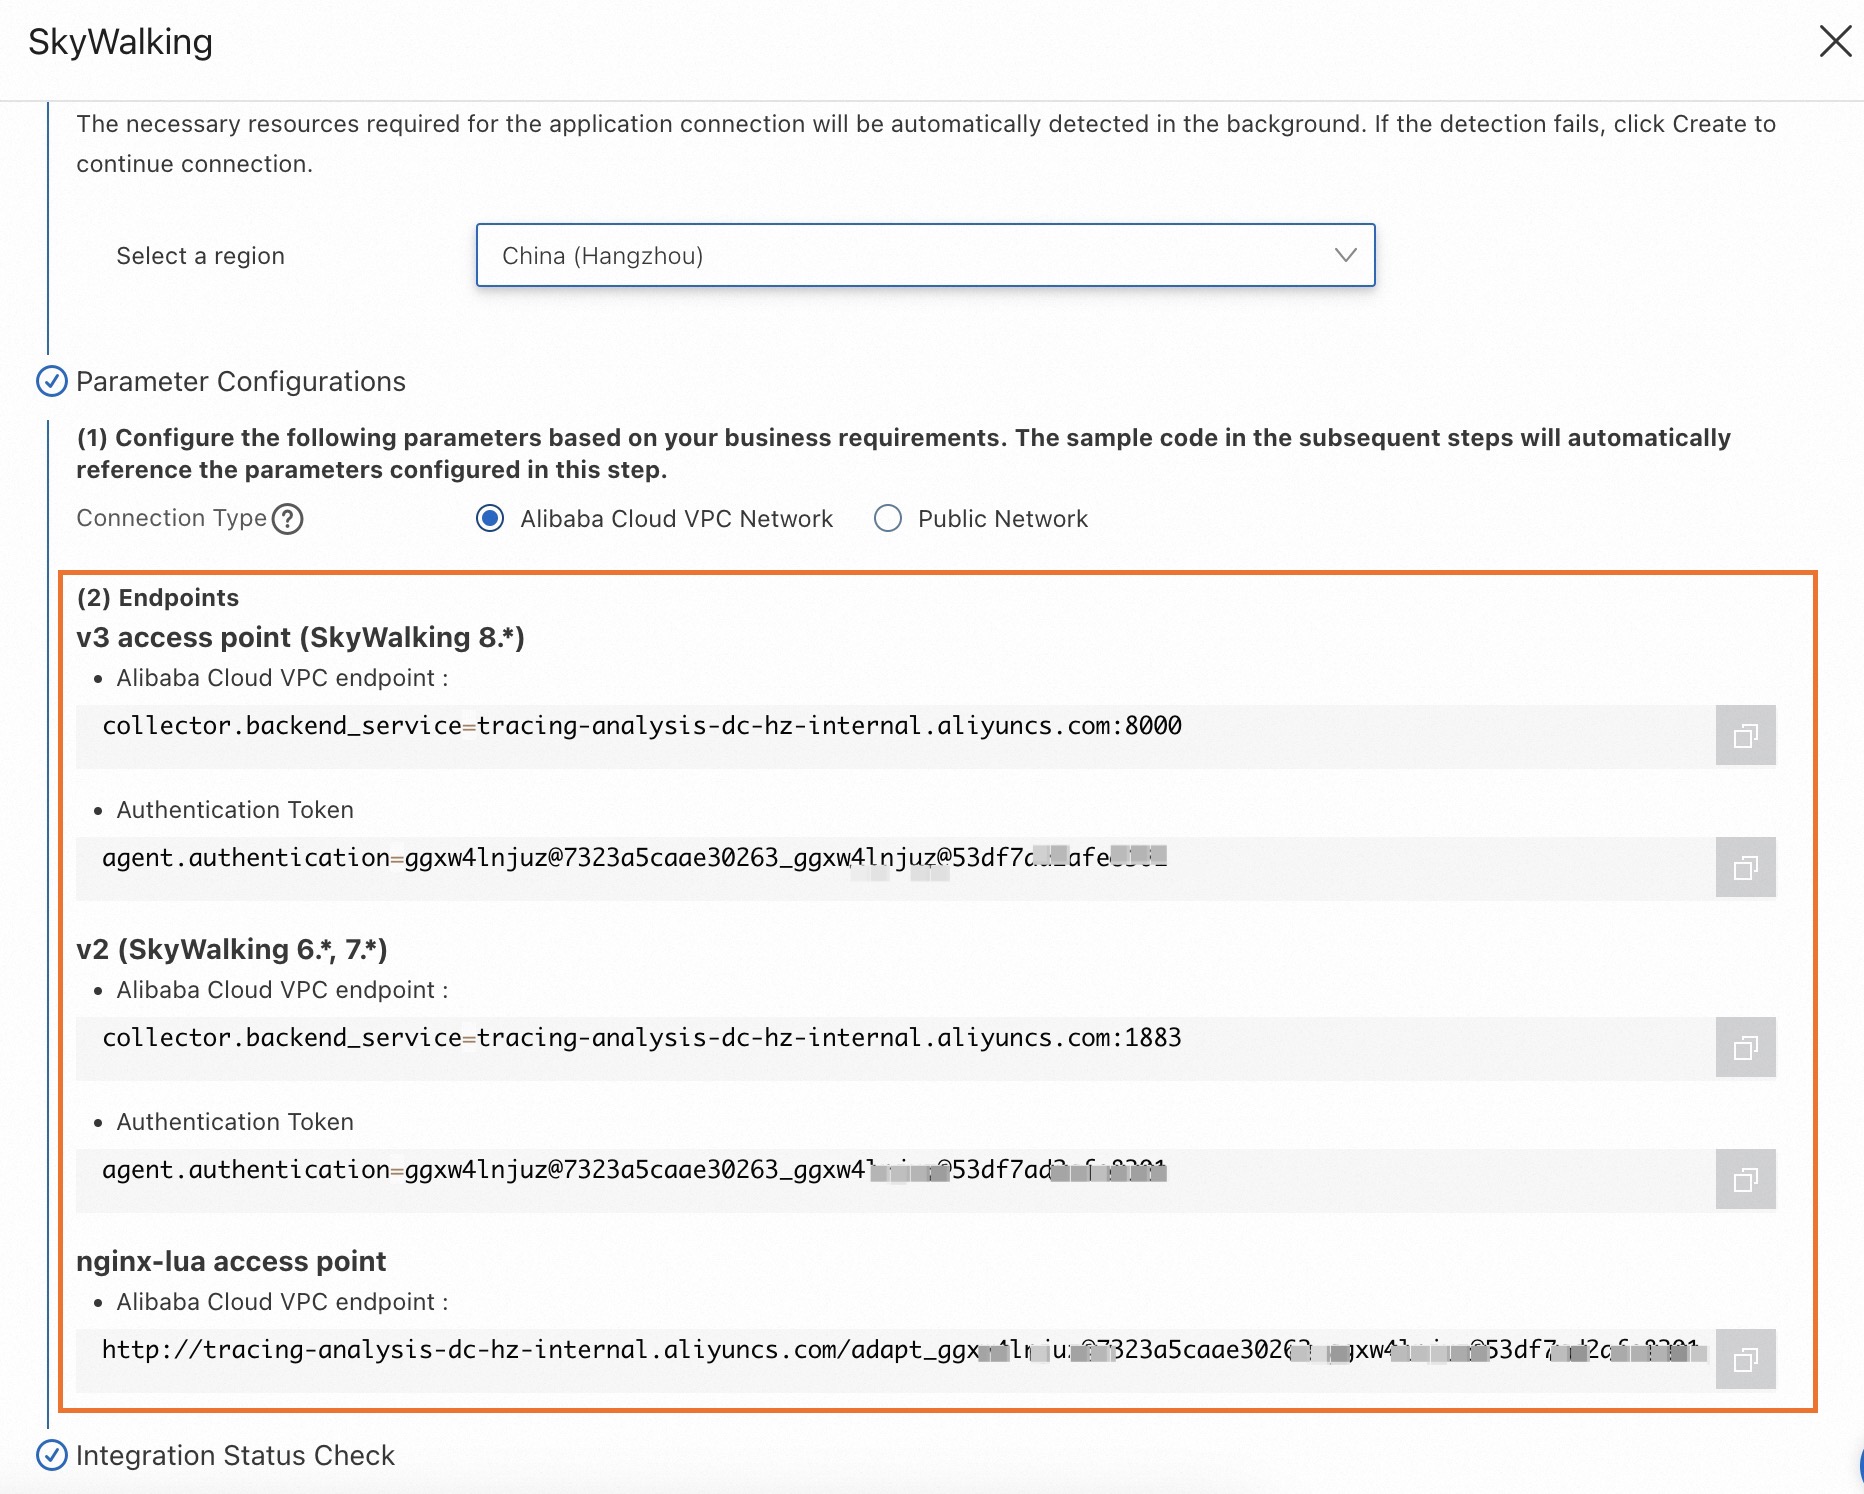
In the SkyWalking panel, click the Start Integration tab, and then select a region in which you want to report data.
NoteWhen you access a region for the first time, resources are automatically initialized there.
-
Configure the Connection Type parameter and copy an endpoint.
If your service is deployed on Alibaba Cloud and resides in the region that you selected, we recommend that you set this parameter to Alibaba Cloud VPC Network. Otherwise, set this parameter to Public Network.
Old console
-
Log on to the Managed Service for OpenTelemetry console.
-
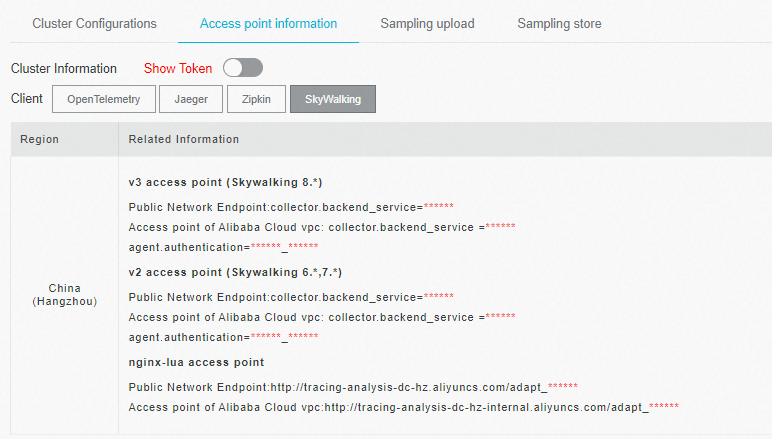
In the left-side navigation pane, click Cluster Configurations. On the page that appears, click the Access point information tab.
-
In the top navigation bar, select a region in which you want to report data. In the Cluster Information section, turn on Show Token.
-
Set the Client parameter to SkyWalking.
In the Related Information column of the table, copy an endpoint.
 Note
NoteIf your application is deployed in an Alibaba Cloud production environment, use a VPC endpoint. Otherwise, use a public endpoint.
Background
SkyWalking is a popular Application Performance Monitoring (APM) tool designed for applications built on microservice, Cloud Native, and containerized (Docker, Kubernetes, and Mesos) architectures. At its core, SkyWalking is a distributed tracing system.
To use SkyWalking to report data from your Java application to the Managed Service for OpenTelemetry console, you must first instrument the application. SkyWalking supports both auto-instrumentation for frameworks such as Dubbo, gRPC, JDBC, OkHttp, Spring, Tomcat, Struts, and Jedis, and manual instrumentation with OpenTracing. This topic describes the auto-instrumentation method.
Demo
Code repository: SkyWalking Demo
Instrument a Java application with SkyWalking
-
Download the SkyWalking Java Agent.
-
Configure the connection and service information in the SkyWalking Java Agent configuration file.
collector.backend_service=<endpoint> // Replace with the endpoint obtained from the prerequisites. agent.authentication=<token> // Replace with the authentication token obtained from the prerequisites. agent.service_name=<service-name> // Replace with your actual service name. -
Specify the path to the SkyWalking agent based on your application's runtime environment.
NoteIn the following examples, replace
<skywalking-agent-path>with the absolute path to skywalking-agent.jar in the agent folder.Linux Tomcat 7 / Tomcat 8
Add the following to the first line of
tomcat/bin/catalina.sh:CATALINA_OPTS="$CATALINA_OPTS -javaagent:<skywalking-agent-path>"; export CATALINA_OPTSWindows Tomcat 7 / Tomcat 8
Add the following to the first line of
tomcat/bin/catalina.bat:set "CATALINA_OPTS=-javaagent:<skywalking-agent-path>"JAR or Spring Boot
Add the -javaagent parameter to your application's startup command.
ImportantThe -javaagent parameter must appear before the -jar parameter.
java -javaagent:<skywalking-agent-path> -jar yourApp.jarJetty
Add the following lines to the
{JETTY_HOME}/start.iniconfiguration file:--exec -javaagent:<skywalking-agent-path> -
Restart your application.
Configurable Java agent attributes
The SkyWalking Java agent supports a wide range of user-configurable attributes. For a complete list of attributes, see the config/agent.config file in the sample demo.
Key attributes
The following attributes are based on apache-skywalking-java-agent-8.16.0.
Configuration methods
System properties
Use the -Dskywalking. prefix followed by the attribute name from the agent.config file. For example:
# Configure agent.service_name using a system property
java -javaagent:/path/to/skywalking-agent.jar -Dskywalking.agent.service_name=<your_service_name> -jar your-project.jar
Agent options
Append attributes to the agent path in the JVM arguments.
# Syntax
-javaagent:/path/to/skywalking-agent.jar=[key1]=[value1],[key2]=[value2]
# Example
java -javaagent:/path/to/skywalking-agent.jar=agent.service_name=<your-service-name>,agent.authentication=<your-token> -jar your-project.jar
Environment variables
The SkyWalking agent automatically reads environment variables. You can find the corresponding environment variable for each attribute in the config/agent.config file. For example, the environment variable for agent.service_name is SW_AGENT_NAME.
agent.service_name=${SW_AGENT_NAME:default_name}
# Set the environment variable
export SW_AGENT_NAME=<your_service_name>
Precedence
Configuration settings are applied with the following precedence, from highest to lowest: agent options, system properties, environment variables, and the configuration file.
Java agent plug-ins
The SkyWalking Java agent supports a variety of middleware, frameworks, and libraries. All supported plug-ins are available in the /plugins folder of the demo application.
Activate plug-ins
All plug-ins in the /plugins folder are active. To disable a plug-in, remove its JAR file from the /plugins folder.
Officially supported plug-ins
All officially supported plug-ins are located in the /plugins folder.
Optional plug-ins
Optional plug-ins reside in the optional-plugins folder of the agent package or in a third-party repository. To activate an optional plug-in, move its JAR file to the /plugins folder.
optional-plugins/
  apm-customize-enhance-plugin-8.16.0.jar
  apm-ehcache-2.x-plugin-8.16.0.jar
  apm-fastjson-1.x-plugin-8.16.0.jar
  apm-gson-2.x-plugin-8.16.0.jar
  apm-guava-cache-plugin-8.16.0.jar
  apm-jackson-2.x-plugin-8.16.0.jar
  apm-kotlin-coroutine-plugin-8.16.0.jar
  apm-mybatis-3.x-plugin-8.16.0.jar
  apm-quartz-scheduler-2.x-plugin-8.16.0.jar
  apm-resttemplate-6.x-plugin-8.16.0.jar
  apm-sentinel-1.x-plugin-8.16.0.jar
  apm-shenyu-2.4.x-plugin-8.16.0.jar
  apm-spring-annotation-plugin-8.16.0.jar
  apm-spring-cloud-gateway-2.0.x-plugin-8.16.0.jar
  apm-spring-cloud-gateway-2.1.x-plugin-8.16.0.jar
  apm-spring-cloud-gateway-3.x-plugin-8.16.0.jar
  apm-spring-tx-plugin-8.16.0.jar
  apm-spring-webflux-5.x-plugin-8.16.0.jar
  apm-springmvc-annotation-6.x-plugin-8.16.0.jar
  apm-trace-ignore-plugin-8.16.0.jar
  apm-zookeeper-3.4.x-plugin-8.16.0.jar
  trace-sampler-cpu-policy-plugin-8.16.0.jar
Bootstrap plug-ins
Due to potential stability risks, all bootstrap plug-ins are optional. They are located in the bootstrap-plugins folder. To activate a bootstrap plug-in, move its JAR file to the /plugins folder.
bootstrap-plugins/
  apm-jdk-forkjoinpool-plugin-8.16.0.jar
  apm-jdk-http-plugin-8.16.0.jar
  apm-jdk-threading-plugin-8.16.0.jar
  apm-jdk-threadpool-plugin-8.16.0.jar
Supported plug-ins
Some plug-ins are available only from a third-party repository due to potential performance impacts or usage limitations. For more information, see the SkyAPM Java Plugin Extension repository.
Plug-in development
To develop a custom SkyWalking Java agent plug-in, refer to the official documentation.
Managed Service for OpenTelemetry supports trace reporting. See the official documentation for details on developing a custom trace plug-in.
FAQ
Q: Why doesn't my application appear after the SkyWalking Agent connects to the server?
A: This issue occurs when distributed tracing data is not reported. To verify this, check the {skywalking agent path}/logs/skywalking-api.log file. If data is being reported, you will see a DEBUG log from the SkyWalking Agent like the one below. The key message, TraceSegmentServiceClient : 1 trace segments have been sent to collector., confirms that distributed tracing data was successfully sent to the collector.
DEBUG 2020-03-09 17:18:16:356 SkywalkingAgent-5-ServiceAndEndpointRegisterClient-0 ServiceAndEndpointRegisterClient : ServiceAndEndpointRegisterClient running, status:CONNECTED.
DEBUG 2020-03-09 17:18:19:357 SkywalkingAgent-5-ServiceAndEndpointRegisterClient-0 ServiceAndEndpointRegisterClient : ServiceAndEndpointRegisterClient running, status:CONNECTED.
DEBUG 2020-03-09 17:18:21:301 DataCarrier.DEFAULT.Consumer.0.Thread TraceSegmentServiceClient : 1 trace segments have been sent to collector.
DEBUG 2020-03-09 17:18:22:353 SkywalkingAgent-2-GRPCChannelManager-0 GRPCChannelManager : Selected collector grpc service running, reconnect:false.
DEBUG 2020-03-09 17:18:22:357 SkywalkingAgent-5-ServiceAndEndpointRegisterClient-0 ServiceAndEndpointRegisterClient : ServiceAndEndpointRegisterClient running, status:CONNECTED.
DEBUG 2020-03-09 17:18:25:356 SkywalkingAgent-5-ServiceAndEndpointRegisterClient-0 ServiceAndEndpointRegisterClient : ServiceAndEndpointRegisterClient running, status:CONNECTED.
If data reporting is not occurring, possible causes include enabled sampling, configured filters, or a lack of requests that generate distributed traces.