You can integrate services or components into Application Real-Time Monitoring Service (ARMS) by using the integration center or instance details pages. This topic describes how to integrate services or components. You can use the integration center or instance details pages based on your business requirements.
Integration center
As a unified access portal for ARMS, the integration center supports the integration and monitoring of more than 100 services or components, including Java applications, Managed Service for OpenTelemetry, Browser Monitoring, MySQL, Kafka, and various Alibaba Cloud services. By using the integration center, you can quickly preview available components and integrate components into ARMS based on your business requirements.
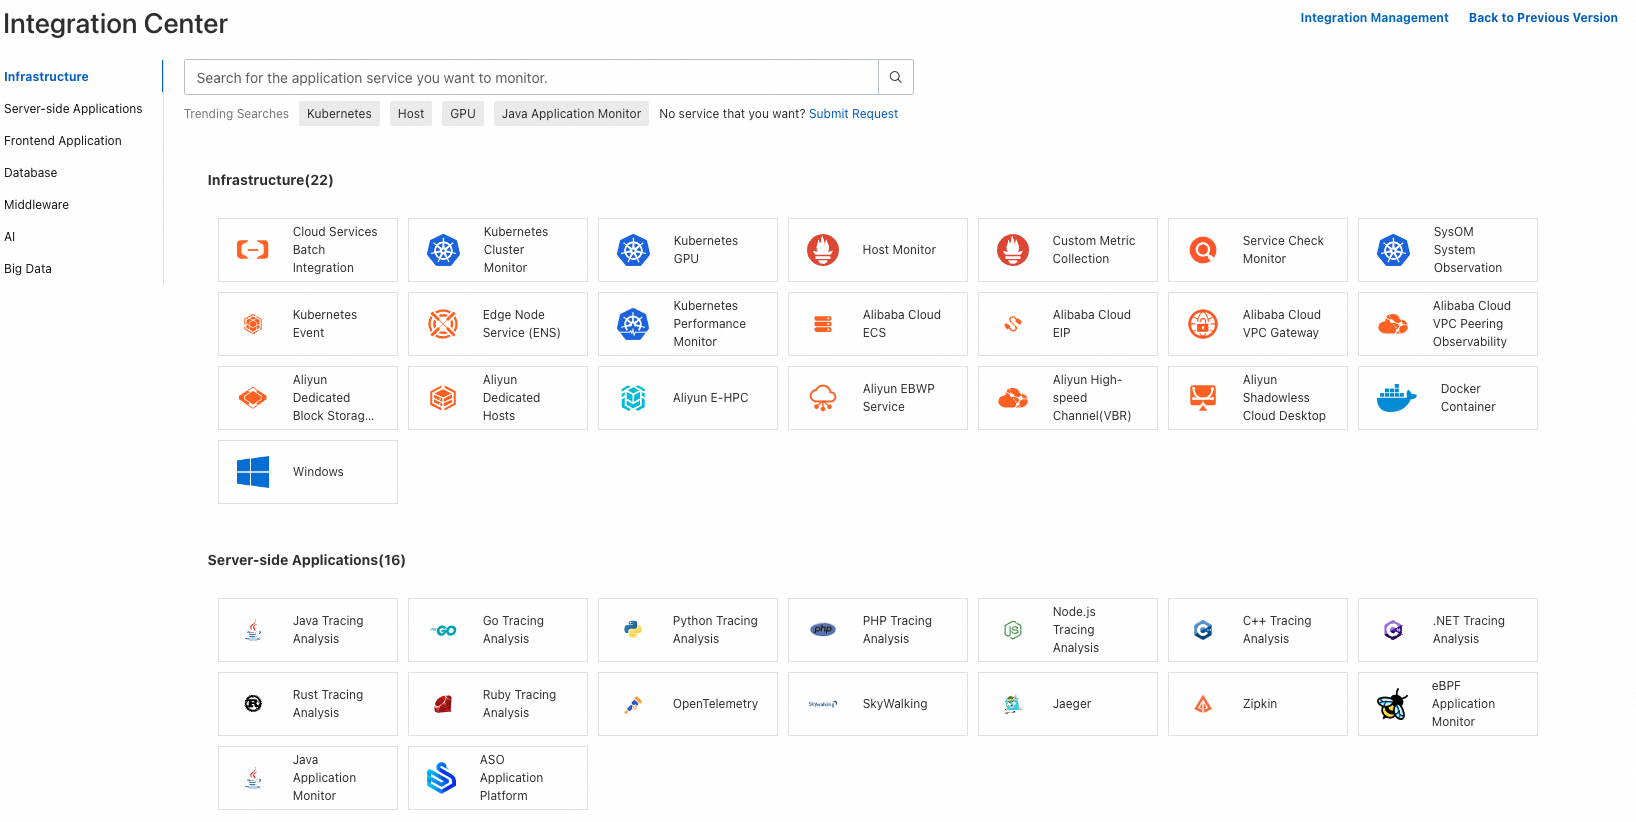
In this topic, the MySQL component is used to show how to integrate a service or component to ARMS and view metrics.
Integrate a self-managed MySQL instance
The operations required for integration vary with the environment.
ACK cluster
- Log on to the ARMS console.
In the left-side navigation pane, click Integration Center. In the Database section, click MySQL.
On the Start Integration tab in the panel that appears, select Container Service Environment as the environment type.
Select the Container Service for Kubernetes (ACK) cluster where the MySQL instance resides.
In the Configuration Information section, set the parameters and click OK.
Parameter
Description
Instance Endpoint
The endpoint of the MySQL instance.
Instance Port
The port number of the MySQL instance. Example: 3306.
Instance Account
The username and password of the MySQL instance.
ImportantWe recommend that you do not use an administrator account to avoid data breach risks. Create a MySQL account for mysqld_exporter and grant minimum permissions to the account. For more information, see Permissions required for mysqld_exporter to access a MySQL database.
Instance Password
After the MySQL component is installed, you can view all services and components that are integrated into ARMS on the Integration Management page.
On the Integration Management page, click a cluster name to view the basic information, integrated components, and metrics of the cluster. You can also explore metrics or configure the ARMS agent.
ECS instance
- Log on to the ARMS console.
In the left-side navigation pane, click Integration Center. In the Database section, click MySQL.
On the Start Integration tab in the panel that appears, select ECS (VPC) as the environment type.
Select the ECS instance where the MySQL instance resides.
In the Configuration Information section, set the parameters and click OK.
Parameter
Description
Instance Endpoint
The endpoint of the MySQL instance.
Instance Port
The port number of the MySQL instance. Example: 3306.
Instance Account
The username and password of the MySQL instance.
ImportantWe recommend that you do not use an administrator account to avoid data breach risks. Create a MySQL account for mysqld_exporter and grant minimum permissions to the account. For more information, see Permissions required for mysqld_exporter to access a MySQL database.
Instance Password
After the MySQL component is installed, you can view all services and components that are integrated into ARMS on the Integration Management page.
On the Integration Management page, click a cluster name to view the basic information, integrated components, and metrics of the cluster. You can also explore metrics or configure the ARMS agent.
Integrate an ApsaraDB RDS for MySQL instance
Method 1:
- Log on to the ARMS console.
In the left-side navigation pane, click Integration Center. In the Database section, click MySQL.
On the Start Integration tab in the panel that appears, select Cloud Services as the environment type.
Method 2:
- Log on to the ARMS console.
In the left-side navigation pane, click Integration Center. In the Database section, click ApsaraDB RDS.
Integrate an ApsaraDB RDS for MySQL instance:
Select the region where the ApsaraDB RDS for MySQL instance resides. ARMS will automatically install the instance.
After the MySQL component is installed, you can view all services and components that are integrated into ARMS on the Integration Management page.
On the Integration Management page, click a cluster name to view the basic information, integrated components, and metrics of the cluster. You can also explore metrics or configure the ARMS agent.
Preview the result
On the Integration Center page, you can preview all services and components, and view the collected metrics and alert rule templates.
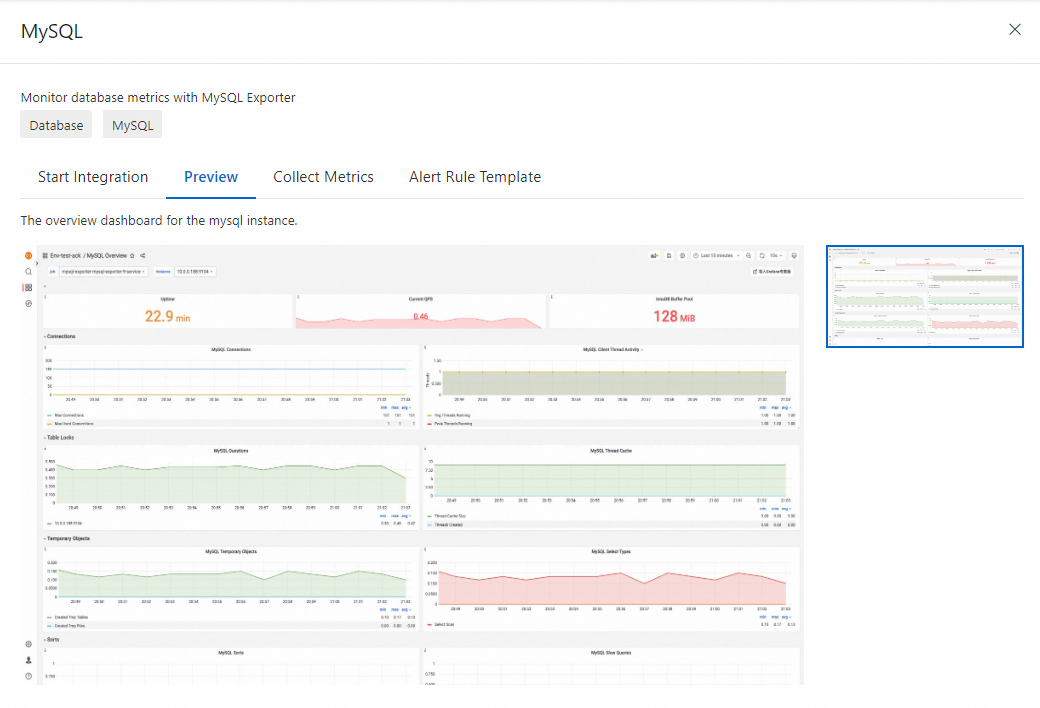
Preview
On the Integration Center page, click a service or component. In the panel that appears, click the Preview tab.
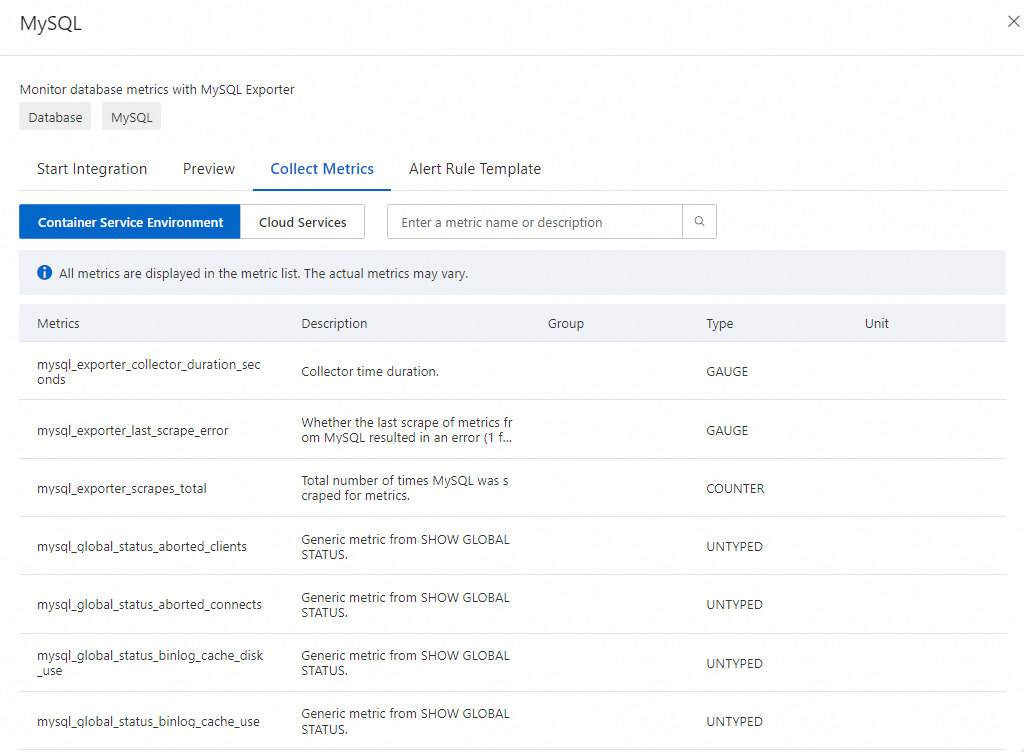
Collect Metrics
On the Integration Center page, click a service or component. In the panel that appears, click the Collect Metrics tab to view metrics of different environments.
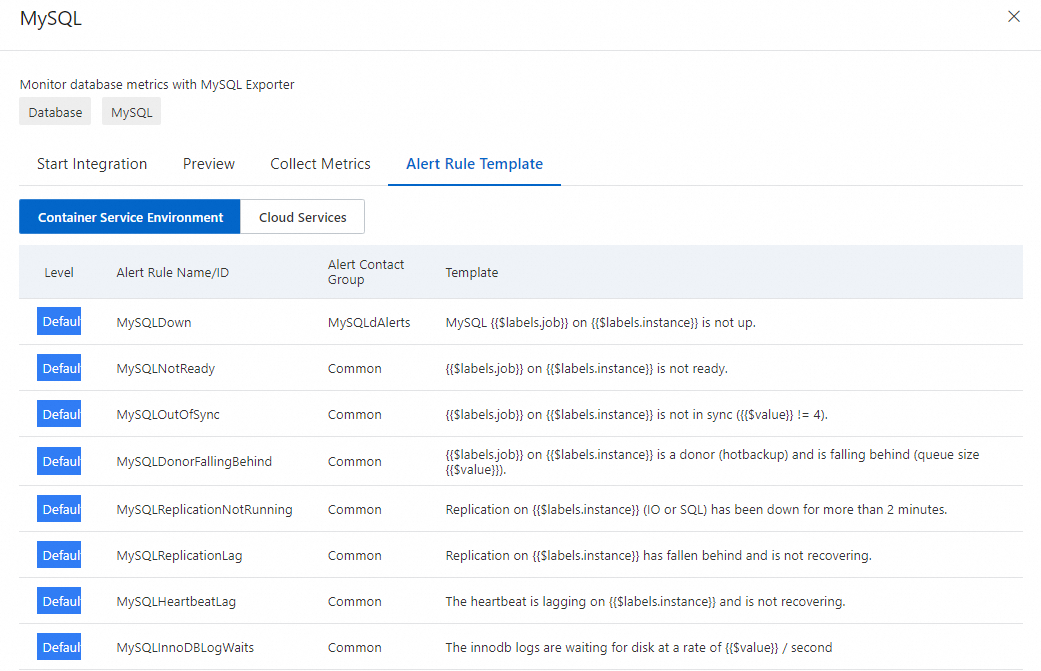
Alert Rule Template
On the Integration Center page, click a service or component. In the panel that appears, click the Alert Rule Template tab to view alert rule templates of different environments.
Use the console of each ARMS sub-service
In addition to the integration center of the ARMS console, you can also integrate services and components in the console of each ARMS sub-service.
Sub-service | Monitoring object | References |
Application Monitoring | Java application | |
Managed Service for OpenTelemetry | Java application | |
PHP application | Use OpenTelemetry to report the trace data of PHP applications | |
Go application | ||
Python application | ||
Node.js application | ||
.NET application | ||
C++ application | ||
Ruby application | Use OpenTelemetry to submit the trace data of Ruby applications | |
Swift application | Use OpenTelemetry to submit the trace data of Swift applications | |
Android application | Use OpenTelemetry to report the trace data of Android applications | |
Rust application | Use SkyWalking to submit the trace data of Rust applications | |
Browser Monitoring | Web & H5 | |
Weex | ||
Mini program | ||
Managed Service for Prometheus | ACK | |
Alibaba Cloud services:
| ||
ECS instance | ||
Self-managed Kubernetes cluster | ||
Custom metrics | ||
Application Security | Application protection | |
Synthetic Monitoring | Website | |
Application Monitoring eBPF Edition | Kubernetes cluster | |
Managed Service for Grafana | Alibaba Cloud data source | |
Third-party data source |
References
After you integrate a service or component to ARMS, you can create dashboards and alert rules for the metrics. For more information, see Best practices.