Distributed tracing helps you pinpoint latency bottlenecks and failures across microservices. By instrumenting your C++ application with the OpenTelemetry C++ SDK, you can export trace data to Managed Service for OpenTelemetry over HTTP or gRPC. Once connected, the ARMS console displays application topology, traces, abnormal and slow transactions, and SQL analysis for your application.
How it works
The OpenTelemetry C++ SDK uses three core components to collect and export trace data:
| Component | Role |
|---|---|
| TracerProvider | Creates and manages tracers. Each tracer produces spans that represent units of work. |
| SpanProcessor | Receives completed spans and forwards them to an exporter. SimpleSpanProcessor exports each span immediately and suits demos. For production, use BatchSpanProcessor for better throughput. |
| OTLP exporter | Sends spans to a backend over HTTP or gRPC. This guide uses Managed Service for OpenTelemetry as the backend. |
Prerequisites
Get the endpoint and authentication token
Log on to the Managed Service for OpenTelemetry console.
In the left-side navigation pane, click Cluster Configurations, then click the Access point information tab.
In the top navigation bar, select a region. In the Cluster Information section, turn on Show Token.
Set the Client parameter to OpenTelemetry.
In the Related Information column, copy the endpoint and token that match your network environment: For gRPC, also copy the authentication token displayed in the same row.
Deployment Endpoint to use On Alibaba Cloud (ECS, ACK, or other Alibaba Cloud services) VPC endpoint Outside Alibaba Cloud or local development Public endpoint 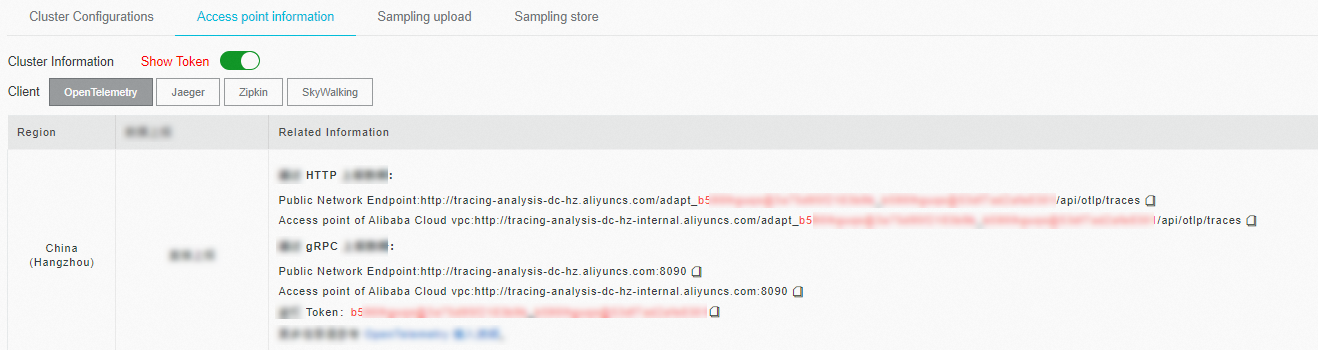
Environment requirements
C++ 11 or later
For supported C++ compiler versions and platforms, see opentelemetry-cpp supported versions
Sample code
The complete sample code is available at alibabacloud-observability/cpp-demo.
Prepare the environment
(Optional) Start a Docker container with the GCC toolchain:
   docker pull gcc                               # Debian-based image
   docker run -it --name otel-cpp-demo gcc bash
Install system dependencies (protobuf, gRPC, and build tools):
   apt-get update
   apt-get install sudo

   sudo apt-get install git cmake g++ libcurl4-openssl-dev
   # protobuf
   sudo apt-get install protobuf-compiler libprotobuf-dev
   # gRPC
   sudo apt-get install -y libgrpc++-dev libgrpc-dev protobuf-compiler-grpc
Build and install the OpenTelemetry C++ SDK
Clone the repository, build with OTLP exporter support, and install to /usr/local:
git clone --recurse-submodules https://github.com/open-telemetry/opentelemetry-cpp

cd opentelemetry-cpp
mkdir build && cd build
cmake -DBUILD_TESTING=OFF -DWITH_OTLP_GRPC=ON -DWITH_OTLP_HTTP=ON ..

cmake --build . --target all

# Install to /usr/local (recommended default path)
cmake --install .

# To install to a custom path instead, uncomment the following line:
# cmake --install . --prefix /opentelemetry-cpp-lib
Report trace data
Choose a transport protocol. Both HTTP and gRPC export spans to Managed Service for OpenTelemetry. Use the matching endpoint from the Prerequisites section.
| Protocol | When to use | Authentication |
|---|---|---|
| HTTP | Simpler setup, works through most proxies and firewalls | Endpoint URL contains embedded credentials |
| gRPC | Lower overhead for high-volume trace data | Requires a separate authentication token |
Report data over HTTP
Create a project directory:
   mkdir otel-http-export-demo
   cd otel-http-export-demo
Create a
CMakeLists.txtfile:cmake_minimum_required(VERSION 3.25.1) project(otel-http-export-demo) add_executable(otel-http-export-demo http_exporter.cc) find_package(opentelemetry-cpp CONFIG REQUIRED) find_package(protobuf) find_package(gRPC) find_package(CURL) find_package(nlohmann_json) include_directories("${OPENTELEMETRY_CPP_INCLUDE_DIRS}") target_link_libraries( otel-http-export-demo opentelemetry_trace opentelemetry_common opentelemetry_http_client_curl opentelemetry_exporter_otlp_http opentelemetry_exporter_otlp_grpc opentelemetry_exporter_otlp_http_client opentelemetry_otlp_recordable opentelemetry_resources )Create an
http_exporter.ccfile. Replace the following placeholders with your actual values:Placeholder Description Example <your-service-name>A name that identifies your application in the ARMS console my-cpp-service<your-host-name>The hostname of the machine running the application prod-server-01// Copyright The OpenTelemetry Authors // SPDX-License-Identifier: Apache-2.0 #include "opentelemetry/exporters/otlp/otlp_http_exporter_factory.h" #include "opentelemetry/exporters/otlp/otlp_http_exporter_options.h" #include "opentelemetry/context/propagation/global_propagator.h" #include "opentelemetry/context/propagation/text_map_propagator.h" #include "opentelemetry/exporters/ostream/span_exporter_factory.h" #include "opentelemetry/nostd/shared_ptr.h" #include "opentelemetry/sdk/trace/simple_processor_factory.h" #include "opentelemetry/sdk/trace/tracer_context.h" #include "opentelemetry/sdk/trace/tracer_context_factory.h" #include "opentelemetry/sdk/trace/tracer_provider_factory.h" #include "opentelemetry/trace/propagation/http_trace_context.h" #include "opentelemetry/trace/provider.h" #include "opentelemetry/ext/http/client/http_client_factory.h" #include "opentelemetry/sdk/resource/semantic_conventions.h" #include "opentelemetry/sdk/common/global_log_handler.h" #include <string> namespace trace = opentelemetry::trace; namespace trace_sdk = opentelemetry::sdk::trace; namespace otlp = opentelemetry::exporter::otlp; namespace internal_log = opentelemetry::sdk::common::internal_log; namespace resource = opentelemetry::sdk::resource; namespace nostd = opentelemetry::nostd; namespace { opentelemetry::exporter::otlp::OtlpHttpExporterOptions opts; void InitTracer() { // Create an OTLP/HTTP exporter that sends spans to the configured endpoint. auto exporter = otlp::OtlpHttpExporterFactory::Create(opts); // SimpleSpanProcessor exports each span immediately. For production, // consider BatchSpanProcessor to reduce network overhead. auto processor = trace_sdk::SimpleSpanProcessorFactory::Create(std::move(exporter)); // Set resource attributes so ARMS can identify this application. resource::ResourceAttributes attributes = { {resource::SemanticConventions::kServiceName, "<your-service-name>"}, {resource::SemanticConventions::kHostName, "<your-host-name>"} }; auto resource = opentelemetry::sdk::resource::Resource::Create(attributes); std::shared_ptr<opentelemetry::trace::TracerProvider> provider = trace_sdk::TracerProviderFactory::Create(std::move(processor), std::move(resource)); // Register as the global tracer provider. trace::Provider::SetTracerProvider(provider); } void CleanupTracer() { std::shared_ptr<opentelemetry::trace::TracerProvider> none; trace::Provider::SetTracerProvider(none); } nostd::shared_ptr<trace::Tracer> get_tracer() { auto provider = trace::Provider::GetTracerProvider(); return provider->GetTracer("library name to trace", OPENTELEMETRY_SDK_VERSION); } void f1() { auto scoped_span = trace::Scope(get_tracer()->StartSpan("f1")); } void f2() { auto scoped_span = trace::Scope(get_tracer()->StartSpan("f2")); f1(); f1(); } void foo_library() { auto scoped_span = trace::Scope(get_tracer()->StartSpan("library")); f2(); } } // namespace /* Usage: - example_otlp_http - example_otlp_http <URL> - example_otlp_http <URL> <DEBUG> - example_otlp_http <URL> <DEBUG> <BIN> <DEBUG> = yes|no, to turn console debug on or off <BIN> = bin, to export in binary format */ int main(int argc, char *argv[]) { if (argc > 1) { opts.url = argv[1]; if (argc > 2) { std::string debug = argv[2]; opts.console_debug = debug != "" && debug != "0" && debug != "no"; } if (argc > 3) { std::string binary_mode = argv[3]; if (binary_mode.size() >= 3 && binary_mode.substr(0, 3) == "bin") { opts.content_type = otlp::HttpRequestContentType::kBinary; } } } if (opts.console_debug) { internal_log::GlobalLogHandler::SetLogLevel(internal_log::LogLevel::Debug); } InitTracer(); foo_library(); CleanupTracer(); }Build the project:
mkdir build && cd build && cmake .. && makeRun the demo. Pass the HTTP endpoint from the Prerequisites section as the first argument: Example: To enable debug logging and confirm that spans are exported, pass
yesas the second argument: If the program exits without errors, the spans were exported. Proceed to Verify trace data to confirm they appear in the console../otel-http-export-demo <http-endpoint>./otel-http-export-demo http://tracing-analysis-dc-hz.aliyuncs.com/adapt_xxxxx_xxxxx/api/otlp/traces./otel-http-export-demo <http-endpoint> yes
Report data over gRPC
Create a project directory:
   mkdir otel-grpc-export-demo
   cd otel-grpc-export-demo
Create a
CMakeLists.txtfile:cmake_minimum_required(VERSION 3.25.1) project(otel-grpc-export-demo) add_executable(otel-grpc-export-demo grpc_exporter.cc) find_package(opentelemetry-cpp CONFIG REQUIRED) find_package(protobuf) find_package(gRPC) find_package(CURL) find_package(nlohmann_json) include_directories("${OPENTELEMETRY_CPP_INCLUDE_DIRS}") target_link_libraries( otel-grpc-export-demo ${OPENTELEMETRY_CPP_LIBRARIES} opentelemetry_trace opentelemetry_common opentelemetry_http_client_curl opentelemetry_exporter_otlp_http opentelemetry_exporter_otlp_grpc opentelemetry_exporter_otlp_http_client opentelemetry_otlp_recordable opentelemetry_resources )Create a
grpc_exporter.ccfile. Replace the following placeholders with your actual values:Placeholder Description Example <your-service-name>A name that identifies your application in the ARMS console my-cpp-service<your-host-name>The hostname of the machine running the application prod-server-01// Copyright The OpenTelemetry Authors // SPDX-License-Identifier: Apache-2.0 #include "opentelemetry/exporters/otlp/otlp_grpc_exporter_factory.h" #include "opentelemetry/exporters/otlp/otlp_grpc_exporter_options.h" #include "opentelemetry/context/propagation/global_propagator.h" #include "opentelemetry/context/propagation/text_map_propagator.h" #include "opentelemetry/exporters/ostream/span_exporter_factory.h" #include "opentelemetry/nostd/shared_ptr.h" #include "opentelemetry/sdk/trace/simple_processor_factory.h" #include "opentelemetry/sdk/trace/tracer_context.h" #include "opentelemetry/sdk/trace/tracer_context_factory.h" #include "opentelemetry/sdk/trace/tracer_provider_factory.h" #include "opentelemetry/trace/propagation/http_trace_context.h" #include "opentelemetry/trace/provider.h" #include "opentelemetry/ext/http/client/http_client_factory.h" #include "opentelemetry/sdk/resource/semantic_conventions.h" #include "opentelemetry/sdk/common/global_log_handler.h" #include <string> namespace trace = opentelemetry::trace; namespace trace_sdk = opentelemetry::sdk::trace; namespace otlp = opentelemetry::exporter::otlp; namespace internal_log = opentelemetry::sdk::common::internal_log; namespace resource = opentelemetry::sdk::resource; namespace nostd = opentelemetry::nostd; namespace { opentelemetry::exporter::otlp::OtlpGrpcExporterOptions opts; void InitTracer() { // Create an OTLP/gRPC exporter that sends spans to the configured endpoint. auto exporter = otlp::OtlpGrpcExporterFactory::Create(opts); // SimpleSpanProcessor exports each span immediately. For production, // consider BatchSpanProcessor to reduce network overhead. auto processor = trace_sdk::SimpleSpanProcessorFactory::Create(std::move(exporter)); // Set resource attributes so ARMS can identify this application. resource::ResourceAttributes attributes = { {resource::SemanticConventions::kServiceName, "<your-service-name>"}, {resource::SemanticConventions::kHostName, "<your-host-name>"} }; auto resource = opentelemetry::sdk::resource::Resource::Create(attributes); std::shared_ptr<opentelemetry::trace::TracerProvider> provider = trace_sdk::TracerProviderFactory::Create(std::move(processor), std::move(resource)); // Register as the global tracer provider. trace::Provider::SetTracerProvider(provider); } void CleanupTracer() { std::shared_ptr<opentelemetry::trace::TracerProvider> none; trace::Provider::SetTracerProvider(none); } nostd::shared_ptr<trace::Tracer> get_tracer() { auto provider = trace::Provider::GetTracerProvider(); return provider->GetTracer("library name to trace", OPENTELEMETRY_SDK_VERSION); } void f1() { auto scoped_span = trace::Scope(get_tracer()->StartSpan("f1")); } void f2() { auto scoped_span = trace::Scope(get_tracer()->StartSpan("f2")); f1(); f1(); } void foo_library() { auto scoped_span = trace::Scope(get_tracer()->StartSpan("library")); f2(); } } // namespace /* Usage: - example_otlp_grpc - example_otlp_grpc <URL> <TOKEN> */ int main(int argc, char *argv[]) { if (argc > 1) { opts.endpoint = argv[1]; if (argc > 2) { opts.metadata.insert(std::pair<std::string, std::string>("authentication",argv[2])); } if (argc > 3) { opts.use_ssl_credentials = true; opts.ssl_credentials_cacert_path = argv[3]; } } InitTracer(); foo_library(); CleanupTracer(); }Build the project:
mkdir build && cd build && cmake .. && makeRun the demo. Pass the gRPC endpoint and authentication token from the Prerequisites section: Example: If the program exits without errors, the spans were exported. Proceed to Verify trace data to confirm they appear in the console.
./otel-grpc-export-demo <gRPC-endpoint> <token>./otel-grpc-export-demo http://tracing-analysis-dc-hz.aliyuncs.com:8090 xxxxx_xxxxxx
Troubleshooting
Shared library not found
If you see the following error when running the demo:
./otel-grpc-export-demo: error while loading shared libraries: libopentelemetry_proto_grpc.so: cannot open shared object file: No such file or directoryAdd the OpenTelemetry C++ SDK installation path to the library search path:
export LD_LIBRARY_PATH=$LD_LIBRARY_PATH:/usr/local/lib//usr/local/lib is the default installation path. If you installed the SDK to a custom path, replace it accordingly.
Verify trace data
Log on to the ARMS console.
In the left-side navigation pane, choose Application Monitoring > Applications.
Find your application name in the list and click it to view trace data, including topology, individual traces, and performance metrics.
The Language column icon indicates the data source. Theicon means the application is connected to Application Monitoring. A hyphen (-) means it is connected to Managed Service for OpenTelemetry.
Production recommendations
The demo code in this guide uses SimpleSpanProcessor, which exports each span synchronously and blocks the calling thread. For production workloads:
Switch to
BatchSpanProcessorto buffer and export spans in batches, reducing network overhead and latency impact on your application.Set resource attributes (
service.name,host.name,service.version) to meaningful values so you can filter and group traces in the ARMS console.For the gRPC exporter, consider enabling SSL (
opts.use_ssl_credentials = true) when sending trace data over the public internet.