After you use Jaeger to instrument a Python application and report the trace data to Managed Service for OpenTelemetry, Managed Service for OpenTelemetry starts to monitor the Python application. You can view the monitoring data of the application such as application topology, traces, abnormal transactions, slow transactions, and SQL analysis. This topic describes how to use Jaeger to instrument a Python application and report trace data.
We recommend that you connect your application to Managed Service for OpenTelemetry by using OpenTelemetry Protocol (OTLP). In this case, you are provided with more features, more advanced tracing capabilities, and the best user experience.
Alibaba Cloud provides detailed instructions on how to integrate OpenTelemetry with an application and the best practices of using OpenTelemetry to help you quickly get started with Managed Service for OpenTelemetry. For more information, see Preparations.
Background Information
The following figure shows how to report data without using the Jaeger agent.

The following figure shows how to report data by using the Jaeger agent.

Usage notes
For Python, Jaeger v1.25 allows you to report trace data only by using the Jaeger agent. You cannot report trace data over HTTP. For more information, see Client Library Features in official Jaeger documentation.
For Python, Jaeger v1.25 allows you to report trace data from the Jaeger client to the Jaeger agent only over UDP. The UDP protocol does not guarantee the reliability of communication. To ensure reliable transfer of trace data, we recommend that you run the Jaeger client and Jaeger agent on the same host.
Step 1: Build environments
In this example, the following versions for Docker, the Jaeger agent, the Jaeger client, and Python are required to build environments.
Docker and the Jaeger agent
Docker version: 20.10.7
Jaeger agent version: 1.25
Run the following command in Docker Hub to pull the image of the Jaeger agent v1.25:
docker pull jaegertracing/jaeger-agent:1.25Run the following command to run the Jaeger agent v1.25:
docker run -d --name jaeger-agent -p 5775:5775/udp -p 6831:6831/udp -p 6832:6832/udp -p 5778:5778/tcp jaegertracing/jaeger-agent:1.25 --reporter.type=grpc --reporter.grpc.host-port=<endpoint>(Enter the endpoint) --agent.tags=<auth>(Enter the authentication information)NoteReplace
<endpoint>and<auth>with the endpoint and authentication information displayed on the Cluster Configurations page of the Managed Service for OpenTelemetry console. For more information about how to obtain the endpoint, see the "Prerequisites" section of this topic.
Python and the Jaeger client
Python version: 3.8.5
Jaeger client version: 4.6.0
Install the following Python package in Python to configure the Jaeger client environment:
certifi==2021.5.30
charset-normalizer==2.0.4
idna==3.2
jaeger-client==4.6.0
opentracing==2.4.0
requests==2.26.0
six==1.16.0
threadloop==1.0.2
thrift==0.13.0
tornado==6.1
urllib3==1.26.6
Step 2: Create a Tracer object
Create a Python file that contains the following content.
Run the following code to create a Tracer object and use the Tracer object to create a span to report data to the Managed Service for OpenTelemetry backend:
import logging
import time
from jaeger_client import Config


def construct_span(tracer):
    with tracer.start_span('AliyunTestSpan') as span:
        span.log_kv({'event': 'test message', 'life': 42})
        print("tracer.tages: ", tracer.tags)
        with tracer.start_span('AliyunTestChildSpan', child_of=span) as child_span:
            span.log_kv({'event': 'down below'})
        return span


if __name__ == "__main__":
    log_level = logging.DEBUG
    logging.getLogger('').handlers = []
    logging.basicConfig(format='%(asctime)s %(message)s', level=log_level)

    config = Config(
        config={ # usually read from some yaml config
            'sampler': {
                'type': 'const',
                'param': 1,
            },
            'local_agent': {
                # Specify the hostname and port number of the Jaeger agent.
                # To ensure data reliability, we recommend that you run the Jaeger client and the Jaeger agent on the same host. Therefore, the reporting_host parameter is set to 127.0.0.1.
                'reporting_host': '127.0.0.1',
                'reporting_port': 6831,
            },
            'logging': True,
        },
        # Specify the application name.
        service_name="mytest3",
        validate=True
    )

    # this call also sets opentracing.tracer
    tracer = config.initialize_tracer()

    span = construct_span(tracer)

    time.sleep(2)   # yield to IOLoop to flush the spans - https://github.com/jaegertracing/jaeger-client-python/issues/50
    tracer.close()  # flush any buffered spans
Execute the Python file.
View data in the Managed Service for OpenTelemetry console
Log on to the ARMS console. In the left-side navigation pane, choose .
On the Applications page, select a region in the top navigation bar and click the name of the application.
NoteIf the
 icon is displayed in the Language column, the application is connected to Application Monitoring. If a hyphen (-) is displayed, the application is connected to Managed Service for OpenTelemetry.
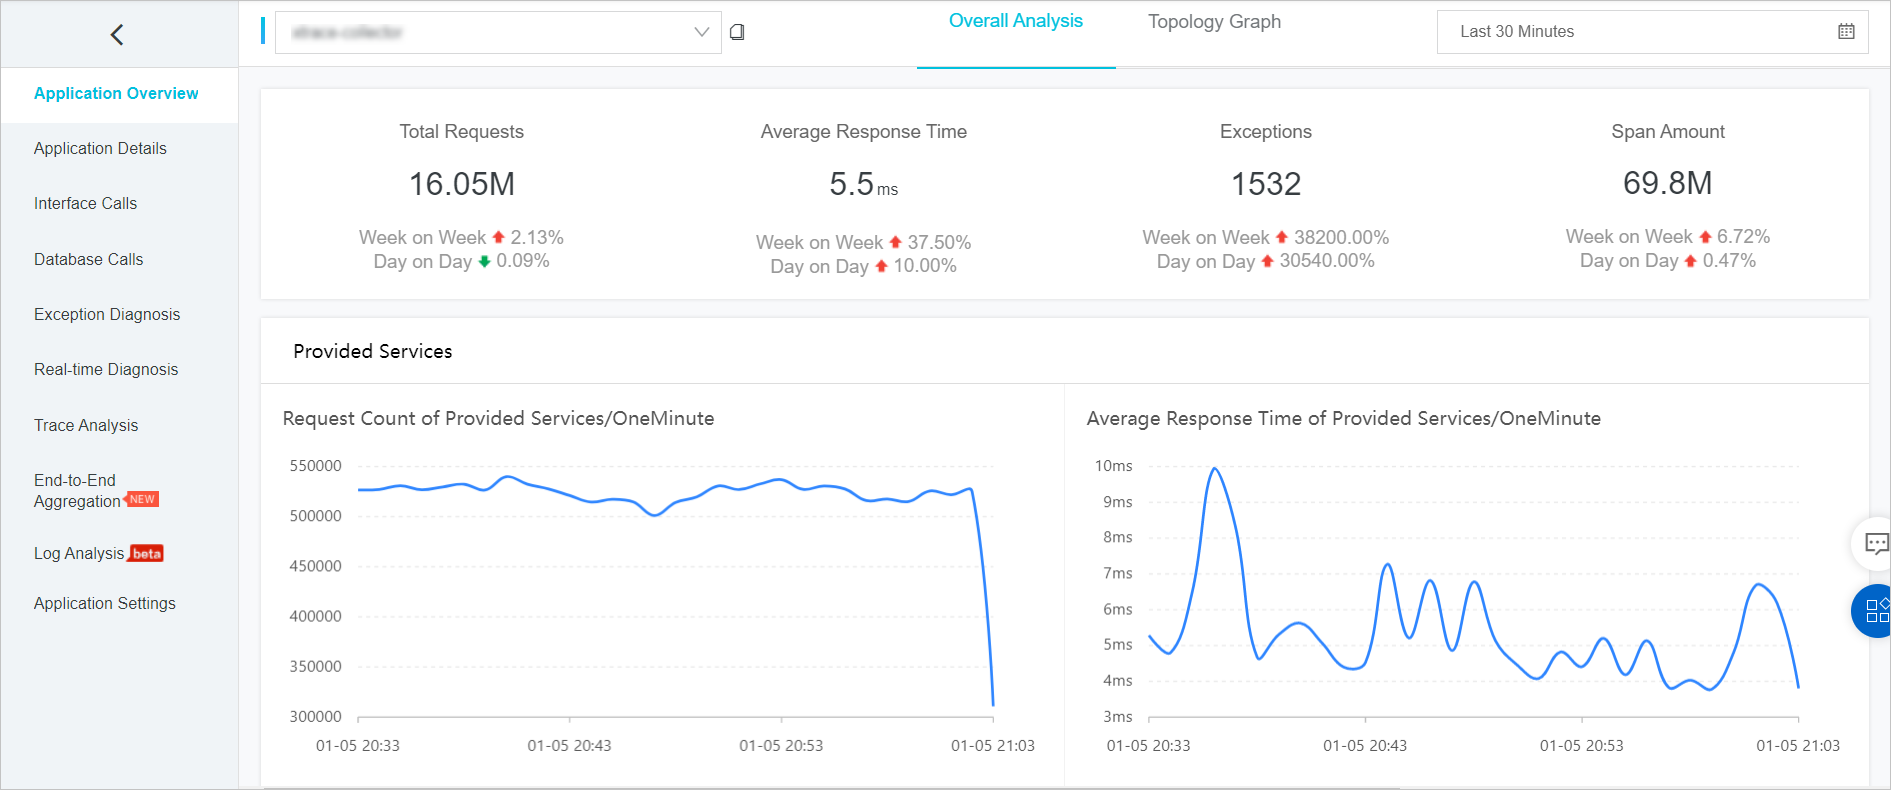
 In the Application Overview section, you can view the key performance metrics and topology of the application.
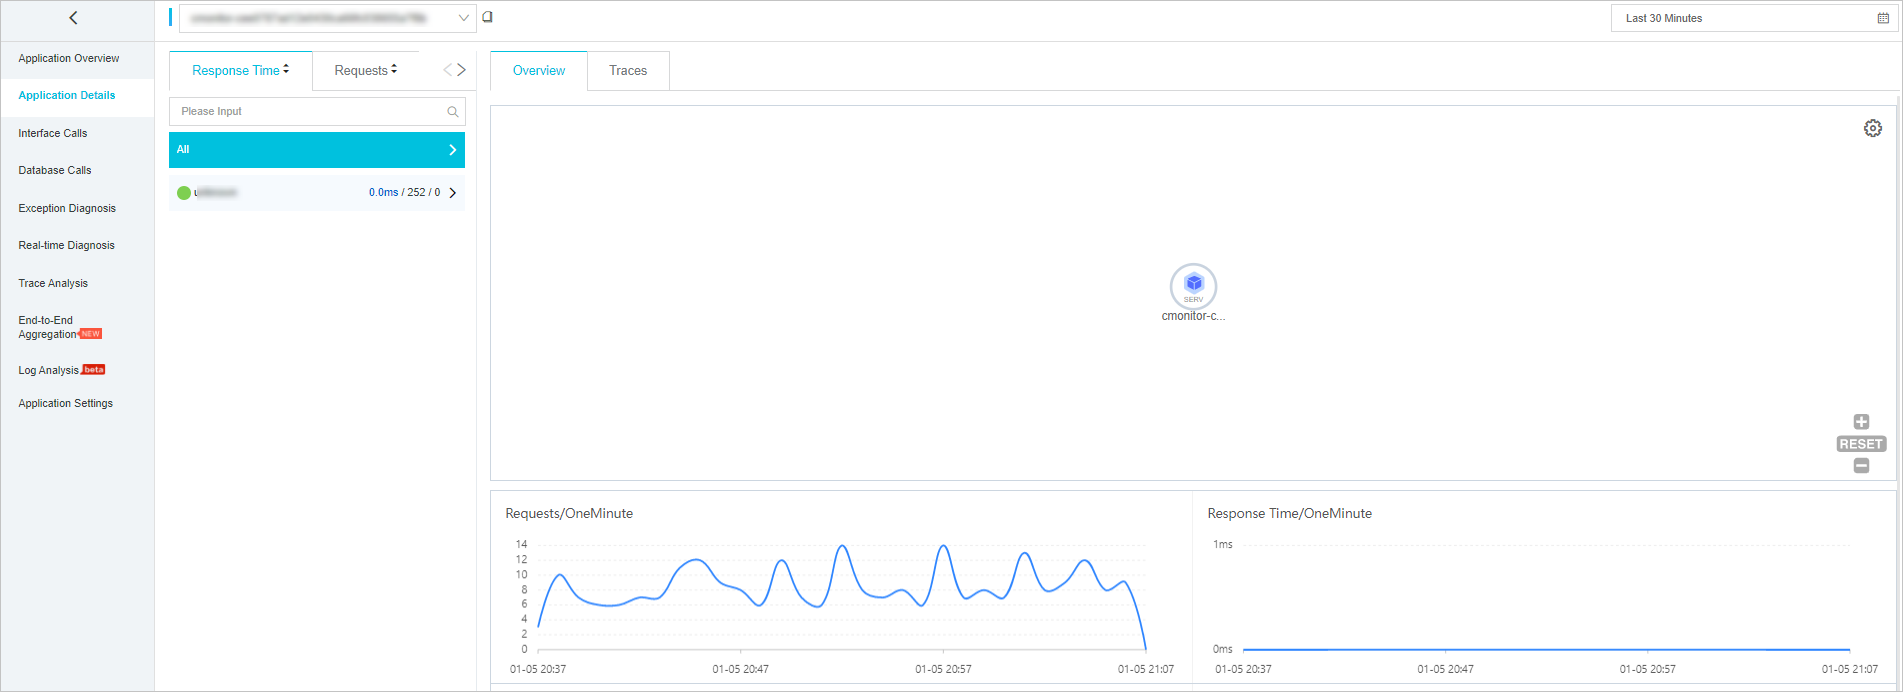
In the left-side navigation pane, click Application Details.
On the Overview tab of the Application Details section, you can view the application overview.
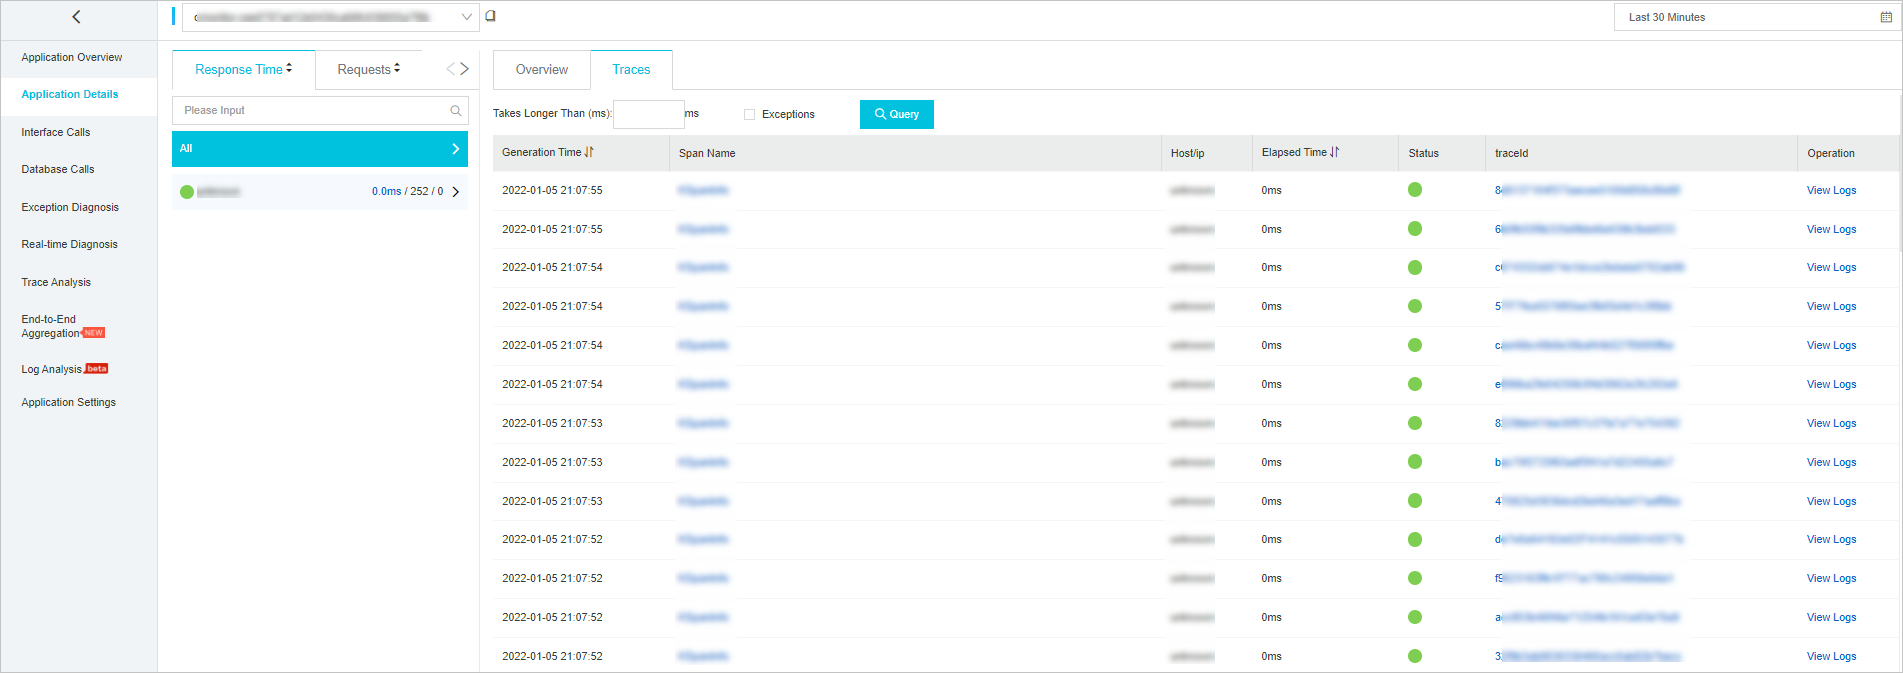
In the Application Details section, click the Traces tab.
On the Traces tab, you can view the traces of the application.
Use Jaeger
This section provides common methods for using Jaeger. For more information, see Getting Started in official Jaeger documentation.
Create a Tracer object:
from jaeger_client import Config

def init_jaeger_tracer(service_name='your-app-name'):
    config = Config(config={}, service_name=service_name)
    return config.initialize_tracer()
Create and finish a span:
# Start a span that does not have a parent span.
tracer.start_span('TestSpan')
# Start a span that has a parent span.
tracer.start_span('ChildSpan', child_of=span)
# Finish the span.
 span.finish()
Pass a SpanContext:
# Serialization: Inject a SpanContext and pass it to the next span.
tracer.inject(
        span_context=span.context, format=Format.TEXT_MAP, carrier=carrier
    )
# Deserialization: Extract a SpanContext that is passed.
span_ctx = tracer.extract(format=Format.TEXT_MAP, carrier={})