When you run a Node.js application, you need visibility into request latency, error rates, and service dependencies to diagnose performance issues. Managed Service for OpenTelemetry (Tracing Analysis) collects and visualizes distributed traces from your application, helping you pinpoint bottlenecks across microservices.
This topic walks you through instrumenting a Node.js application with the Jaeger client library to report trace data to Tracing Analysis.
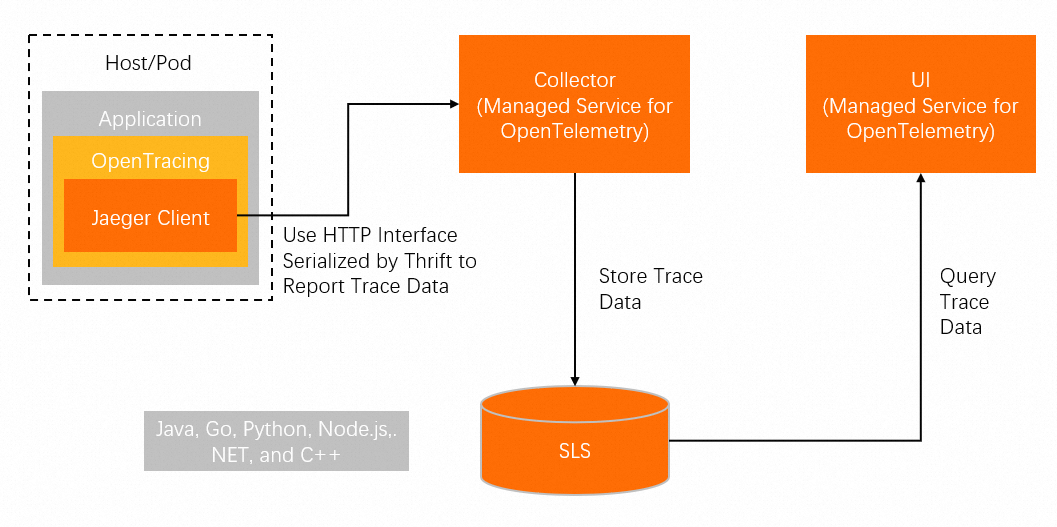
Trace data reaches the Tracing Analysis backend through one of two paths:
Direct reporting -- The application sends spans over HTTP to a collector endpoint. No additional infrastructure is required.
Agent-based reporting -- The application sends spans to a local Jaeger agent over UDP, which forwards them to the collector. Use this path when you need UDP transport or local span buffering.
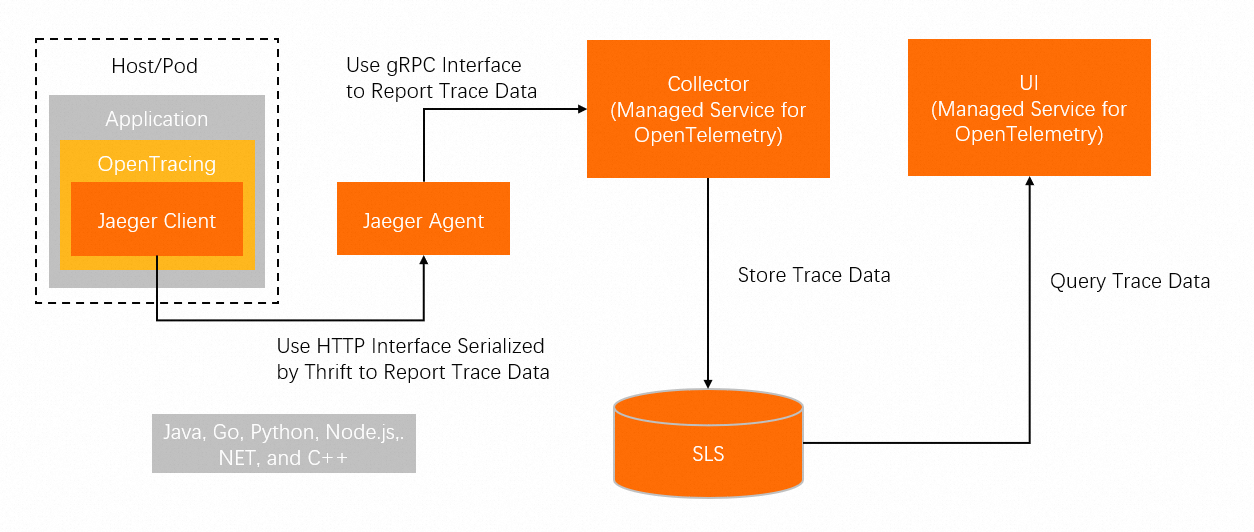
The steps below use direct reporting (the more common approach). For agent-based reporting, see the jaeger-client-node documentation.
Prerequisites
Before you begin, make sure that you have:
Node.js installed on your machine
The
jaeger-clientdependency added to your project:"dependencies": { "jaeger-client": "^3.12.0" }A Jaeger or Zipkin collector endpoint (see the "Get the collector endpoint" section below)
Get the collector endpoint
Log on to the Managed Service for OpenTelemetry console.
In the left-side navigation pane, click Cluster Configurations. Then, click the Access point information tab.
In the top navigation bar, select a region. In the Cluster Information section, turn on Show Token.
In the Client section, click Jaeger or Zipkin.
Copy the endpoint from the Related Information column.
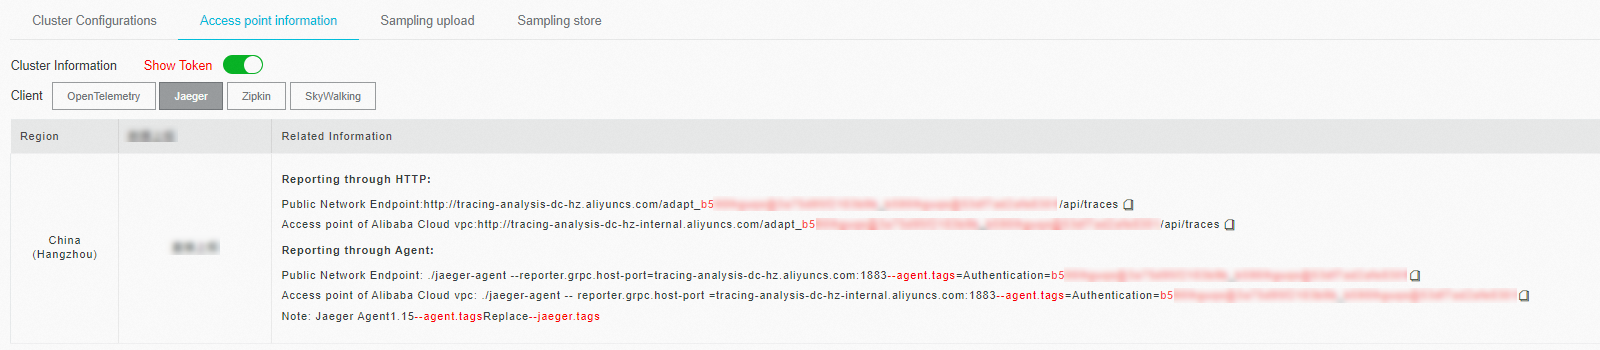
If your application runs in an Alibaba Cloud production environment, use a Virtual Private Cloud (VPC) endpoint. Otherwise, use a public endpoint. For Zipkin, use the v2 endpoint unless you have a specific reason to use v1.
Instrument your application
Step 1: Initialize the tracer
Configure the Jaeger client with your service name, sampling strategy, and collector endpoint.
Replace <endpoint> with the endpoint you obtained in the previous section. The endpoint is also available on the Overview page in the Tracing Analysis console.
const initTracer = require("jaeger-client").initTracer;

const config = {
    serviceName: 'node-service',
    sampler: {
        type: "const",
        param: 1
    },
    reporter: {
        collectorEndpoint: "<endpoint>"
    },
};
Step 2: Create a tracer instance
const tracer = initTracer(config);Step 3: Create and finish spans
A span represents a single unit of work. Start a span, optionally attach tags and logs, then finish it to send the data.
const span = tracer.startSpan("say-hello");

// Attach metadata as key-value tags (appears in the trace detail view)
span.setTag("tagKey-01", "tagValue-01");

// Record a timestamped log entry (appears in the span's log timeline)
span.log({event: "timestamp", value: Date.now()});

// Finish the span to flush it to the collector
span.finish();
Step 4: Verify traces in the console
Log on to the Tracing Analysis console and view the trace.
Complete example with Express
This example instruments an Express application. Every incoming request is wrapped in a span, and a log entry is recorded for the /api route.
const express = require("express");
const initTracer = require("jaeger-client").initTracer;
const app = express();

const config = {
    serviceName: 'node-service',
    sampler: {
        type: "const",
        param: 1
    },
    reporter: {
        collectorEndpoint: "<endpoint>"
    },
};
const tracer = initTracer(config);

// Middleware: start a span for every incoming request
app.all('*', function (req, res, next) {
    req.span = tracer.startSpan("say-hello");
    next();
});

// Route handler: log a timestamp and finish the span
app.get("/api", function (req, res) {
    const span = req.span;
    span.log({event: "timestamp", value: Date.now()});
    req.span.finish();
    res.send({code: 200, msg: "success"});
});

app.listen(3000, '127.0.0.1', function () {
    console.log('start');
});
Replace <endpoint> with your collector endpoint, then run the application:
node app.jsSend a test request:
curl http://127.0.0.1:3000/apiExpected response:
{"code":200,"msg":"success"}Placeholders
Replace the following placeholder with your actual value before running the code:
| Placeholder | Description |
|---|---|
<endpoint> | Jaeger collector endpoint obtained from the Managed Service for OpenTelemetry console. See the "Get the collector endpoint" section above. |