This topic describes how to use the Pushgateway feature provided by Managed Service for Prometheus to push data.
Solution overview
If your data source cannot or should not be regularly pulled by a Prometheus Server—for example, in an environment without stable network connectivity—you can use Pushgateway. The data source sends monitoring data to Pushgateway first. Then, the Prometheus Server periodically retrieves the data. Follow these steps:
-
Get the Pushgateway endpoint: Obtain the Pushgateway endpoint from the Managed Service for Prometheus console.
-
Report data: Use the curl command or an open source SDK to push data. Ensure that metric data is collected and monitored by Prometheus promptly and reliably.
-
Add data protection configuration (optional): The standard Pushgateway protocol does not include data protection features. The Pushgateway SDK only supports basic Basic Auth and lacks advanced, standardized authentication. This means any client that obtains the Pushgateway endpoint can push data. To protect your data, obtain a token from the Managed Service for Prometheus console and implement standard JWT authentication.
Prerequisites
You have created a Prometheus instance. For more information, see:
Step 1: Get the Push Gateway endpoint
Log on to the Cloud Monitor console. In the left navigation pane, choose . The Instances page appears.
-
In the menu bar at the top of the page, select the region where your Prometheus instance resides. In the Actions column of the destination cluster, click Settings.
-
On the Settings tab, find the Push Gateway Address section and copy the public URL.
The table in this section contains two rows: Public network and Private network. The public URL format is
https://{regionId}.arms.aliyuncs.com/prometheus/{token}/{regionId}/api/v2. The private URL format ishttp://{regionId}-intranet.arms.aliyuncs.com/prometheus/{token}/{regionId}/api/v2.
Step 2: Report data
V1 version
Push data using an open source SDK
-
The data layer currently supports Text Format and Protobuf Delimited protocols. It does not support Protobuf Text, Protobuf Compact-Text, or OpenMetrics. SDKs typically default to Protobuf Delimited.
-
Metric metadata HELP fields do not support Chinese characters. If a HELP field contains Chinese characters, data reporting fails.
This topic uses Go and Java as examples to show how to push metric data using an open source SDK.
Go example:
completionTime := prometheus.NewGauge(prometheus.GaugeOpts{
    Name: "db_backup_last_completion_timestamp_seconds",
    Help: "The timestamp of the last successful completion of a DB backup.",
})
completionTime.SetToCurrentTime()
url :   = "https://cn-hangzhou.arms.aliyuncs.com/prometheus/52b12ea9cf4bb9e35****/16727530178****/1df8lj***/cn-hangzhou/api/v2"
pusher := push.New(url, "test").
    Collector(completionTime).Client(http.DefaultClient).
    Grouping("key1", "test1").Grouping("key2", "dfdf/sdsd/").
    Format(expfmt.FmtProtoDelim)
if err := pusher.Push(); err != nil {
    fmt.Println("Could not push completion time to PushGateway: ", err)
}
Java example:
CollectorRegistry registry = new CollectorRegistry();
Gauge duration = Gauge.build()
        .name("my_batch_job_duration_seconds").help("Duration of my batch job in seconds.").register(registry);
Gauge.Timer durationTimer = duration.startTimer();
try {
    // Your code here.
    // This is only added to the registry after success,
    // so that a previous success in the Pushgateway isn't overwritten on failure.
    Gauge lastSuccess = Gauge.build()
            .name("my_batch_job_last_success").help("Last time my batch job succeeded, in unixtime.").register(registry);
    lastSuccess.setToCurrentTime();
} finally {
    durationTimer.setDuration();
    PushGateway pg = new PushGateway(new URL("https://cn-hangzhou.arms.aliyuncs.com/prometheus/52b12ea9cf4bb9e35****/16727530178****/1df8lj***/cn-hangzhou/api/v2"));
    pg.pushAdd(registry, "my_batch_job");
}-
When you use an open source SDK and enter the Pushgateway endpoint obtained from the Prometheus Monitoring console, the system automatically appends a suffix such as
/metrics/job/<JOB_NAME>{/<LABEL_NAME>/<LABEL_VALUE>}. If you do not use an open source SDK, you must append this suffix yourself. Otherwise, you receive a 404 error. -
If you push data to a shared tenant cluster of Managed Service for Prometheus, all metrics must include the label
tenant_userid=****. The tag value must be the Alibaba Cloud account ID (that is, the root account ID) that owns the metric. This distinguishes metric ownership.
Push data using the curl command
The system does not support requests with the application/x-www-form-urlencoded type. In your curl command, add a header that specifies Content-Type: text/plain; version=0.0.4; charset=utf-8.
echo "some_metric 3.14" | curl -H "Content-Type: text/plain; version=0.0.4; charset=utf-8" --data-binary @- https://cn-hangzhou.arms.aliyuncs.com/prometheus/51bbea9ck41b9e35****/16727530178****/1df8lj***/cn-hangzhou/api/v2/metrics/job/job_name/label_key_1/label_value_1/label_key_2/label_value_2-
You can append multiple labels to the end of the URL, but keep the total URL length within limits.
-
Replace “job_name” in the URL with your actual job name.
Add data protection configuration (optional)
-
Get a token: In the navigation pane on the left, choose Settings. On the Settings tab, in the Token section, click Generate Token.
-
Pass the token: After generating the token, you can pass it in one of the following ways.
-
Method 1: Set the token in the request header of your client. Otherwise, the system rejects the write request. Use the following header format:
Authorization: Bearer <token> -
Method 2: The Pushgateway SDK only supports basic Basic Auth and does not support JWT. To use the SDK with authentication, use the BasicAuth interface and set the password to the token. The server side supports this authentication method. Method 1 requires additional development effort. The following example uses the Go SDK.
pusher := push.New(url, "test").
        Collector(completionTime).Client(http.DefaultClient).
        Grouping("key1", "test1").Grouping("key2", "dfdf/sdsd/").
        .BasicAuth("admin", "actual token value").
        Format(expfmt.FmtProtoDelim)
-
V2 version
Push data using an open source SDK
-
The data layer currently supports Text Format and Protobuf Delimited protocols. It does not support Protobuf Text, Protobuf Compact-Text, or OpenMetrics. SDKs typically default to Protobuf Delimited.
-
Metric metadata HELP fields do not support Chinese characters. If a HELP field contains Chinese characters, data reporting fails.
This topic uses Go and Java as examples to show how to push metric data using an open source SDK.
Go example:
completionTime := prometheus.NewGauge(prometheus.GaugeOpts{
    Name: "db_backup_last_completion_timestamp_seconds",
    Help: "The timestamp of the last successful completion of a DB backup.",
})
completionTime.SetToCurrentTime()
url :   = "https://k8s-log-c8b5d0a212ffa41cxxxx.cn-hangzhou.log.aliyuncs.com/prometheus/k8s-log-c8b5d0a212ffa41c0a5xxxx/aliyun-prom-c8b5d0a212ffa41c0xxxx/api/v1/pushgateway"
pusher := push.New(url, "test").
    Collector(completionTime).Client(http.DefaultClient).
    Grouping("key1", "test1").Grouping("key2", "dfdf/sdsd/").
    BasicAuth("ak", "sk").
    Format(expfmt.FmtProtoDelim)
if err := pusher.Push(); err != nil {
    fmt.Println("Could not push completion time to PushGateway: ", err)
}
Java example:
CollectorRegistry registry = new CollectorRegistry();
Gauge duration = Gauge.build()
        .name("my_batch_job_duration_seconds").help("Duration of my batch job in seconds.").register(registry);
Gauge.Timer durationTimer = duration.startTimer();
try {
    // Your code here.
    // This is only added to the registry after success,
    // so that a previous success in the Pushgateway isn't overwritten on failure.
    Gauge lastSuccess = Gauge.build()
            .name("my_batch_job_last_success").help("Last time my batch job succeeded, in unixtime.").register(registry);
    lastSuccess.setToCurrentTime();
} finally {
    durationTimer.setDuration();
    PushGateway pg = new PushGateway(new URL("https://k8s-log-c8b5d0a212ffa41cxxxx.cn-hangzhou.log.aliyuncs.com/prometheus/k8s-log-c8b5d0a212ffa41c0a5xxxx/aliyun-prom-c8b5d0a212ffa41c0xxxx/api/v1/pushgateway"));
    pg.setConnectionFactory(new BasicAuthHttpConnectionFactory("ak", "sk"));
    pg.pushAdd(registry, "my_batch_job");
}-
When you use an open source SDK and enter the Pushgateway endpoint obtained from the Prometheus Monitoring console, the system automatically appends a suffix such as
/metrics/job/<JOB_NAME>{/<LABEL_NAME>/<LABEL_VALUE>}. If you do not use an open source SDK, you must append this suffix yourself. Otherwise, you receive a 404 error. -
If you push data to a shared tenant cluster of Managed Service for Prometheus, all metrics must include the label
tenant_userid=****. The tag value must be the Alibaba Cloud account ID (that is, the root account ID) that owns the metric. This distinguishes metric ownership. -
The API operation supports Security Token Service (STS) authentication. In this case, format the password in BasicAuth as
{AccessKey secret}${STS token}.
Push data using the curl command
The system does not support requests with the application/x-www-form-urlencoded type. In your curl command, add a header that specifies Content-Type: text/plain; version=0.0.4; charset=utf-8.
echo "some_metric 3.14" | curl -u 'ak:sk' -H "Content-Type: text/plain; version=0.0.4; charset=utf-8" --data-binary @- https://k8s-log-c8b5d0a212ffa41cxxxx.cn-hangzhou.log.aliyuncs.com/prometheus/k8s-log-c8b5d0a212ffa41c0a5xxxx/aliyun-prom-c8b5d0a212ffa41c0xxxx/api/v1/pushgateway/metrics/job/job_name/label_key_1/label_value_1/label_key_2/label_value_2-
You can append multiple labels to the end of the URL, but keep the total URL length within limits.
-
Replace “job_name” in the URL with your actual job name.
Validate results
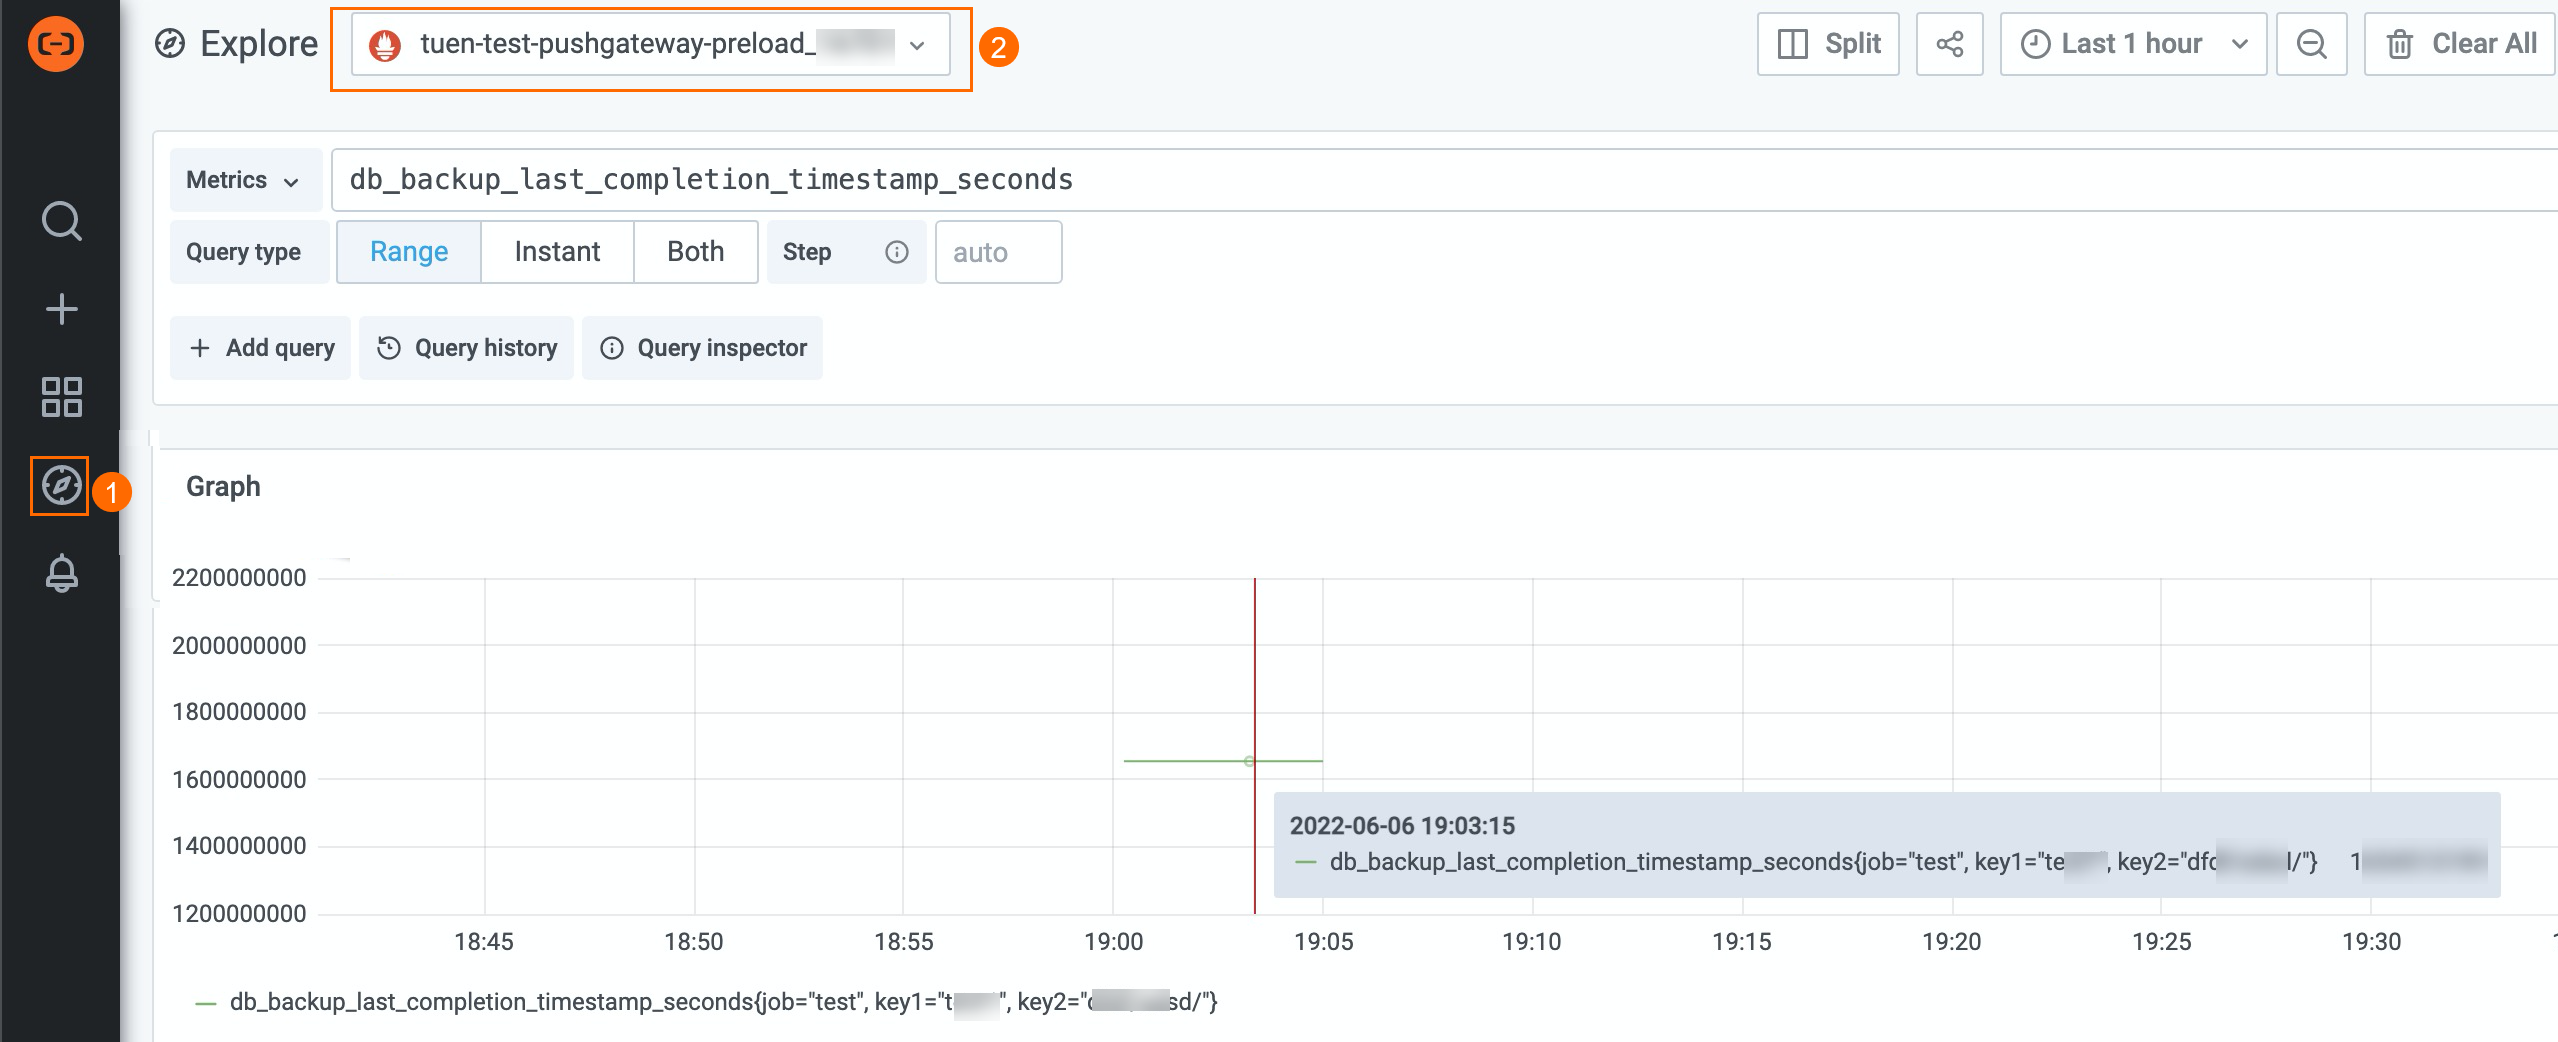
Use Grafana to query whether data was pushed successfully.
-
Go to the ApiServer dashboard: In the navigation pane on the left, select Dashboards, then click the ApiServer dashboard hyperlink. The system redirects you to the dashboard page.
-
Select Explore to view data: On the dashboard page, hover your mouse over the
 icon in the navigation pane on the left. In the pop-up box, click Explore. On the right side of the Explore page, use the drop-down list to select the corresponding Explore instance and check whether data was pushed successfully.