Instrument your Go application with a SkyWalking agent to send distributed traces to the Managed Service for OpenTelemetry console. After traces arrive, you can explore application topology, traces, slow transactions, error analysis, and SQL analytics.
Two SkyWalking agents support Go:
| Agent | Instrumentation style | Status |
|---|---|---|
| skywalking-go (recommended) | Non-intrusive -- compile-time injection via -toolexec | Actively maintained |
| Go2Sky (legacy) | Intrusive -- requires per-plug-in hooks in source code | Retired, no longer maintained |
Start with skywalking-go unless your project already relies on Go2Sky. SkyWalking is gradually porting Go2Sky plug-ins to the skywalking-go agent, which also adds gRPC framework support.
ARMS also provides a commercially supported, self-developed agent for Go that enables non-intrusive instrumentation with a richer feature set and enhanced stability.
Report traces with the skywalking-go agent
The following steps walk you through building the skywalking-go agent, configuring it for Managed Service for OpenTelemetry, and rebuilding your Go project with compile-time instrumentation.
Step 1: Get the SkyWalking endpoint
Log on to the Managed Service for OpenTelemetry console.
In the left-side navigation pane, click Cluster Configurations. On the page that appears, click the Access point information tab.
In the top navigation bar, select a region. In the Cluster Information section, turn on Show Token.
Set the Client parameter to SkyWalking.
Copy the endpoint from the Related Information column.
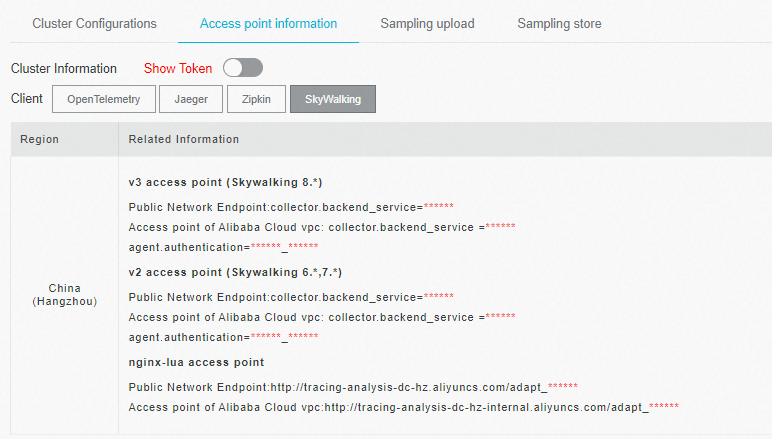
If your application runs in an Alibaba Cloud production environment, use the VPC endpoint. Otherwise, use the public endpoint.
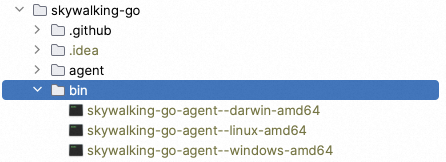
Step 2: Build the agent binary
Clone and build the skywalking-go agent:
git clone https://github.com/apache/skywalking-go.git
cd skywalking-go && make build
The build produces an executable in the skywalking-go/bin/ directory. The file name varies by OS -- for example, skywalking-go-agent--darwin-amd64 on macOS.
Step 3: Add the SkyWalking module to your project
Choose one of the following methods:
Option A -- Import in code
(add to your main package):
package main

import (
	_ "github.com/apache/skywalking-go"
)
Option B -- Inject with the agent binary
skywalking-go/bin/skywalking-go-agent--darwin-amd64 -inject path/to/your-projectIf the inject method fails, use Option A instead.
Step 4: Configure the agent
Create a config.yaml file with at least the following three parameters:
agent:
  service_name: ${SW_AGENT_NAME:<your-service-name>}

reporter:
  grpc:
    backend_service: ${SW_AGENT_REPORTER_GRPC_BACKEND_SERVICE:<your-skywalking-endpoint>}
    authentication: ${SW_AGENT_REPORTER_GRPC_AUTHENTICATION:<your-auth-token>}
Replace the placeholders with your values:
| Placeholder | Description | Example |
|---|---|---|
<your-service-name> | Name that identifies your application in the console | my-go-service |
<your-skywalking-endpoint> | Endpoint obtained in Step 1 | xxx.api.aliyuncs.com:11800 |
<your-auth-token> | Authentication token shown next to the endpoint | abcdef123456 |
Set these values in config.yaml directly (recommended) or through environment variables:
export SW_AGENT_NAME=my-go-service
export SW_AGENT_REPORTER_GRPC_BACKEND_SERVICE=xxx.api.aliyuncs.com:11800
export SW_AGENT_REPORTER_GRPC_AUTHENTICATION=abcdef123456
Disable specific plug-ins
By default, the skywalking-go agent instruments all supported plug-ins. To exclude specific plug-ins, add the excluded parameter:
plugin:
  # Disable a single plug-in
  excluded: ${SW_AGENT_PLUGIN_EXCLUDES:sql}

  # Disable multiple plug-ins (comma-separated)
# excluded: ${SW_AGENT_PLUGIN_EXCLUDES:sql,gorm}Step 5: Rebuild your project
Compile with the -toolexec flag pointing to the agent binary and your config file:
sudo go build -toolexec "path/to/skywalking-go-agent -config path/to/config.yaml" -aStep 6: Start your application and verify
Run the compiled binary. The agent instruments all supported plug-ins automatically and begins reporting traces over gRPC.
After you start the project, SkyWalking reports data to the Managed Service for OpenTelemetry console.
Environment variables reference
| Environment variable | Description | Default |
|---|---|---|
SW_AGENT_NAME | Application name displayed in the console | None |
SW_AGENT_INSTANCE_NAME | Instance name | Auto-generated |
SW_AGENT_SAMPLE | Sampling rate (0 to 1, where 1 = 100%) | 1 |
SW_AGENT_REPORTER_GRPC_BACKEND_SERVICE | gRPC endpoint for trace reporting | 127.0.0.1:11800 |
SW_AGENT_REPORTER_GRPC_AUTHENTICATION | Authentication token | None |
SW_AGENT_PLUGIN_EXCLUDES | Comma-separated list of plug-ins to disable | None |
Supported plug-ins
The skywalking-go agent automatically instruments the following libraries at compile time. No per-library installation is required.
| Library |
|---|
| sql |
| dubbo-go |
| gear |
| gin |
| go-restful |
| gorm |
| http |
| go-kratos v2 |
| logrus |
| go-micro v3.5.0 |
| mongo |
| go-resty v2.2.0 |
| zap v1.16.0 |
Report traces with the Go2Sky agent (legacy)
SkyWalking has retired Go2Sky. It no longer accepts pull requests or provides updates. Use the skywalking-go agent for new projects.
Step 1: Set up the reporter
Configure the gRPC reporter by hard-coding parameters or setting environment variables.
Option A -- Hard-code in your project
report, err := reporter.NewGRPCReporter(
    "<your-backend-server-address>",
    reporter.WithAuthentication("<your-auth-token>"))
Option B -- Set environment variables
# Permanent -- add to your shell profile
export SW_AGENT_COLLECTOR_BACKEND_SERVICES=<your-collector-address>
export SW_AGENT_AUTHENTICATION=<your-auth-token>

# Then start your application (the agent reads these variables automatically)
Step 2: Create a tracer
ServiceName := "<your-service-name>"
tracer, err := go2sky.NewTracer(ServiceName, go2sky.WithReporter(report))
Step 3: Add plug-in hooks
Go2Sky requires a hook for each instrumented library. See the go2sky-plugins repository on GitHub -- each plug-in folder contains a README with integration instructions.
Example -- gin framework:
package main

import (
	"log"

	"github.com/SkyAPM/go2sky"
	v3 "github.com/SkyAPM/go2sky-plugins/gin/v3"
	"github.com/SkyAPM/go2sky/reporter"
	"github.com/gin-gonic/gin"
)

func main() {
	// Use gRPC reporter for production
	re, err := reporter.NewLogReporter()
	if err != nil {
		log.Fatalf("new reporter error %v \n", err)
	}
	defer re.Close()

	tracer, err := go2sky.NewTracer("gin-server", go2sky.WithReporter(re))
	if err != nil {
		log.Fatalf("create tracer error %v \n", err)
	}

	gin.SetMode(gin.ReleaseMode)
	r := gin.New()

	// Use go2sky middleware with tracing
	r.Use(v3.Middleware(r, tracer))

	// Add your routes here
}
Step 4: Restart the application
After adding hooks, restart your application. Traces begin flowing to the Managed Service for OpenTelemetry console.
Supported plug-in libraries
Each plug-in requires a separate go get installation:
| Library | Install command |
|---|---|
| sql | go get -u github.com/SkyAPM/go2sky-plugins/sql |
| dubbo-go | go get -u github.com/SkyAPM/go2sky-plugins/dubbo-go |
| gear | go get -u github.com/SkyAPM/go2sky-plugins/gear |
| gin | go get -u github.com/SkyAPM/go2sky-plugins/gin/v2 or gin/v3 |
| go-restful | go get -u github.com/SkyAPM/go2sky-plugins/go-restful |
| gorm | go get -u github.com/SkyAPM/go2sky-plugins/gorm |
| http | go get -u github.com/SkyAPM/go2sky |
| go-kratos v2 | go get -u github.com/SkyAPM/go2sky-plugins/kratos |
| logrus | go get -u github.com/SkyAPM/go2sky-plugins/logrus |
| go-micro v3.5.0 | go get -u github.com/SkyAPM/go2sky-plugins/micro |
| mongo | go get -u github.com/SkyAPM/go2sky-plugins/mongo |
| go-resty v2.2.0 | go get -u github.com/SkyAPM/go2sky-plugins/resty |
| zap v1.16.0 | go get -u github.com/SkyAPM/go2sky-plugins/zap |
Environment variables reference
| Environment variable | Description | Default |
|---|---|---|
SW_AGENT_NAME | Application name | None |
SW_AGENT_LAYER | Layer name for the instance | None |
SW_AGENT_INSTANCE_NAME | Instance name | Random |
SW_AGENT_SAMPLE | Sampling rate (1 = full sampling) | 1 |
SW_AGENT_COLLECTOR_BACKEND_SERVICES | Server endpoint for trace reporting | None |
SW_AGENT_AUTHENTICATION | Authentication token | None |
SW_AGENT_COLLECTOR_HEARTBEAT_PERIOD | Heartbeat interval in seconds | 20 |
SW_AGENT_COLLECTOR_GET_AGENT_DYNAMIC_CONFIG_INTERVAL | Dynamic config fetch interval in seconds | 20 |
SW_AGENT_COLLECTOR_MAX_SEND_QUEUE_SIZE | Span queue buffer size | 30000 |
SW_AGENT_PROCESS_STATUS_HOOK_ENABLE | Enable process status hook | false |
SW_AGENT_PROCESS_LABELS | Comma-separated process labels | None |
FAQ
What do I do if the skywalking-go inject command fails?

If the -inject method fails, add the SkyWalking import directly in your main package instead:
import _ "github.com/apache/skywalking-go"Then rebuild with -toolexec as described in Step 5.
Why does the console show broken traces for cross-process calls with Go2Sky?
Managed Service for OpenTelemetry correlates spans by trace IDs carried in HTTP headers. If traces appear disconnected across services, trace context is not propagating correctly.
To fix this, create entry and exit spans that propagate trace context across HTTP boundaries:
// CreateEntrySpan -- extract trace context from an incoming HTTP request
span, ctx, err := tracer.CreateEntrySpan(r.Context(), "/api/login", func(key string) (string, error) {
    return r.Header.Get(key), nil
})

// CreateExitSpan -- inject trace context into an outgoing HTTP request
span, err := tracer.CreateExitSpan(req.Context(), "/service/validate", "tomcat-service:8080", func(key, value string) error {
    req.Header.Set(key, value)
    return nil
})
For in-process spans (no network boundary), use CreateLocalSpan:
span, ctx, err := tracer.CreateLocalSpan(context.Background())
subSpan, newCtx, err := tracer.CreateLocalSpan(ctx)
Every HTTP call that crosses a process boundary must carry trace context. Without CreateEntrySpan and CreateExitSpan at each boundary, the downstream service starts a new, disconnected trace.
Sample code
For a complete working example, see the skywalking-demo repository on GitHub.