When you need distributed tracing for PHP applications running on Alibaba Cloud, OpenTelemetry provides a vendor-neutral instrumentation standard. Instrument your PHP application with the OpenTelemetry SDK and report trace data to Managed Service for OpenTelemetry. After traces reach Application Real-Time Monitoring Service (ARMS), you can view application topology, traces, abnormal and slow transactions, and SQL analysis in the ARMS console.
Choose one of the following instrumentation approaches based on your requirements:
| Approach | PHP version | Best for |
|---|---|---|
| Automatic instrumentation | PHP 8.0+ | Zero-code setup using the OpenTelemetry PHP extension. Works with supported frameworks. |
| Manual instrumentation | PHP 7.4+ | Full control over spans, attributes, and events. Use for custom spans or unsupported frameworks. |
Prerequisites
Before you begin, make sure that you have:
PHP 8.0 or later (automatic instrumentation) or PHP 7.4 or later (manual instrumentation)
An OTLP endpoint and authentication token from the ARMS console (see the Get an endpoint section below)
Get an endpoint
Log on to the ARMS console.
In the left-side navigation pane, click Integration Center.
In the Server-side Applications section, click the OpenTelemetry card.
In the OpenTelemetry panel, click the Start Integration tab and select a region.
When you access a region for the first time, resources are automatically initialized there.
Set Connection Type and Export Protocol, then copy the endpoint.
Parameter Options Guidance Connection Type Alibaba Cloud VPC Network, Public Network Use VPC if your service runs in the same Alibaba Cloud region. Otherwise, use Public Network. Export Protocol HTTP (recommended), gRPC Choose based on your client's protocol support. 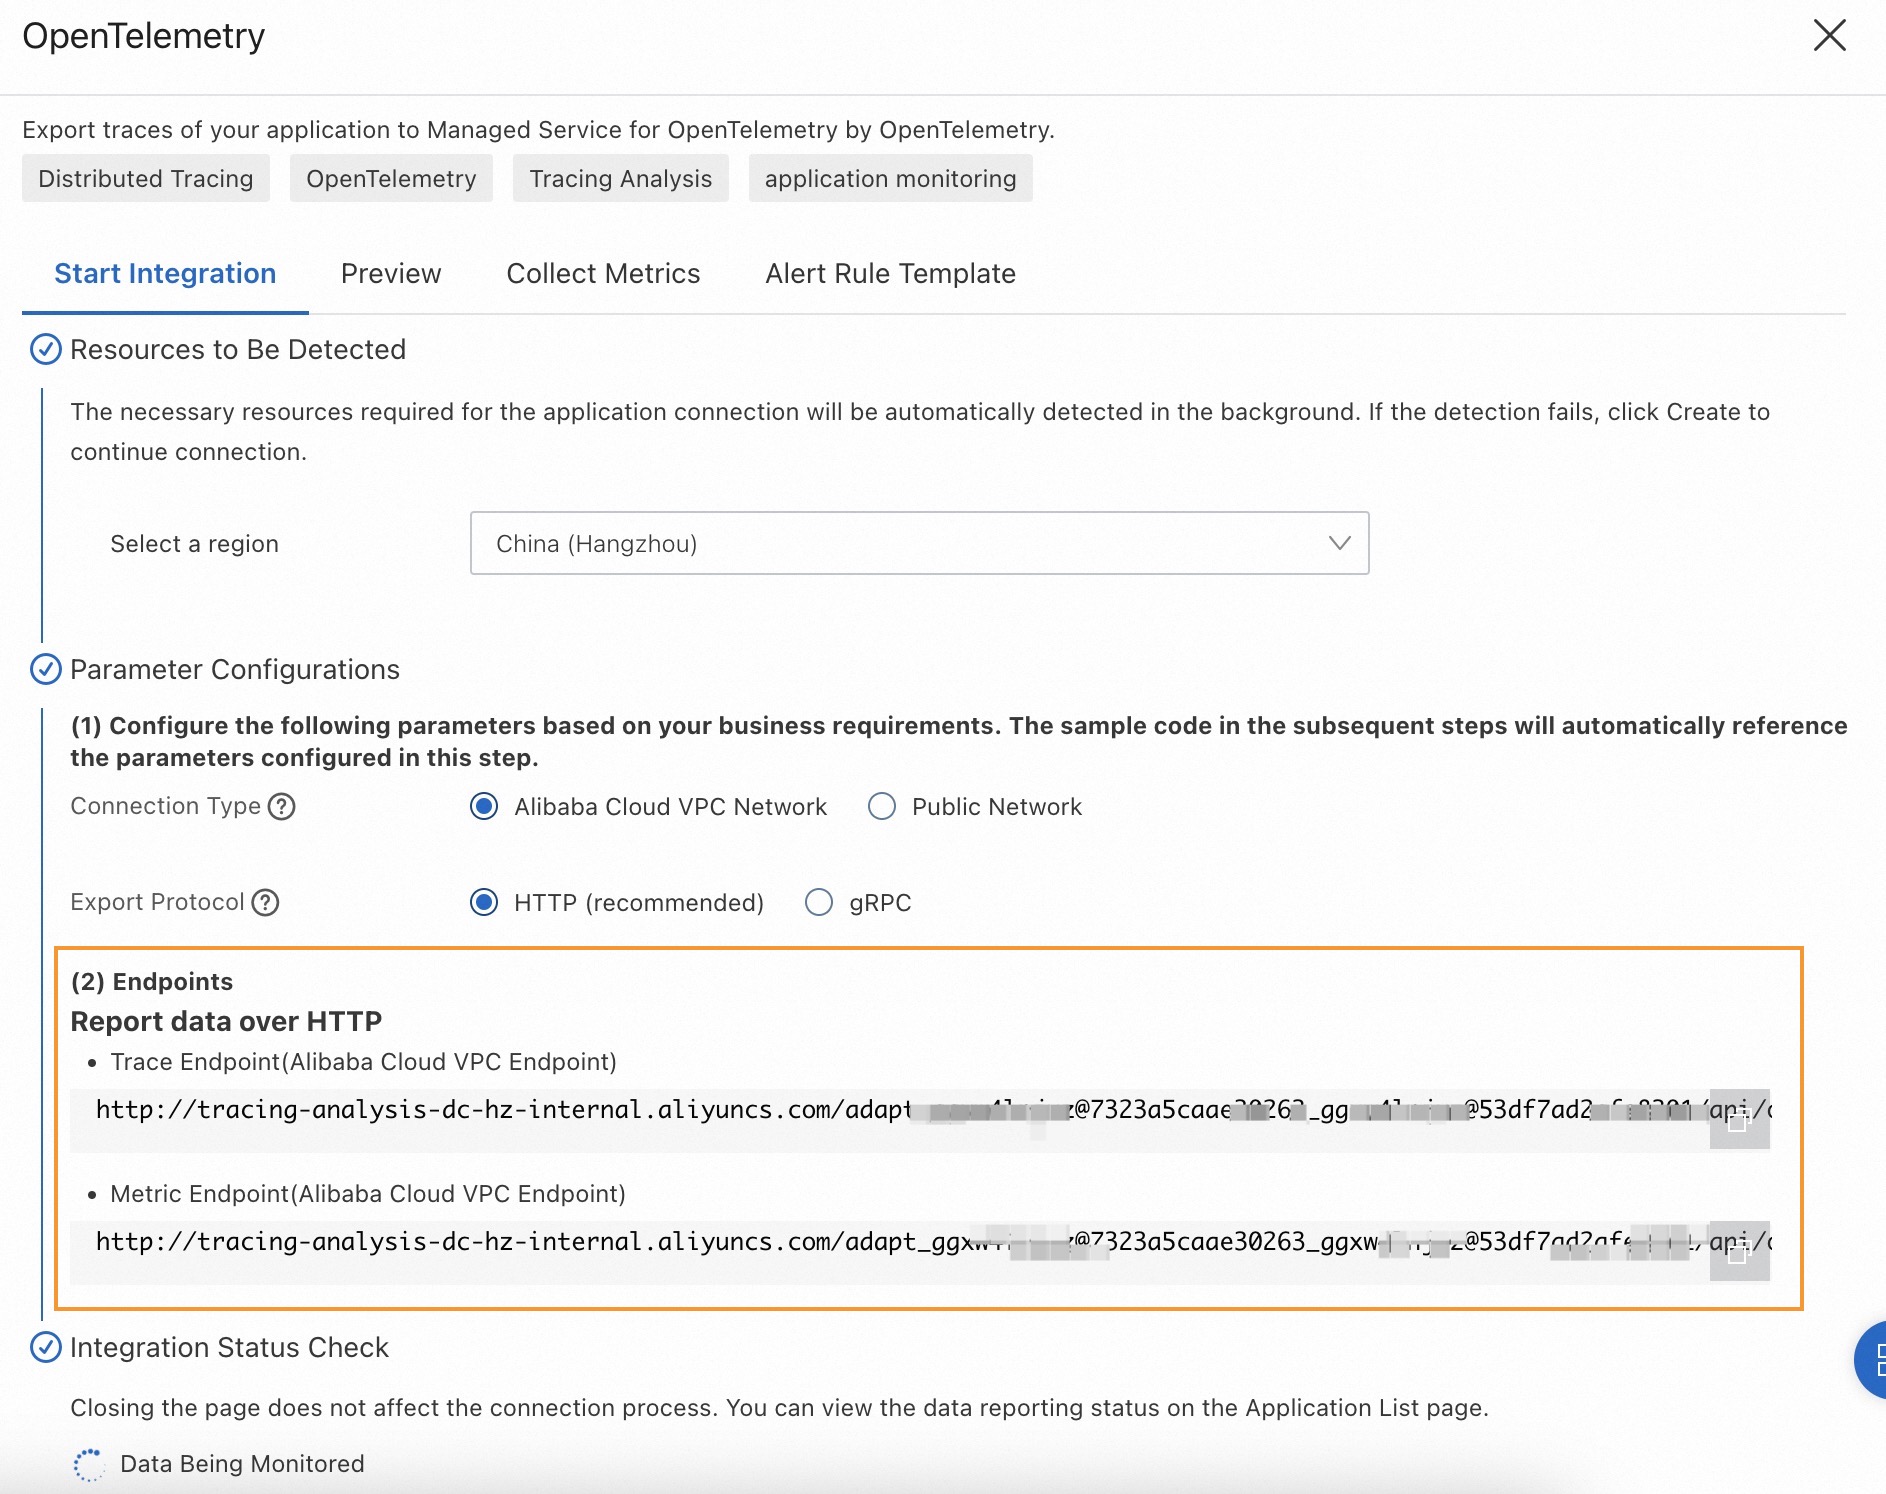
Sample code
Download the complete sample code from php-demo on GitHub.
Automatic instrumentation
Automatic instrumentation uses the OpenTelemetry PHP extension to generate traces without modifying your application code. The following steps use a Slim-based dice-rolling app as an example.
Step 1: Create the application
Initialize the project:
mkdir <project-name> && cd <project-name>composer init \ --no-interaction \ --stability beta \ --require slim/slim:"^4" \ --require slim/psr7:"^1" composer updateCreate an
index.phpfile in the project directory:<?php use Psr\Http\Message\ResponseInterface as Response; use Psr\Http\Message\ServerRequestInterface as Request; use Slim\Factory\AppFactory; require __DIR__ . '/vendor/autoload.php'; $app = AppFactory::create(); $app->get('/rolldice', function (Request $request, Response $response) { $result = random_int(1,6); $response->getBody()->write(strval($result)); return $response; }); $app->run();Verify the app runs: Open
http://localhost:8080/rolldicein a browser. You should see a random number between 1 and 6.php -S localhost:8080
Step 2: Build the OpenTelemetry PHP extension
Install build dependencies:
macOS:
brew install gcc make autoconfLinux (apt):
sudo apt-get install gcc make autoconf
Build and install the extension with PECL: A successful build ends with output similar to:
pecl install opentelemetryBuild process completed successfully Installing '/opt/homebrew/Cellar/php/8.2.8/pecl/20220829/opentelemetry.so' install ok: channel://pecl.php.net/opentelemetry-1.0.0beta6 Extension opentelemetry enabled in php.ini(Optional) If the output does not include
Extension opentelemetry enabled in php.ini, manually add the extension to yourphp.inifile:[opentelemetry] extension=opentelemetry.soVerify the extension is loaded: Expected output: Alternatively, run
php --ri opentelemetryfor detailed extension info:php -m | grep opentelemetryopentelemetryopentelemetry opentelemetry support => enabled extension version => 1.0.0beta6
Step 3: Install instrumentation dependencies
# Install the gRPC extension (may take several minutes)
pecl install grpc
composer config allow-plugins.php-http/discovery false
composer require \
open-telemetry/sdk \
open-telemetry/opentelemetry-auto-slim \
open-telemetry/exporter-otlp \
php-http/guzzle7-adapter \
open-telemetry/transport-grpc| Package | Purpose |
|---|---|
open-telemetry/sdk | Core OpenTelemetry SDK for PHP |
open-telemetry/opentelemetry-auto-slim | Automatic instrumentation for Slim |
open-telemetry/exporter-otlp | OTLP exporter |
php-http/guzzle7-adapter | HTTP client adapter |
open-telemetry/transport-grpc | gRPC transport layer |
Step 4: Run the instrumented application
Start the application with environment variables that configure the OpenTelemetry SDK:
env OTEL_PHP_AUTOLOAD_ENABLED=true \
    OTEL_SERVICE_NAME=<your-service-name> \
    OTEL_TRACES_EXPORTER=otlp \
    OTEL_METRICS_EXPORTER=none \
    OTEL_LOGS_EXPORTER=none \
    OTEL_EXPORTER_OTLP_PROTOCOL=grpc \
    OTEL_EXPORTER_OTLP_ENDPOINT=<endpoint> \
    OTEL_EXPORTER_OTLP_HEADERS=Authentication=<token> \
    OTEL_PROPAGATORS=baggage,tracecontext \
    php -S localhost:8080
Replace the following placeholders with your values:
| Placeholder | Description | Example |
|---|---|---|
<your-service-name> | Application name displayed in ARMS | php-demo |
<endpoint> | gRPC endpoint from the Prerequisites section | http://tracing-analysis-dc-hz.aliyuncs.com:8090 |
<token> | Authentication token from the Prerequisites section | -- |
Verify
Open
http://localhost:8080/rolldicein a browser. Each request generates a trace automatically.Log on to the Managed Service for OpenTelemetry console.
On the Applications page, find your application and click its name to view traces.
It may take a few minutes before traces appear in the console. If traces still do not appear, verify that the OpenTelemetry extension is loaded (php -m | grep opentelemetry) and that your endpoint and token are correct.Manual instrumentation
Manual instrumentation gives you full control over span creation, attributes, events, and error recording. Use this approach when automatic instrumentation does not cover your use case or when you need custom spans alongside auto-instrumented ones.
Step 1: Create the application
Follow the same steps as in the Automatic instrumentation > Step 1 section to create the Slim-based dice-rolling app.
Step 2: Install OpenTelemetry SDK dependencies
Install the HTTP client library and the OpenTelemetry SDK packages. Choose the tab that matches your export protocol.
gRPC
composer require guzzlehttp/guzzlecomposer require \
open-telemetry/sdk \
open-telemetry/exporter-otlp# Install the gRPC extension if not already installed
pecl install grpc
composer require open-telemetry/transport-grpcHTTP
composer require guzzlehttp/guzzlecomposer require \
open-telemetry/sdk \
open-telemetry/exporter-otlpStep 3: Write the initialization code
Create an opentelemetry_util.php file in the same directory as index.php. This file sets up the TracerProvider, exporter, and sampler.
gRPC
<?php
use OpenTelemetry\API\Common\Instrumentation\Globals;
use OpenTelemetry\API\Trace\Propagation\TraceContextPropagator;
use OpenTelemetry\Contrib\Otlp\SpanExporter;
use OpenTelemetry\SDK\Common\Attribute\Attributes;
use OpenTelemetry\SDK\Common\Export\Stream\StreamTransportFactory;
use OpenTelemetry\SDK\Resource\ResourceInfo;
use OpenTelemetry\SDK\Resource\ResourceInfoFactory;
use OpenTelemetry\SDK\Sdk;
use OpenTelemetry\SDK\Trace\Sampler\AlwaysOnSampler;
use OpenTelemetry\SDK\Trace\Sampler\ParentBased;
use OpenTelemetry\SDK\Trace\SpanProcessor\SimpleSpanProcessor;
use OpenTelemetry\SDK\Trace\SpanProcessor\BatchSpanProcessorBuilder;
use OpenTelemetry\SDK\Trace\TracerProvider;
use OpenTelemetry\SemConv\ResourceAttributes;
use OpenTelemetry\Contrib\Grpc\GrpcTransportFactory;
use OpenTelemetry\Contrib\Otlp\OtlpUtil;
use OpenTelemetry\API\Signals;

function initOpenTelemetry()
{
    // 1. Define the service resource
    $resource = ResourceInfoFactory::emptyResource()->merge(ResourceInfo::create(Attributes::create([
        ResourceAttributes::SERVICE_NAME => '<your-service-name>',  // Required
        ResourceAttributes::HOST_NAME => '<your-host-name>'         // Optional
    ])));

    // 2. Create a SpanExporter that sends data over gRPC
    $headers = [
        'Authentication' => '<your-token>',
    ];
    $transport = (new GrpcTransportFactory())->create(
        '<grpc-endpoint>' . OtlpUtil::method(Signals::TRACE),
        'application/x-protobuf',
        $headers
    );
    $spanExporter = new SpanExporter($transport);

    // 3. Build and register the global TracerProvider
    $tracerProvider = TracerProvider::builder()
        ->addSpanProcessor(
            (new BatchSpanProcessorBuilder($spanExporter))->build()
        )
        ->setResource($resource)
        ->setSampler(new ParentBased(new AlwaysOnSampler()))
        ->build();

    Sdk::builder()
        ->setTracerProvider($tracerProvider)
        ->setPropagator(TraceContextPropagator::getInstance())
        ->setAutoShutdown(true)   // Flush pending spans on shutdown
        ->buildAndRegisterGlobal();
}
?>
Replace the following placeholders:
| Placeholder | Description |
|---|---|
<your-service-name> | Application name displayed in ARMS |
<your-host-name> | Hostname of your server |
<your-token> | Authentication token for gRPC export |
<grpc-endpoint> | gRPC endpoint from the Prerequisites section |
HTTP
<?php
use OpenTelemetry\API\Common\Instrumentation\Globals;
use OpenTelemetry\API\Trace\Propagation\TraceContextPropagator;
use OpenTelemetry\Contrib\Otlp\SpanExporter;
use OpenTelemetry\SDK\Common\Attribute\Attributes;
use OpenTelemetry\SDK\Common\Export\Stream\StreamTransportFactory;
use OpenTelemetry\SDK\Resource\ResourceInfo;
use OpenTelemetry\SDK\Resource\ResourceInfoFactory;
use OpenTelemetry\SDK\Sdk;
use OpenTelemetry\SDK\Trace\Sampler\AlwaysOnSampler;
use OpenTelemetry\SDK\Trace\Sampler\ParentBased;
use OpenTelemetry\SDK\Trace\SpanProcessor\SimpleSpanProcessor;
use OpenTelemetry\SDK\Trace\SpanProcessor\BatchSpanProcessorBuilder;
use OpenTelemetry\SDK\Trace\TracerProvider;
use OpenTelemetry\SemConv\ResourceAttributes;
use OpenTelemetry\Contrib\Otlp\OtlpHttpTransportFactory;
use OpenTelemetry\SDK\Common\Export\TransportFactoryInterface;

function initOpenTelemetry()
{
    // 1. Define the service resource
    $resource = ResourceInfoFactory::emptyResource()->merge(ResourceInfo::create(Attributes::create([
        ResourceAttributes::SERVICE_NAME => '<your-service-name>',  // Required
        ResourceAttributes::HOST_NAME => '<your-host-name>'         // Optional
    ])));

    // 2. Create a SpanExporter that sends data over HTTP
    $transport = (new OtlpHttpTransportFactory())->create(
        '<http-endpoint>',
        'application/x-protobuf'
    );
    $spanExporter = new SpanExporter($transport);

    // 3. Build and register the global TracerProvider
    $tracerProvider = TracerProvider::builder()
        ->addSpanProcessor(
            (new BatchSpanProcessorBuilder($spanExporter))->build()
        )
        ->setResource($resource)
        ->setSampler(new ParentBased(new AlwaysOnSampler()))
        ->build();

    Sdk::builder()
        ->setTracerProvider($tracerProvider)
        ->setPropagator(TraceContextPropagator::getInstance())
        ->setAutoShutdown(true)   // Flush pending spans on shutdown
        ->buildAndRegisterGlobal();
}
?>
Replace the following placeholders:
| Placeholder | Description |
|---|---|
<your-service-name> | Application name displayed in ARMS |
<your-host-name> | Hostname of your server |
<http-endpoint> | HTTP endpoint from the Prerequisites section |
Step 4: Add instrumentation to the application
Update index.php to initialize OpenTelemetry and create spans.
Import the required packages and initialize OpenTelemetry at the top of
index.php:<?php use OpenTelemetry\API\Common\Instrumentation\Globals; use OpenTelemetry\SDK\Common\Attribute\Attributes; use OpenTelemetry\SDK\Trace\TracerProvider; require __DIR__ . '/opentelemetry_util.php'; // Initialize OpenTelemetry: configure service name, exporter, and global TracerProvider initOpenTelemetry();Create a span in the
/rolldiceroute to capture request-level tracing:$app->get('/rolldice', function (Request $request, Response $response) { // Get a tracer instance $tracer = \OpenTelemetry\API\Globals::tracerProvider()->getTracer('my-tracer'); // Start a span for this operation $span = $tracer->spanBuilder("/rolldice")->startSpan(); $span->setAttribute("http.method", "GET"); $span->addEvent("Init"); // Configure events with attributes $eventAttributes = Attributes::create([ "key1" => "value", "key2" => 3.14159, ]); // Business logic $result = random_int(1,6); $response->getBody()->write(strval($result)); $span->addEvent("End"); $span->end(); return $response; });Create nested spans to trace multi-step operations. The following
/rolltwodicesroute demonstrates a parent-child span relationship:$app->get('/rolltwodices', function (Request $request, Response $response) { $tracer = \OpenTelemetry\API\Globals::tracerProvider()->getTracer('my-tracer'); // Create a parent span $parentSpan = $tracer->spanBuilder("/rolltwodices/parent")->startSpan(); $scope = $parentSpan->activate(); $value1 = random_int(1,6); // Create a child span within the parent scope $childSpan = $tracer->spanBuilder("/rolltwodices/parent/child")->startSpan(); // Business logic $value2 = random_int(1,6); $result = "dice1: " . $value1 . ", dice2: " . $value2; // End spans and detach scope $childSpan->end(); $parentSpan->end(); $scope->detach(); $response->getBody()->write(strval($result)); return $response; });Record exceptions on spans. The following
/errorroute demonstrates error handling:$app->get('/error', function (Request $request, Response $response) { $tracer = \OpenTelemetry\API\Globals::tracerProvider()->getTracer('my-tracer'); $span3 = $tracer->spanBuilder("/error")->startSpan(); try { // Simulate an exception throw new \Exception('exception!'); } catch (\Throwable $t) { // Mark the span as an error $span3->setStatus(\OpenTelemetry\API\Trace\StatusCode::STATUS_ERROR, "exception in span3!"); // Record the exception with stack trace $span3->recordException($t, ['exception.escaped' => true]); } finally { $span3->end(); $response->getBody()->write("error"); return $response; } });
Step 5: Run and verify
Start the application:
php -S localhost:8080Send requests to generate trace data:
   http://localhost:8080/rolldice
   http://localhost:8080/rolltwodices
   http://localhost:8080/error
Log on to the Managed Service for OpenTelemetry console. On the Applications page, find your application and click its name to view traces.
It may take a few minutes before traces appear in the console. If traces still do not appear, verify that your endpoint and token are correct, and that your server can reach the endpoint over the network.
What's next
Explore additional auto-instrumentation packages for other frameworks in the OpenTelemetry Registry