When you need distributed tracing for a Go application but already use Zipkin in your stack, you can report trace data directly to Managed Service for OpenTelemetry. After integration, you can view application topology, traces, abnormal and slow transactions, and SQL analysis in the console.
For richer features, advanced tracing capabilities, and a better experience, connect your application to Managed Service for OpenTelemetry by using the OpenTelemetry protocol. For more information, see Preparations.
ARMS provides a commercially supported, self-developed agent for Go applications. This agent enables non-intrusive instrumentation and provides a richer feature set and greater stability. For more information, see Monitor Go applications.
How it works
Zipkin is an open source distributed tracing system developed by Twitter that aggregates real-time monitoring data from multiple heterogeneous systems.
Your Go application uses the Zipkin client library to create spans and send them to the Managed Service for OpenTelemetry endpoint over HTTP:

Prerequisites
Before you begin, make sure that you have:
A Go development environment
Access to the Managed Service for OpenTelemetry console
The Zipkin endpoint for your region (see Get the Zipkin endpoint)
Get the Zipkin endpoint
Log on to the Managed Service for OpenTelemetry console.
In the left-side navigation pane, click Cluster Configurations. On the page that appears, click the Access point information tab.
In the top navigation bar, select a region. In the Cluster Information section, turn on Show Token.
Set Client to Jaeger or Zipkin. In this example, Jaeger is selected.
Copy the endpoint from the Related Information column.
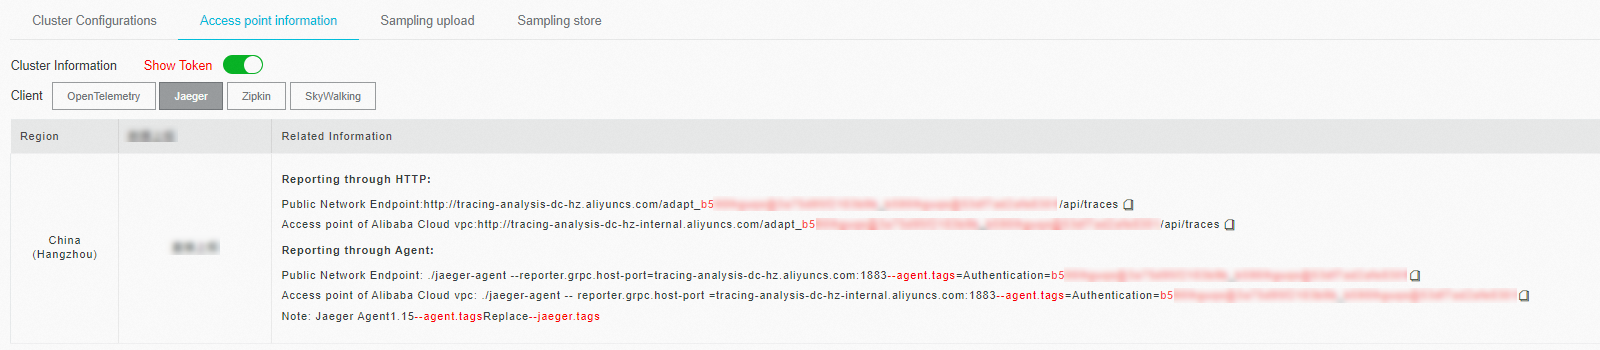
If your application runs in an Alibaba Cloud production environment, use the VPC endpoint. Otherwise, use the public endpoint. Use the v2 endpoint unless you have a specific reason to use v1.
Quick start
Run a pre-built demo to verify that trace data reaches Managed Service for OpenTelemetry before you instrument your own application.
Download the demo project.
Open
utils.goand replace<endpoint>with the Zipkin endpoint you obtained in Get the Zipkin endpoint.Install dependencies:
dep ensureRun the application:
go run main.goVerify trace data in the console:
Log on to the ARMS console.
In the left-side navigation pane, choose Application Monitoring > Applications.
Click the application name to view its trace data.
If the  icon appears in the Language column, the application is connected to Application Monitoring. If a hyphen (-) appears, the application is connected to Managed Service for OpenTelemetry.
Instrument your application
This section walks through each instrumentation step: adding dependencies, creating a tracer, recording spans, tagging spans, and propagating context across services.
Add dependencies
Add the Zipkin Go library and a router to your project:
[[constraint]]
  name = "github.com/openzipkin/zipkin-go"
  version = "0.1.1"

[[constraint]]
  name = "github.com/gorilla/mux"
  version = "1.6.2"
Create a tracer
A tracer generates spans that record the timing and metadata of distributed operations. Configure it with the reporting endpoint, local service identity, and a sampling strategy.
func getTracer(serviceName string, ip string) *zipkin.Tracer {
    // Create a reporter that sends spans to the Zipkin endpoint.
    // Replace the URL with your actual endpoint from the console.
    reporter := httpreporter.NewReporter("http://tracing-analysis-dc-hz.aliyuncs.com/adapt_aokcdqnxyz@123456ff_abcdef123@abcdef123/api/v2/spans")

    // Set the local endpoint so spans are tagged with this service's identity.
    endpoint, _ := zipkin.NewEndpoint(serviceName, ip)

    // Sample every request. Increase the modulo value to reduce sampling
    // and lower reporting costs (e.g., NewModuloSampler(10) samples 1 in 10).
    sampler := zipkin.NewModuloSampler(1)

    // Initialize the tracer with the reporter, endpoint, and sampler.
    tracer, _ := zipkin.NewTracer(
        reporter,
        zipkin.WithLocalEndpoint(endpoint),
        zipkin.WithSampler(sampler),
    )
    return tracer
}
Create spans
A root span records the top-level operation of a request:
span := tracer.StartSpan("some_operation")
// ... perform the operation ...
span.Finish()
To track sub-operations within a request, create child spans by passing the parent context:
childSpan := tracer.StartSpan("some_operation2", zipkin.Parent(span.Context()))
// ... perform the sub-operation ...
childSpan.Finish()
Add custom tags and annotations (optional)
Tags attach key-value metadata to a span for filtering and debugging. For example, record the HTTP status code:
childSpan.Tag("http.status_code", statusCode)Annotations record timestamped events within a span. Use them to log errors with stack traces:
childSpan := tracer.StartSpan("some_operation2", zipkin.Parent(span.Context()))
// ... perform the operation ...

var events = make(map[string]string)
events["event"] = "error"
events["stack"] = "Runtime Exception: unable to find userid"
jsonStr, err := json.Marshal(events)
if err == nil {
    childSpan.Annotate(time.Now(), string(jsonStr))
}
childSpan.Finish()
Propagate context across services
Trace context -- TraceId, ParentSpanId, SpanId, and Sampled -- must travel with each remote procedure call (RPC) so that spans from different services link into a single trace. Zipkin uses B3 headers to propagate context over HTTP and gRPC.

Client side: inject context into the outgoing request
req, _ := http.NewRequest("GET", "/", nil)

// Inject trace context as B3 headers into the HTTP request.
injector := b3.InjectHTTP(req)
injector(sp.Context())
Server side: extract context from the incoming request
req, _ := http.NewRequest("GET", "/", nil)
b3.InjectHTTP(req)(sp.Context())

b.ResetTimer()
_ = b3.ExtractHTTP(copyRequest(req))
Troubleshooting
No data after instrumentation
Check the error output from your application:
failed the request with status code 403: The username or password is invalid. Copy the full endpoint -- including the authentication segment -- from the Access point information tab.No errors but no data: Verify that the endpoint URL includes the protocol (
http://orhttps://) and the full path ending in/api/v2/spans. Also confirm that your network allows outbound connections to the endpoint.Sampling configuration:
NewModuloSamplerwith a value higher than 1 samples only a fraction of requests. Set it to1during testing to capture every request.