Instrument a Ruby application with the OpenTelemetry SDK and export trace data to Managed Service for OpenTelemetry. This guide covers two approaches:
Auto-instrumentation (recommended) -- automatically generates spans for supported frameworks such as Rails, Sinatra, and common libraries. Start here for the fastest setup.
Manual instrumentation -- gives fine-grained control over span creation. Use this to trace custom business logic that auto-instrumentation does not cover.
Prerequisites
Ruby runtime: MRI Ruby 3.0+, JRuby 9.3.2.0+, or TruffleRuby 22.1+
An Alibaba Cloud account with Application Real-Time Monitoring Service (ARMS) activated
Get the OpenTelemetry endpoint
Log on to the Managed Service for OpenTelemetry console.
In the left-side navigation pane, click Cluster Configurations. Then, click the Access point information tab.
In the top navigation bar, select a region. In the Cluster Information section, turn on Show Token.
In the Client section, click OpenTelemetry.
Copy the endpoint from the Related Information column.
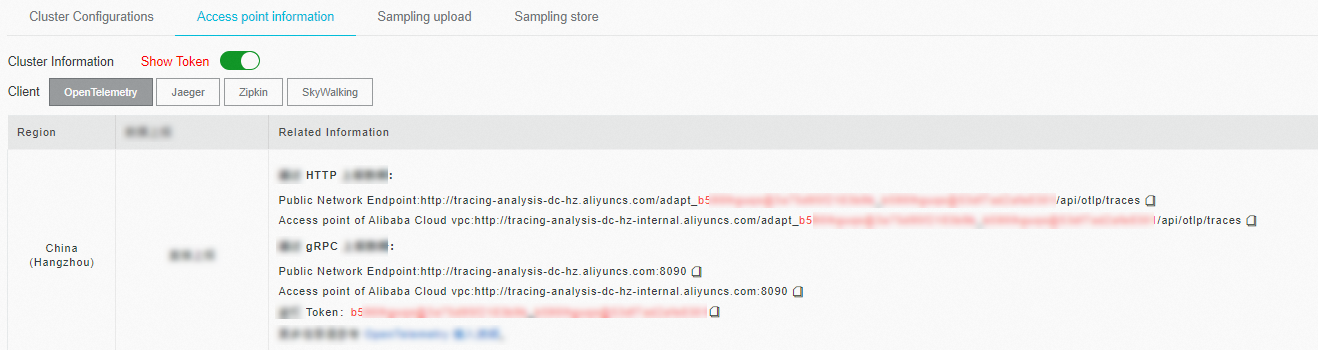
If your application runs in an Alibaba Cloud production environment, use a Virtual Private Cloud (VPC) endpoint. Otherwise, use a public endpoint.
Sample code
A complete working example is available at ruby-opentelemetry-demo.
Auto-instrumentation (Rails)
Auto-instrumentation creates spans for supported libraries and frameworks automatically, with no manual span creation required.
Supported frameworks
Auto-instrumentation covers a wide range of Ruby libraries, including:
| Category | Libraries |
|---|---|
| Web frameworks | rails, rack, sinatra, grape |
| Database | active_record, mysql2, pg, mongo, trilogy, redis, dalli, lmdb |
| HTTP clients | net_http, faraday, excon, http, http_client, httpx, ethon, restclient |
| Job queues | sidekiq, delayed_job, resque, active_job, que, rake |
| Messaging | bunny, rdkafka, ruby_kafka, racecar |
| Other | aws_sdk, graphql, koala, concurrent_ruby, active_support, action_pack, action_view, active_model_serializers, gruf, rspec |
For the full list, see the OpenTelemetry Ruby contrib repository.
Step 1: Create a Rails project
Skip this step if you already have a Rails application.
gem install rails
rails new <your-project-name>
cd <your-project-name>
Replace <your-project-name> with your application name, for example rails new otel-demo.
If you see the error Rails is not currently installed on this system, close and reopen your terminal, then run the command again.Step 2: Add OpenTelemetry gems
Add these lines to your project's Gemfile:
gem 'opentelemetry-sdk'
gem 'opentelemetry-exporter-otlp'
gem 'opentelemetry-instrumentation-all'
Then install the dependencies:
gem install bundler   # skip if Bundler is already installed
bundle install
Step 3: Configure the OpenTelemetry SDK
Create config/initializers/opentelemetry.rb:
# config/initializers/opentelemetry.rb
require 'opentelemetry/sdk'
require 'opentelemetry/exporter/otlp'
require 'opentelemetry/instrumentation/all'

OpenTelemetry::SDK.configure do |c|
  c.add_span_processor(
    OpenTelemetry::SDK::Trace::Export::BatchSpanProcessor.new(
      OpenTelemetry::Exporter::OTLP::Exporter.new(
        endpoint: '<endpoint>' # Replace with your OpenTelemetry HTTP endpoint.
      )
    )
  )
  c.resource = OpenTelemetry::SDK::Resources::Resource.create({
    OpenTelemetry::SemanticConventions::Resource::HOST_NAME => '<your-host-name>',
  })
  c.service_name = '<your-service-name>'
  c.use_all() # Enable auto-instrumentation for all supported libraries.
end
Replace the placeholders with your actual values:
| Placeholder | Description | Example |
|---|---|---|
<endpoint> | OpenTelemetry HTTP endpoint from the prerequisites | http://tracing-analysis-dc-hz.aliyuncs.com/adapt_xxx |
<your-host-name> | Hostname of your server | my-rails-server |
<your-service-name> | Application name displayed in the ARMS console | my-rails-app |
Step 4: Start the application
rails serverExpected output:
* Puma version: 5.6.5 (ruby 2.7.2-p137) ("Birdie's Version")
*  Min threads: 5
*  Max threads: 5
*  Environment: development
*          PID: 79842
* Listening on http://127.0.0.1:3000
* Listening on http://[::1]:3000
Use Ctrl-C to stop
Step 5: Verify data reporting
Open http://127.0.0.1:3000 in a browser. If your terminal displays the following log output, trace data is being exported to Managed Service for OpenTelemetry:
Started GET "/" for 127.0.0.1 at 2023-01-01 10:00:00 +0800
Processing by Rails::WelcomeController#index as HTML
  Rendering /Users/username/.rvm/gems/ruby-2.7.2/gems/railties-7.0.4.3/lib/rails/templates/rails/welcome/index.html.erb
  Rendered /Users/username/.rvm/gems/ruby-2.7.2/gems/railties-7.0.4.3/lib/rails/templates/rails/welcome/index.html.erb (Duration: 0.8ms | Allocations: 665)
Completed 200 OK in 6ms (Views: 2.1ms | ActiveRecord: 0.0ms | Allocations: 5440)
Manual instrumentation
Manual instrumentation gives full control over which operations generate spans. It works with any Ruby application, not just Rails.
Step 1: Install dependencies
Install the following OpenTelemetry dependencies:
gem install opentelemetry-api
gem install opentelemetry-sdk
gem install opentelemetry-exporter-otlp
Step 2: Initialize the SDK
Create a file (for example, manual.rb) and configure the OTLP exporter. BatchSpanProcessor buffers spans and sends them in batches for better performance:
require 'opentelemetry/sdk'
require 'opentelemetry-exporter-otlp'

OpenTelemetry::SDK.configure do |c|
  c.add_span_processor(
    OpenTelemetry::SDK::Trace::Export::BatchSpanProcessor.new(
      OpenTelemetry::Exporter::OTLP::Exporter.new(
        endpoint: '<endpoint>' # Replace with your OpenTelemetry HTTP endpoint.
      )
    )
  )
  c.resource = OpenTelemetry::SDK::Resources::Resource.create({
    OpenTelemetry::SemanticConventions::Resource::SERVICE_NAMESPACE => 'tracing',
    OpenTelemetry::SemanticConventions::Resource::SERVICE_NAME => '<your-service-name>',
    OpenTelemetry::SemanticConventions::Resource::SERVICE_VERSION => '0.0.1',
  })
end
Replace the placeholders:
| Placeholder | Description | Example |
|---|---|---|
<endpoint> | OpenTelemetry HTTP endpoint from the prerequisites | http://tracing-analysis-dc-hz.aliyuncs.com/adapt_xxx |
<your-service-name> | Application name displayed in the ARMS console | ruby_demo |
Step 3: Create spans
Get a tracer and create a span:
tracer = OpenTelemetry.tracer_provider.tracer('<your-tracer-name>', '0.1.0')

tracer.in_span('parent_span') do |parent_span|
  # Your application logic here.
end
The tracer name identifies the instrumentation library in the ARMS console. Pick a name that describes the component being traced, for example 'order-service' or 'payment-processor'.
Step 4: Add attributes and read span context
Inside a span block, add attributes and retrieve the trace ID and span ID:
tracer.in_span('parent_span') do |parent_span|
  current_span = OpenTelemetry::Trace::current_span
  current_span.set_attribute('key', 'value')
  pp current_span.context.trace_id
  pp current_span.context.span_id
end
Step 5: Create nested spans
Nest in_span calls to represent parent-child relationships between operations:
tracer.in_span('parent_span') do |parent_span|
  # Parent span logic.
  tracer.in_span('child_span') do |child_span|
    current_span = OpenTelemetry::Trace::current_span
    pp current_span  # This is the child span.
  end
end
Complete example
This example covers span creation, attributes, events, nested spans, and error handling in a single script:
require 'opentelemetry/sdk'
require 'opentelemetry-exporter-otlp'

OpenTelemetry::SDK.configure do |c|
  c.add_span_processor(
    OpenTelemetry::SDK::Trace::Export::BatchSpanProcessor.new(
      OpenTelemetry::Exporter::OTLP::Exporter.new(
        endpoint: '<endpoint>' # Replace with your OpenTelemetry HTTP endpoint.
      )
    )
  )
  c.resource = OpenTelemetry::SDK::Resources::Resource.create({
    OpenTelemetry::SemanticConventions::Resource::SERVICE_NAMESPACE => 'tracing',
    OpenTelemetry::SemanticConventions::Resource::SERVICE_NAME => 'ruby_demo',
    OpenTelemetry::SemanticConventions::Resource::SERVICE_VERSION => '0.0.1',
  })

  # Alternatively, set the service name without the Resources API:
  # c.service_name = 'ruby_demo'
end

tracer = OpenTelemetry.tracer_provider.tracer('instrumentation_library_name', '0.1.0')

tracer.in_span('parent_span') do |parent_span|
  # Set span attributes.
  parent_span.set_attribute('language', 'ruby')
  parent_span.set_attribute("attribute_key", ["attribute_value1", "attribute_value1", "attribute_value1"])

  # Add a span event.
  parent_span.add_event("event", attributes: {
    "pid" => 1234,
    "signal" => "SIGHUP"
  })

  # Read the trace ID and span ID.
  current_span = OpenTelemetry::Trace::current_span
  pp current_span.context.trace_id
  pp current_span.context.span_id

  tracer.in_span('child_span') do |child_span|
    child_span.add_attributes({
      "key1" => "value1",
      "key2" => "value2"
    })

    child_span.add_event("mock exception here")

    begin
      raise 'An error has occurred'
    rescue
      # Mark the span as errored.
      child_span.status = OpenTelemetry::Trace::Status.error("error in child span")
    end

    pp child_span
  end
end

sleep 10
Run the application:
ruby manual.rbView trace data in the ARMS console
Log on to the ARMS console.
In the left-side navigation pane, choose Application Monitoring > Applications.
On the Applications page, click the name of your application to view its trace data.
If theicon appears in the Language column, the application is connected through Application Monitoring. If a hyphen (-) appears, the application is connected through Managed Service for OpenTelemetry.