Use the skywalking-rust SDK to manually instrument your Rust application and report trace data to Managed Service for OpenTelemetry. You must use skywalking-rust to manually add spans to your code to capture distributed traces.
How it works
The skywalking-rust SDK is the official Rust agent for Apache SkyWalking, a popular Application Performance Monitoring (APM) service developed in China. SkyWalking is designed for microservices, cloud-native, and containerized applications in Docker, Kubernetes, and Mesos, and is also a distributed tracing system. The SDK connects to Managed Service for OpenTelemetry through the gRPC protocol and reports trace data from your application.
Prerequisites
Before you begin, make sure that you have:
A Rust toolchain (rustc and Cargo)
The Protobuf compiler:
macOS
brew install protobufDebian/Ubuntu
sudo apt install protobuf-compilerA SkyWalking endpoint and authentication token from Managed Service for OpenTelemetry (see Get your SkyWalking endpoint)
Get your SkyWalking endpoint
Log on to the Managed Service for OpenTelemetry console.
In the left-side navigation pane, click Cluster Configurations. Then, click the Access point information tab.
In the top navigation bar, select a region. In the Cluster Information section, turn on Show Token.
In the Client section, click SkyWalking.
Copy the endpoint from the Related Information column.
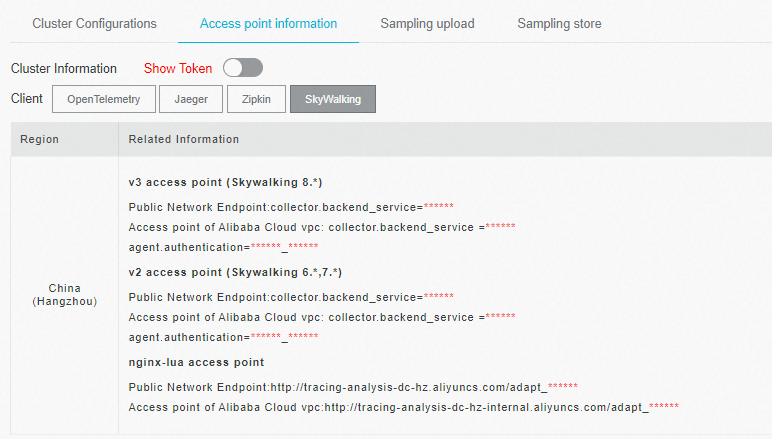
If your application runs in an Alibaba Cloud production environment, use a VPC endpoint. Otherwise, use a public endpoint.
Instrument a Rust application
The following steps use skywalking-rust 0.8.0.
Step 1: Add the SkyWalking dependency
Add the dependency to your Cargo.toml:
[dependencies]
skywalking = { version = "0.8.0", features = ["vendored"] }
Alternatively, run the following command:
cargo add skywalking --features vendoredStep 2: Import the SkyWalking modules
Add the following import to the source file you want to instrument:
use skywalking::{reporter::grpc::GrpcReporter, trace::tracer::Tracer};Step 3: Set up the gRPC reporter
Connect the reporter to your SkyWalking endpoint and authenticate with your token. Replace the placeholders with your values.
// Replace these placeholders with your values.
let endpoint = "<your-skywalking-endpoint>";
let token = "<your-authentication-token>";
let service_name = "<your-service-name>";
let instance_name = "<your-instance-name>";

let reporter = GrpcReporter::connect(endpoint).await?;
let reporter = reporter.with_authentication(token);
let tracer = Tracer::new(service_name, instance_name, reporter.clone());
Step 4: Create spans
SkyWalking uses three span types for end-to-end distributed tracing:
| Span type | Purpose | When to use |
|---|---|---|
Entry span (EntrySpan) | Captures incoming requests | On the server side, to extract trace context from an inbound request |
Local span (LocalSpan) | Captures in-process operations | For tracing logic within a single process |
Exit span (ExitSpan) | Captures outgoing requests | On the client side, to inject trace context into an outbound request |
Client-side code (creates an exit span to propagate context):
let mut ctx = tracer.create_trace_context();
{
    // Create an exit span before making an outbound call.
    let span = ctx.create_exit_span("operation1", "remote_peer");
    // ... send the request ...
}
Server-side code (creates an entry span to receive context):
let mut ctx = tracer.create_trace_context();
{
    // Create an entry span when handling an incoming request.
    let span = ctx.create_entry_span("operation1");
    // ... process the request ...
}
Step 5: Rebuild and restart your application
After adding instrumentation, rebuild and restart your application:
cargo build --releaseTrace data begins flowing to Managed Service for OpenTelemetry once the application handles requests.
Sample code
For a complete working example that uses the hyper framework to build an HTTP server with SkyWalking instrumentation, see skywalking-demo on GitHub.
Troubleshooting
Build fails with a Protobuf-related error
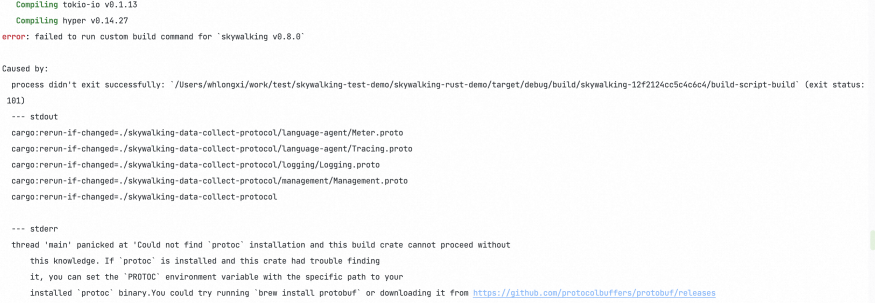
Cause: The Protobuf compiler is not installed or not on your PATH.
Solution: Install Protobuf as described in Prerequisites, then retry the build.