By Liu Zhongwei (Moyuan), an Alibaba technical expert
Monitoring and logging are important infrastructural components of large distributed systems. Monitoring allows developers to check the running status of a system, whereas logging helps troubleshoot and diagnose problems.
In Kubernetes, monitoring and logging are part of the ecosystem, but not core components. Therefore, both capabilities need to be adapted by upper-layer cloud vendors for application in most cases. Kubernetes defines access standards and specifications for APIs, which enables quick integration with any component that complies with the API standards.
Kubernetes provides four types of monitoring services.
1) Resource Monitoring
Common resource metrics such as the CPU, memory, and network usages are usually collected in digits and percentages. This is the most common monitoring service. This service is available in conventional monitoring systems such as Zabbix Telegraph.
2) Performance Monitoring
Performance monitoring refers to application performance management (APM) monitoring, in which common application performance metrics are checked. Generally, some hook mechanisms are called implicitly at the virtual machine layer or the bytecode execution layer or are injected explicitly at the application layer, to obtain advanced metrics. These advanced metrics are usually used to optimize and diagnose applications. In some common implementations such as Zend Engine for Java virtual machines (JVMs) or PHP. Hypertext Preprocessors (PHPs), common hook mechanisms are used to collect metrics such as the number of garbage collections (GCs) in a JVM, the distribution of different generations of memories, and the number of network connections. These metrics are used to diagnose and optimize application performance.
3) Security Monitoring
Security monitoring is mainly to exercise a series of security monitoring policies, for example, to manage unauthorized access and scan for security vulnerabilities.
4) Event Monitoring
Event monitoring is a special monitoring service in Kubernetes. According to the previous article, the state transition based on the state machine is one of the design concepts of Kubernetes. To be specific, if the state machine transits from a normal state to another normal state, a normal event occurs, and if the state machine transits from a normal state to an abnormal state, a warning event occurs. Between them, warning events are usually important. Event monitoring is to cache normal events or warning events to a data center, which then analyzes the events and generates alerts to expose the corresponding exceptions through DingTalk messages, SMS messages, or emails. This monitoring service overcomes some defects and drawbacks of conventional monitoring.
In earlier Kubernetes versions prior to version 1.10, analysts collect metrics by using components such as Heapster. The design philosophy of Heapster is actually very simple.
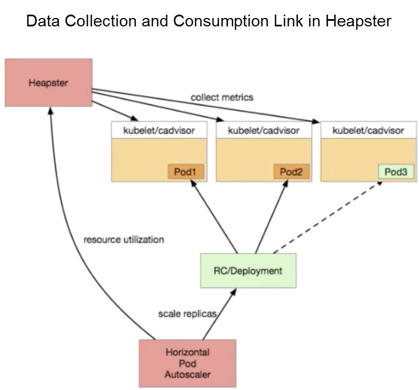
First, a packaged cAdvisor component is provided at the top of each Kubernetes to collect data. After cAdvisor completes the data collection, Kubernetes packages the data and exposes the data as a corresponding API. At the early stage, three APIs are provided:
All these APIs correspond to data sources from cAdvisor, except that the data formats are different. Heapster supports Summary and Kubelet APIs. Heapster regularly pulls data from each node, aggregates the data in its memory, and exposes the corresponding service to upper-layer consumers. In Kubernetes, common consumers such as the dashboard or the horizontal pod autoscaler (HPA) controller call the corresponding service to obtain monitoring data, and then implement required auto-scaling and display the monitoring data.
This is the data consumption link used in the early days, which seems unambiguous without many problems. Then, why did Kubernetes turn from Heapster to metrics-server? Actually, a major reason is that Heapster standardizes monitoring data APIs. Then, why did Heapster standardize the monitoring data APIs?
However, the community found that these sinks were usually left unmaintained. As a result, numerous bugs resided in the entire Heapster project and remained in the community, but never got fixed by anyone. This greatly challenges the activity and stability of the community's projects.
For both reasons, Kubernetes broke Heapster and then made metrics-server, a streamlined metrics collection component.
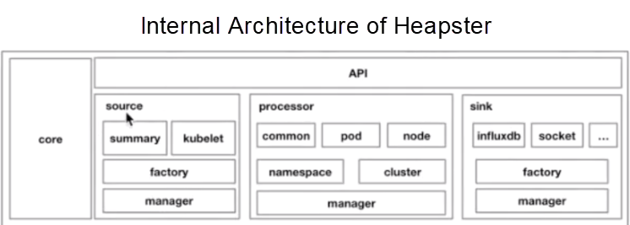
The preceding figure shows the internal architecture of Heapster. As shown in the figure, Heapster is divided into several parts. The first part is the core. The upper part is an API exposed through standard HTTP or HTTPS. The source section in the middle is equivalent to different APIs for exposing the collected data. The processor part in the middle is used for data conversion and aggregation. The last part is the sinks, which are responsible for data caching. This is the early-stage application architecture of Heapster. At the later stage, Kubernetes standardized monitoring APIs and gradually cropped Heapster into metrics-server.
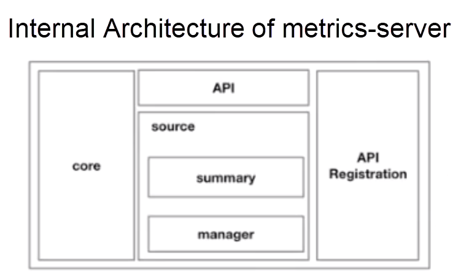
Currently, the structure of metrics-server 0.3.1 is similar to that shown in the preceding figure, which is very simple. It includes a core layer, a source layer, a simple API layer, and an additional API registration layer. The additional API registration layer allows you to register corresponding data APIs with the API server of Kubernetes. In the future, to use metrics-server, customers no longer need to access the API layer but can access the API registration layer instead by using the API server. In this case, the actual data consumer may not perceive metrics-server, but may instead perceive a specific implementation of such an API, in which case the implementation is metrics-server. This is the biggest difference between Heapster and metrics-server.
Kubernetes provides three API standards for the monitoring service. Specifically, it standardizes and decouples the monitoring data consumption capabilities, and then integrates the capabilities with the community. In the community, the APIs are classified into three types.
Type 1) Resource Metrics
The corresponding API is metrics.k8s.io and its main implementation is metrics-server. This API provides resources metrics commonly at the node level, the pod level, the namespace level, and the class level. Obtain this type of metrics through the metrics.k8s.io API.
Type 2) Custom Metrics
The corresponding API is custom.metrics.k8s.io and its main implementation is Prometheus. It provides resource metrics and custom metrics. These metrics actually overlap the preceding resource metrics. The custom metrics are user-defined, for example, the number of online users that is to be exposed within an application or slow query that is to be called in MySQL of the following database. Such metrics are defined by customers at the application layer and are then exposed by the Prometheus client and collected by Prometheus.
The data collected through this type of API is consumed in the same way as the data collected through the custom.metrics.k8s.io API. In other words, if you access Prometheus in this way, you can implement horizontal pod auto-scaling through the custom.metrics.k8s.io API, to consume the data.
Type 3) External Metrics
The external metrics API is actually very special. As we all know, Kubernetes has become an implementation standard for cloud-native APIs. In most cases, only cloud services are used on the cloud. For example, an application uses message queues in the front end and the remote BLOB storage (RBS) database in the back end. Sometimes, the metrics of some cloud products are also consumed during data consumption. These metrics include the number of messages in a message queue, the number of connections to the server load balancer (SLB) at the access layer, and the number of 200 requests at the upper layer of SLB.
Then, how do you consume these metrics? To consume these metrics, we have also implemented a standard in Kubernetes, which is external.metrics.k8s.io. This standard is mainly implemented by cloud providers. The providers obtain cloud resource metrics through this API. In Alibaba Cloud, we have also provided an Alibaba cloud metrics adapter to implement the external.metrics.k8s.io API.
Now let's introduce Prometheus, a common monitoring solution in the open-source community. Why has Prometheus become a monitoring standard for the open-source community?
Next, let's see the overall architecture of Prometheus.
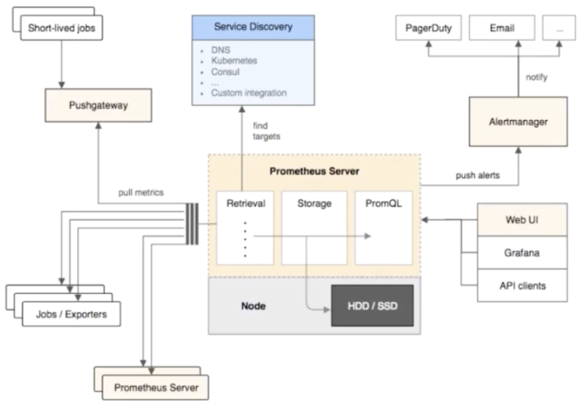
The preceding figure shows the data collection links in Prometheus, which is classified into three data collection models.
These are the three data collection methods in Prometheus. For data sources, Prometheus scrapes data sources through service discovery as well as standard static configuration. To be specific, Prometheus dynamically discovers collection targets by using certain service discovery mechanisms. In Kubernetes, commonly, with this dynamic discovery mechanism, you only need to configure some annotations, so that the system automatically configures collection tasks to collect data, which is very convenient.
In addition, Prometheus provides an external component called Alertmanager, which sends alerts through emails or SMS messages. Prometheus also provides upper-layer API clients, web UI, and Grafana to display and consume the data.
In summary, Prometheus has the following features:
Finally, let's have a look at Kube-eventer, the event caching tool in Kubernetes. The Kube-eventer component is an open-source component of Alibaba Cloud Container Service. In Kubernetes, it caches eventers of components such as pods, nodes, core components, and custom resource definitions (CRDs). With the watch mechanism of the API server, Kube-eventer caches the eventers to applications such as SLS, DingTalk, Kafka, and InfluxDB, and then performs auditing, monitoring, and alerting for a period of time. Currently, we have opened-source this project on GitHub. If you are interested, visit GitHub to learn about this project.
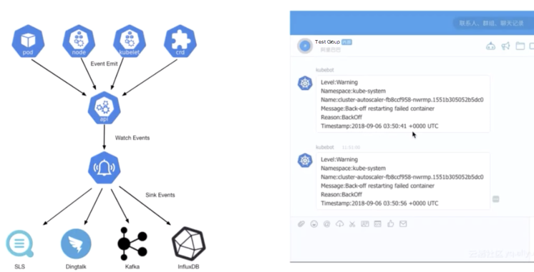
The preceding figure shows a snapshot of an alert on DingTalk. As shown in the figure, the warning event is generated for the Kube-system namespace, and the cause is that the pod failed to restart due to backoff. The specific time when the failure occurred is also displayed. Perform check-ups based on this information.
Next, let's see the logging service in Kubernetes. In Kubernetes, logging is provided mainly for four scenarios.
Some logs of Docker are common runtime logs. They allow troubleshooting problems such as the hang-up of pod deletion.
Core components in Kubernetes include external middleware such as etcd, or internal components such as the API server, kube-scheduler, controller-manager, and kubelet. With the logs of these components, learn about the resource usage at the control plane of the entire Kubernetes cluster and whether exceptions occur in the current running state.
In addition, some core middleware such as the network middleware ingress allows you to view the traffic of the entire access layer. With the logs of ingress, conduct an in-depth application analysis of the access layer.
Logs of deployed applications allow viewing the status of the service layer. For example, with application logs, determine whether a 500 request for the service layer exists, whether a panic occurs, and whether any abnormal or incorrect access occurs.
Now, let's take a look at the log collection. Generally, to collect logs from different locations, Kubernetes provides three major log collection methods.

The community recommends the Fluentd collection solution. In Fluentd, an agent is elected in each node, and then the agent aggregates data to a Fluentd server. This server can cache data to a corresponding component such as Elasticsearch, and then Kibana displays the data. Alternatively, the server caches data to InfluxDB, and then Grafana displays the data. This is a recommended practice in the community.
Finally, let's conclude today's course and see the best practices of monitoring and logging in Alibaba Cloud. As mentioned at the beginning of the course, monitoring and logging are not core components in Kubernetes. Kubernetes defines API standards to support most monitoring and logging capabilities, which are then separately adapted by cloud vendors at the upper layer.
First, let's see the monitoring system in Alibaba Cloud Container Service. This figure shows the overall architecture of the monitoring system.
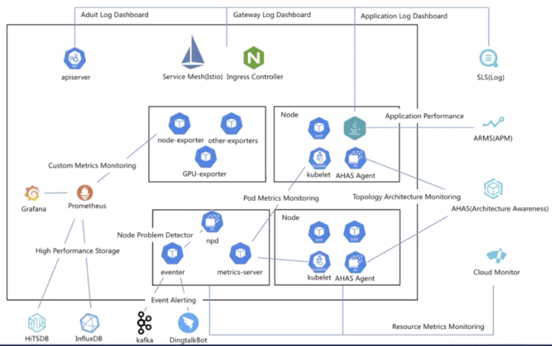
The four products on the right are closely related to monitoring and logging services.
SLS is a log service. As mentioned earlier, logs are collected in different ways based on collection locations in Kubernetes. For example, logs of core components, logs of the access layer, and logs of applications are each collected differently. Similarly, in Alibaba Cloud Container Service, audit logs can be collected through the API server, logs of the access layer can be collected through the service mesh or ingress controller, and logs of applications can be collected through the application layer.
However, this data link is insufficient to meet our demands. It only helps us cache data, but we further need to display and analyze the upper-layer data. SLS perfectly meets the demands. For example, audit logs allow us to check the number of operations, the number of changes, the number of attacks, and whether a system exception occurs in the current day. These results are all visible on the audit dashboard.
This product is about performance monitoring on applications. You can perform performance monitoring through products such as Application Real-Time Monitoring Service (ARMS). Currently, ARMS supports the Java and PHP languages and can diagnose and tune application performance.
This product named Application High Availability Service (AHAS) is special. AHAS is a system with automatic architecture discovery ability. As we know, Kubernetes components are usually deployed according to the microservice architecture. The microservice architecture results in a growing number of components and component replicas. This makes topology management more complex.
Actually, without sufficient visibility, it is difficult to view the traffic flow of an application in Kubernetes or troubleshoot traffic exceptions. AHAS is designed to present the entire application topology in Kubernetes by monitoring the network stack. Based on the topology, AHAS monitors resources, network bandwidth, and traffic, and diagnoses exception events. AHAS also allows you to implement another monitoring solution based on the discovered architectural topology.
Cloud Monitor implements basic cloud monitoring. It collects standard resource metrics to display monitoring data. In addition, it displays and issues alerts against the metrics of components, such as the nodes and pods.
This section describes the enhancements of open-source features made by Alibaba Cloud. First, as described at the beginning of this article, metrics-server is greatly streamlined. However, from the perspective of customers, this streamlining is actually implemented by cropping some features, which causes a lot of inconveniences. For example, many customers want to cache monitoring data to sinks such as SLS or InfluxDB. However, this feature is no longer unavailable in the community version. To overcome this issue, Alibaba Cloud retains the common sinks that are frequently maintained. This is the first enhancement.
Second, the overall compatibility is enhanced. As we know, the ecosystem integrated into Kubernetes does not evolve synchronously. For example, the release of the dashboard does not match the major version of Kubernetes. In detail, when Kubernetes 1.12 is released, the dashboard is not synchronously upgraded to version 1.12 but is released at its own pace. As a result, many components that are dependent on Heapster are broken directly after Heapster is upgraded to metrics-server. To prevent this problem, Alibaba Cloud enables metrics-server to be fully compatible with Heapster. In the current Kubernetes 1.7 version to Kubernetes 1.14, Alibaba Cloud metrics-server is compatible with the data consumption of all monitoring components.
We have also enhanced the Kube-eventer and node problem detector (NPD). The enhancement of the Kube-eventer component has been described previously. Regarding the NPD, we have added many monitoring and detection metrics, such as the detection of kernel hang-up, node problems, and source network address translation (SNAT) and monitoring of inbound and outbound traffic. Other check items such as FD are also from the NPD and have been greatly enhanced by Alibaba Cloud as well. With these enhancements, developers directly deploy a check item of the NPD to generate alerts based on node diagnosis and then cache the alerts to Kafka or DingTalk through Kube-eventer.
The Prometheus ecosystem at higher layers is also enhanced. The storage layer allows developers to connect to HiTSDB and InfluxDB in Alibaba Cloud, while the collection layer provides the optimized node-exporter component and some scenario-based monitoring exporters, such as Spark, TensorFlow, and Argo. Alibaba Cloud has also made many additional enhancements on GPUs, for example, the monitoring of a single GPU and the monitoring of GPU sharing.
Regarding Prometheus, we have partnered with the ARMS team to launch a hosted version of Prometheus. Developers directly gain access to the monitoring and collection capabilities of Prometheus by using the out-of-the-box helm chats without deploying the Prometheus server.
What improvements has Alibaba Cloud made to the logging system? First, collection methods are fully compatible with all kinds of logs. The logs of pods, core components, the Docker engine, the kernel, and some middleware are all collected to SLS. Then, these logs are cached from SLS to Object Storage Service (OSS) for archiving and to MaxCompute for cache budgeting.
In addition, OpenSearch, E-Map, and Flink allow us to search for logs and consume upper-layer data in real-time. To display logs, connect to the open-source Grafana and other services such as DataV. In this way, the complete data collection and consumption link are established.
This article first introduces the monitoring service, including common monitoring methods in four container scenarios, the monitoring evolution and API standards in Kubernetes, and two monitoring solutions for common data sources. Then, describes four logging scenarios and a collection solution called Fluentd. Finally, lists the best practices of logging and monitoring in Alibaba Cloud.
Getting Started with Kubernetes | Observability: Are Your Applications Healthy?
Getting Started with Kubernetes | Kubernetes Network and Policy Control

706 posts | 57 followers
FollowAlibaba Developer - April 3, 2020
DavidZhang - April 30, 2021
DavidZhang - January 15, 2021
Alibaba Developer - August 2, 2021
Alibaba Cloud Native - March 6, 2024
Kidd Ip - October 9, 2025

706 posts | 57 followers
Follow Managed Service for Prometheus
Multi-source metrics are aggregated to monitor the status of your business and services in real time.
Learn More Container Service for Kubernetes
Alibaba Cloud Container Service for Kubernetes is a fully managed cloud container management service that supports native Kubernetes and integrates with other Alibaba Cloud products.
Learn More ACK One
Provides a control plane to allow users to manage Kubernetes clusters that run based on different infrastructure resources
Learn More Container Compute Service (ACS)
A cloud computing service that provides container compute resources that comply with the container specifications of Kubernetes
Learn MoreMore Posts by Alibaba Cloud Native Community