When users interact with an app, they may encounter the following issues:
● The screen stays black or white for a moment when a complex page is opened.
● The display of a list stutters occasionally during scrolling.
● The UI becomes sluggish when images are being loaded.
● Operations freeze when multiple network requests are sent at the same time.
These issues are not limited to low-end devices. They also happen frequently on mid-range and high-end models. When the main thread cannot respond to user interactions, the app becomes unresponsive, and prolonged stuttering severely impacts both the functionality and user experience. Stuttering issues have always been one of the biggest pain points in mobile app development.
In most cases, the primary causes of main thread blocking and stuttering include the following ones:
● Heavy UI rendering: When a screen contains deep view hierarchies or a large amount of mixed text and images, the numbers of layout calculations and drawing operations increase sharply, exceeding the processing capacity of a single refresh cycle.
● Synchronous network requests on the main thread: After synchronous network calls are triggered on the main thread, the entire app must wait for a network response before it can proceed. During this period, no user interaction can be processed.
● Extensive file I/O operations: Directly performing large-scale data reads or writes on the main thread, such as accessing databases or local files, consumes significant time due to the limited disk speed.
● Heavy-load computation: If complex algorithms or large-scale data processing workflows are running on the main thread, CPUs remain in a heavy-load state for an extended period of time, and no room is left to handle UI events.
● Improper thread lock usage: If the main thread is waiting for another thread to release a lock, it enters the pending state. If the wait duration is long, stuttering happens. In extreme cases, circular waiting between different threads can even cause a deadlock, rendering the entire app unresponsive.
Because these issues are often intermittent and environment-dependent, traditional offline debugging methods are usually ineffective. To accurately and efficiently troubleshoot these online stuttering issues, we have explored several monitoring approaches.
The following solutions are some widely used stuttering monitoring approaches in iOS development:
● Ping thread monitoring
● Frames per second (FPS) monitoring
● RunLoop-based monitoring
The ping thread monitoring solution works based on the following principles:
● A worker thread is created to "probe" the responsiveness of the main thread.
● Each time the worker thread pings the main thread, the worker thread sets a flag to YES and then dispatches a task to the main thread. The main thread clears the flag by setting it to NO.
● The worker thread sleeps for the specified period of time. After the period elapses, it checks whether the flag has been cleared. If the value of the flag is still YES, the main thread is experiencing stuttering.
The following figure shows the process.

Key steps:
The logic of this monitoring solution is relatively simple and easy to understand. However, its accuracy is limited. Detections may be missed among pings. In addition, a ping thread continuously wakes up the RunLoop of the main thread, which also introduces specific performance overhead.
Under normal conditions, the screen refreshes at a rate of 60 Hz. Newer iOS devices can even maintain a refresh rate of 120 Hz. A screen refresh signal is sent for each refresh, and CADisplayLink allows developers to register a callback that is synchronized with this signal.
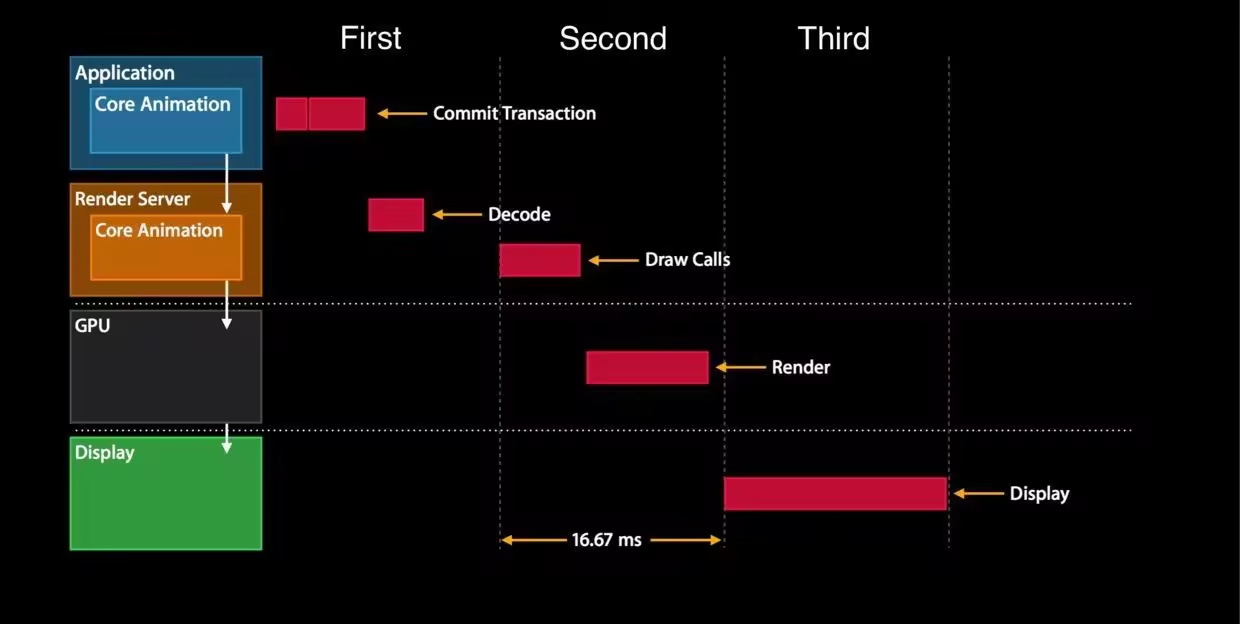
We can evaluate the UI smoothness by calculating how many times this callback is triggered within 1 second. Although CADisplayLink is lightweight, it can be invoked only when the CPU is somewhat idle. As a result, stack capturing during severe stuttering may not be timely. In addition, frame rates lower than 50 FPS still appear smooth to the human eye. Therefore, relying solely on FPS monitoring makes it difficult to determine whether stuttering has occurred.
This monitoring solution is one of the most mainstream solutions suitable for production environments. Its core idea is to observe the state changes of the RunLoop of the main thread by using CFRunLoopObserver. The following figure is a simplified explanation of the RunLoop mechanism, adapted from Dai Ming's RunLoop diagram.
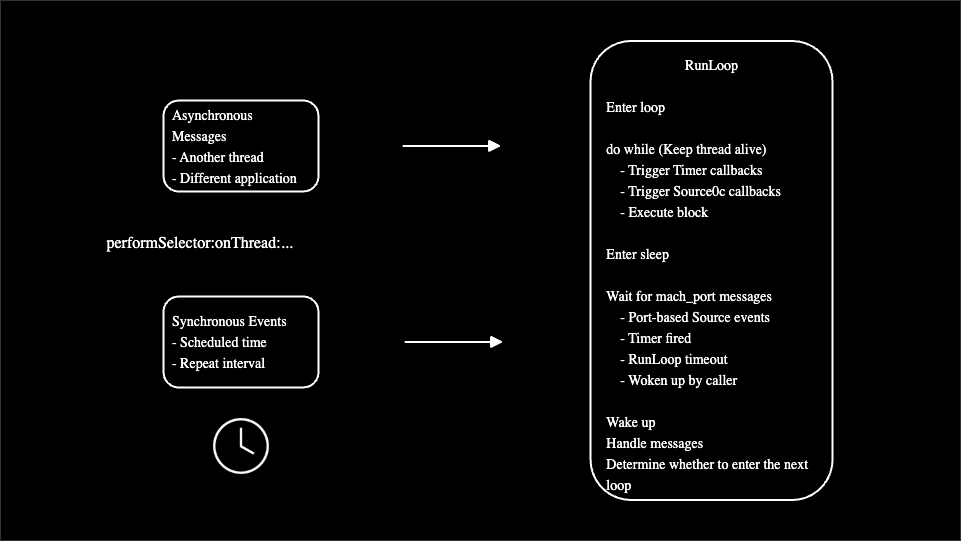
● Notify observers that the RunLoop is about to enter a loop.
● Start a do-while loop to keep the thread alive.
● Notify observers that the RunLoop is about to enter the sleeping state.
● Wait for mach_port messages to wake up the RunLoop again.
● Notify observers that the RunLoop has been awakened.
● Handle messages.
● Continue with the next loop.
In a typical RunLoop-based monitoring implementation, the following key steps are involved:
The RunLoop-based monitoring solution can accurately capture various types of stuttering caused by main thread blocking. This makes it well suited for online stuttering monitoring, diagnostics, and analysis.
The three performance monitoring solutions focus on different dimensions, as summarized in the following table.
| Comparison dimension | Ping thread monitoring | FPS monitoring | RunLoop-based monitoring |
|---|---|---|---|
| Core principle | A worker thread periodically dispatches tasks to detect the responsiveness of the main thread. | CADisplayLink is used to count the number of callbacks per unit time and calculate the FPS value. | CFRunLoopObserver is used to listen for RunLoop state changes and timeout events. |
| Monitoring accuracy | Medium: depends on probing frequency and may miss intermittent stuttering. | Low: focuses on average performance. Occasional severe stuttering may be averaged out. | High: can capture individual long blocking events. |
| Root cause analysis | Moderate: captures stacks after timeout events, but with a potential timing delay. | Weak: reflects only smoothness results and cannot locate code-level stacks. | Strong: captures the call stack of the main thread immediately after a timeout event is generated to locate the required code. |
| Performance overhead | Low: worker thread overhead plus slight main thread overhead. The overall impact is minimal. | Very low: CADisplayLink adopted, which is a lightweight, system-level mechanism. | Low: observer callbacks are lightweight, with extra processing required only during stuttering. |
| Complexity | Medium: requires thread management and timeout handling logic. | Low: simple implementation based on counts and timestamps. | High: requires a deep understanding of the RunLoop mechanism and multi-threaded synchronization. |
| Scenarios | Quickly implement basic stuttering monitoring. | Quantify UI smoothness, such as scrolling or animation optimization. | Diagnose main thread blocking, such as I/O, deadlocks, and complex computations. |
● The ping thread monitoring solution detects stuttering issues by periodically probing the response time of the main thread from a worker thread. Its accuracy is lower than that of the RunLoop-based monitoring solution.
● The FPS monitoring solution serves as a global performance metric, reflecting app smoothness by using frame rate fluctuations. However, it cannot pinpoint specific performance bottlenecks.
● The RunLoop-based monitoring solution involves the event loop mechanism of the main thread, which captures individual blocking events within milliseconds and precisely identify the stuttering sources of the main thread.
The core goal of a stuttering monitoring solution is to accurately capture and pinpoint blocking-type stuttering issues that interrupt user interactions and significantly degrade user experience. When stuttering occurs, it is not enough to simply detect the event itself. The monitoring solution must also trace execution paths down to the code line level to identify the root cause.
Compared with other mainstream solutions, the RunLoop-based monitoring solution continuously tracks the task duration on the main thread. The solution can precisely capture stuttering events while simultaneously collecting the complete contextual call stack. Although the implementation of the solution is relatively complex, its suitability for production environments and its strong diagnostics value in identifying root causes make it the ultimate solution.
The basic principles of RunLoop have been introduced earlier. The following sections focus on how to implement this solution.
To implement the RunLoop-based stuttering monitoring solution, the first step is to monitor RunLoop state changes. As shown in the following figure, by registering an observer, you can listen for state change events in the RunLoop of the main thread. The associated state and timestamp information is recorded by using the running and startTime variables. The monitoring thread then reads the values of running and startTime to determine whether a state change has exceeded the expected time threshold.
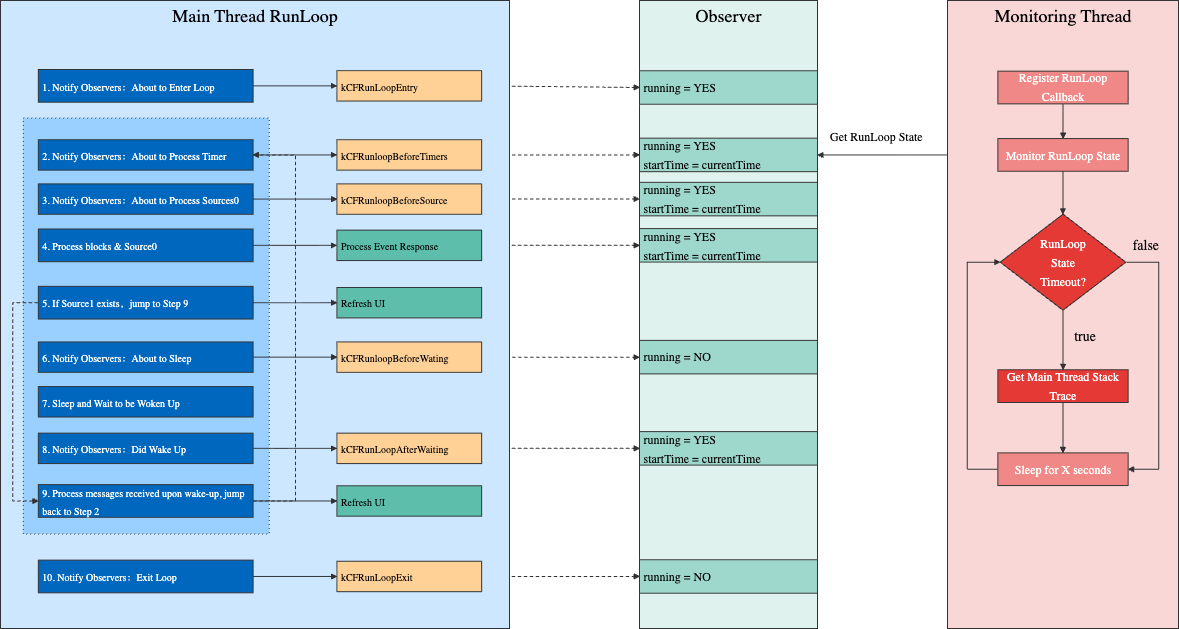
When the main thread takes an extended period of time to run a task, RunLoop state changes are delayed. By measuring the time difference between key RunLoop states from a backend monitoring thread, you can determine whether the main thread is blocked.
In this implementation:
● When the observer receives a kCFRunloopBeforeTimers, kCFRunloopBeforeSource, or kCFRunLoopAfterWaiting notification, the observer sets the value of running to YES and records the current timestamp in startTime.
● When the observer receives a kCFRunloopBeforeWaiting or kCFRunLoopExit notification, the observer sets the value of running to NO.
● The monitoring thread continuously reads the values of running and startTime, and determines whether a stuttering issue has occurred by comparing the current time with the value of startTime, as shown in the following figure.
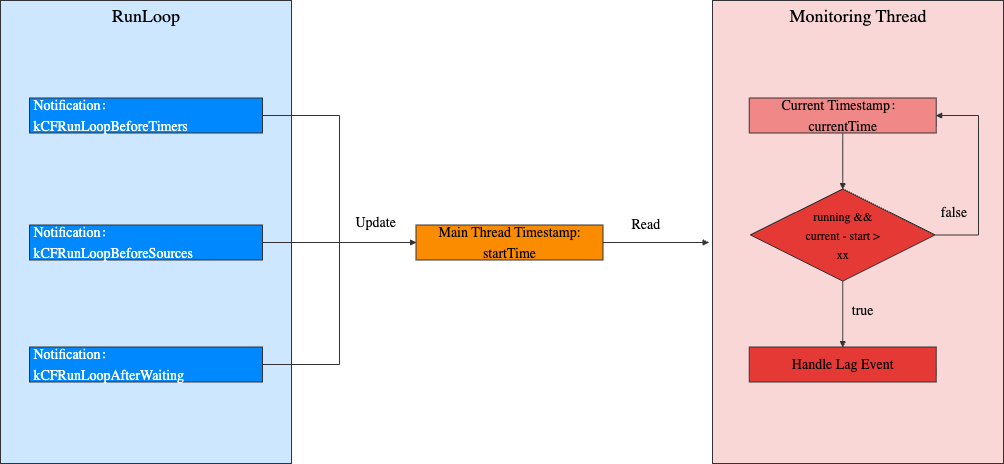
When a RunLoop state change timeout is detected, that is, when a stuttering issue is identified, the call stack of the main thread needs to be captured and stored in memory. Stack capturing is based on the well-known open source implementation KSCrash. Compared with using system functions to retrieve call stacks, KSCrash-based stack capturing supports symbolication based on dSYM files. This allows issues to be traced back to specific code lines, and the performance overhead is relatively low.
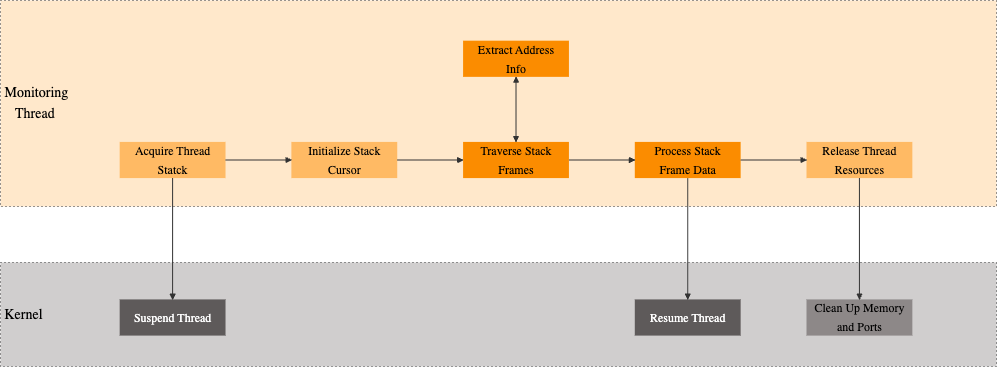
When the monitoring thread observes the RunLoop of the main thread, it captures a snapshot of the main thread as the stuttering stack. However, this snapshot is not necessarily the most time-consuming stack, nor is it always the primary cause of the main thread timeout. To improve capturing accuracy, if stuttering is detected on the main thread, the system retrospectively analyzes the stacks stored in a circular buffer, which samples data once every 50 ms, to identify the most time-consuming stack in the recent time window.
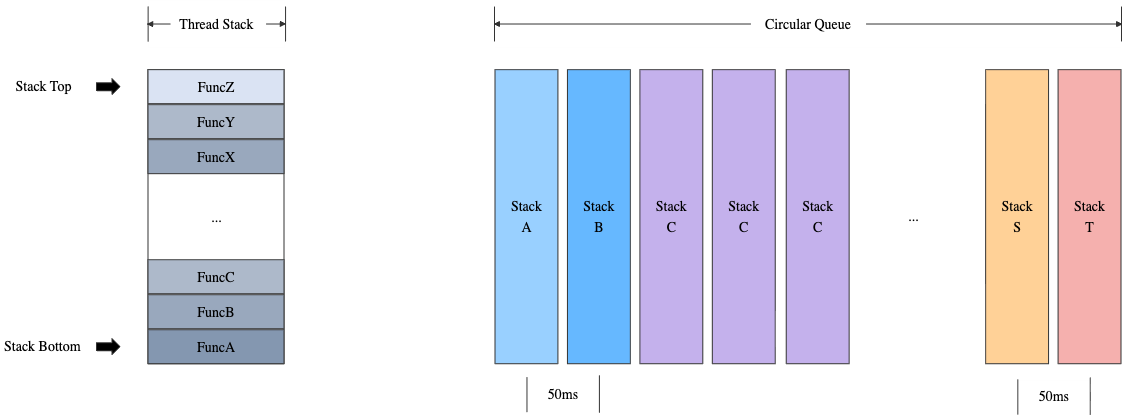
As shown in the preceding figure, the most time-consuming stack is identified based on the following characteristics:
● The top function in a call stack is used as a distinguishing characteristic. If two stacks share the same top function, they are considered the same stack. Example:
● Because stacks are captured at fixed intervals, the number of times a stack appears can be used as an approximate metric of the stack execution duration. The more repetitions, the longer the execution duration. Example:
● If multiple stacks have the same number of repetitions, the most recent one is selected as the most time-consuming stack.
In normal scenarios without exceptions, the stuttering detection mechanism introduces negligible overhead. However, if a stuttering issue lasts for several seconds, significant performance degradation occurs when the stack information of the main thread is frequently captured. Repeated recording of identical stack information provides little analytical value and is unnecessary. To reduce the performance overhead introduced by stuttering monitoring, the SDK adopts an annealing algorithm that gradually increases the detection interval. This avoids secondary performance issues caused by the repeated capturing of the same stuttering issue.

● Each time the monitoring thread detects a stuttering issue on the main thread, it captures the call stack of the main thread and stores it in memory.
● The captured stack is compared with the stack obtained from the previous stuttering issue.
This algorithm prevents the same stuttering issue from being written to multiple files and avoids the continuous dumping of thread snapshots by the monitoring thread when the main thread is frozen.
The primary principle of any monitoring tool is that it cannot affect the performance of monitored objects. Therefore, it is necessary to measure the actual performance impact of the RunLoop-based stuttering monitoring solution. The core approach is A/B testing. In such testing, two app versions that are almost identical are prepared:
● Version A (baseline version): Stuttering monitoring is disabled.
● Version B (monitored version): Stuttering monitoring is enabled.
Both versions are tested on the same device and under the same conditions, with the same operations performed on them. The difference in key performance metrics is measured, which represents the performance overhead introduced by stuttering monitoring.
When stuttering monitoring is disabled, let the app run for a period of time and then manually trigger stuttering. In this case, the overall CPU utilization of the app is shown in the following figure.

When stuttering monitoring is enabled, let the app run for a period of time and then manually trigger stuttering. In this case, the overall CPU utilization of the app is shown in the following figure.

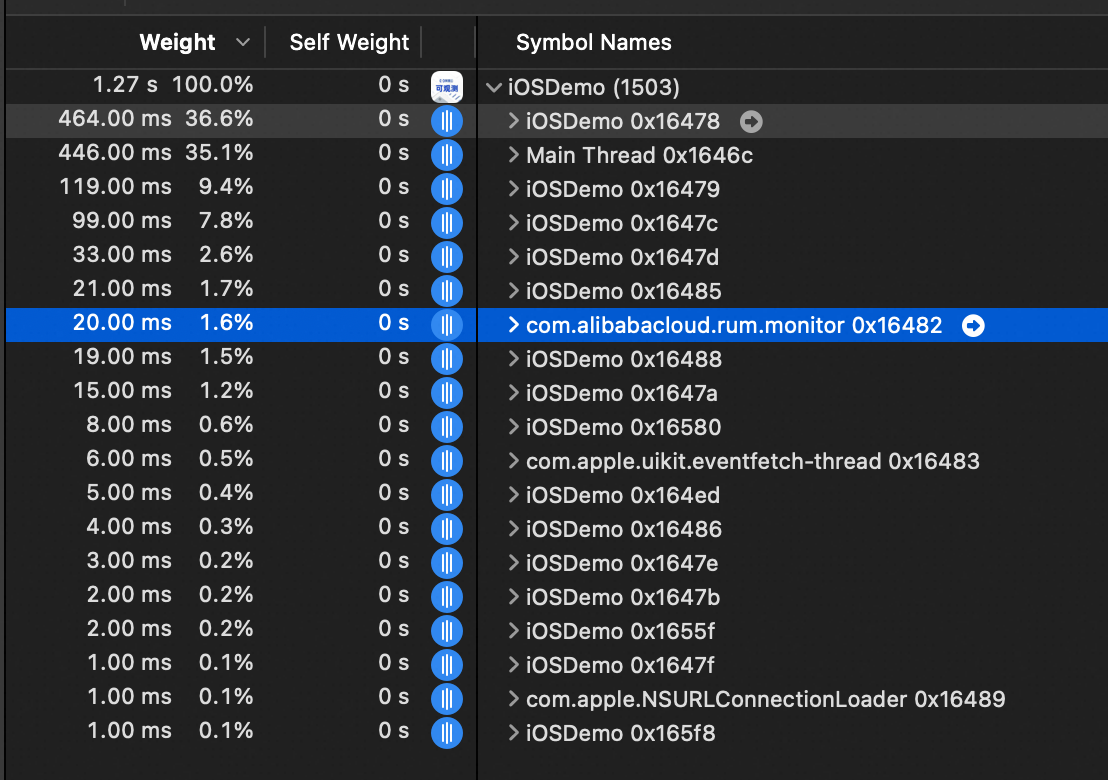
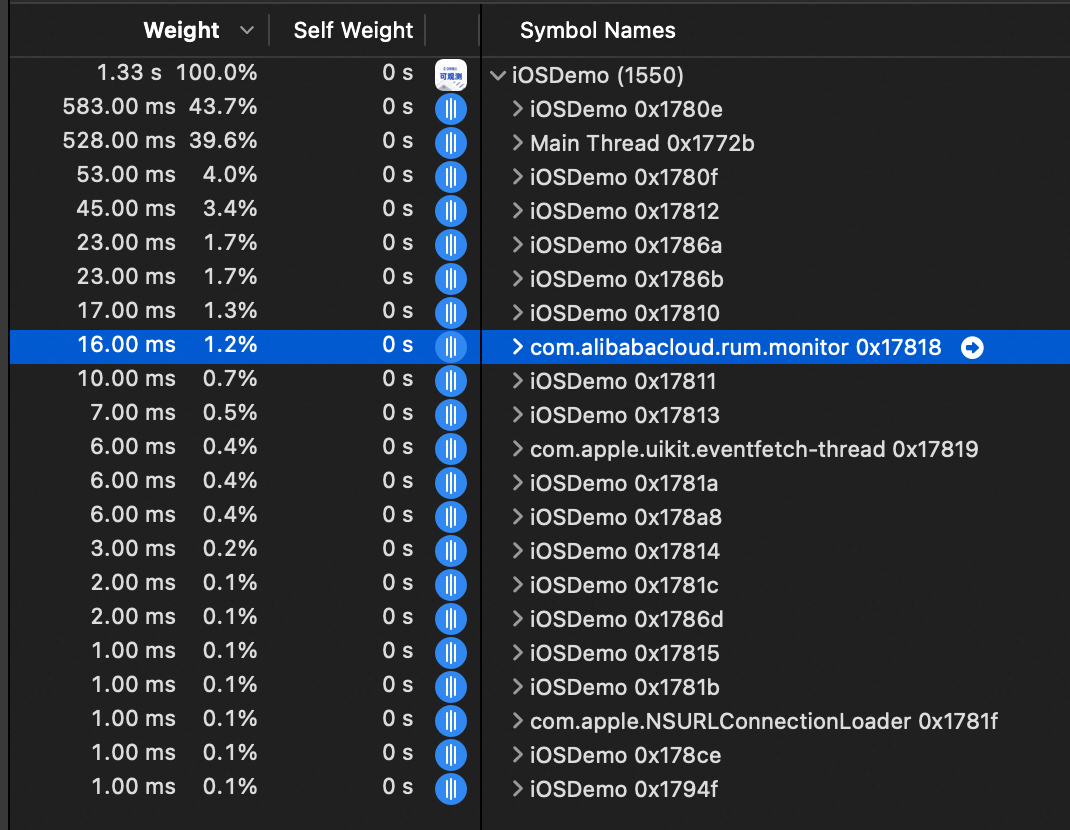
With stuttering monitoring enabled, the CPU utilization of the monitoring thread is shown in the following figures.
When stuttering occurs
When no stuttering occurs
Based on the preceding analysis, after stuttering monitoring is introduced into the app:
● When no stuttering occurs, the impact on the performance of the app is almost negligible.
● When stuttering occurs, the overall CPU utilization of the app increases by approximately 0.33%. The actual values may vary slightly based on devices.
This article introduces the mainstream stuttering monitoring solutions in iOS and provides a detailed explanation of a RunLoop-based stuttering monitoring implementation, which includes RunLoop state change monitoring, stack capturing, time-consuming stack capturing, and the annealing algorithm for sustained stuttering scenarios. By integrating mature and proven industry implementations, the adopted solution accurately detects the blocking and stuttering of the main thread. Stuttering monitoring continues to evolve, with several improvements that can be made in the future, such as the detection of stuttering caused by high CPU utilization and app startup stuttering. This solution has already been applied in the Real User Monitoring (RUM) SDK for iOS of Application Real-Time Monitoring Service (ARMS).
Practical Guide: Deploying an MCP Gateway On‑Premises with Higress and Nacos

681 posts | 56 followers
FollowAlibaba Cloud Community - September 10, 2025
Apache Flink Community - September 5, 2025
Lee Li - January 19, 2021
Alibaba Cloud Native Community - November 20, 2025
Alibaba Clouder - March 29, 2021
JDP - March 11, 2022

681 posts | 56 followers
Follow Application Real-Time Monitoring Service
Build business monitoring capabilities with real time response based on frontend monitoring, application monitoring, and custom business monitoring capabilities
Learn More Real-Time Livestreaming Solutions
Stream sports and events on the Internet smoothly to worldwide audiences concurrently
Learn More Managed Service for Prometheus
Multi-source metrics are aggregated to monitor the status of your business and services in real time.
Learn More CloudMonitor
Automate performance monitoring of all your web resources and applications in real-time
Learn MoreMore Posts by Alibaba Cloud Native Community