I was honored to attend the meetup of the cloud-native community in Beijing and had the opportunity to discuss cloud-native technologies and applications with experts in the industry. In this meetup, I talked about the topic of observability in cloud-native. This article is mainly a literal summary of my presentation, and I welcome all readers to leave a message for discussion.
Observability originated from the field of electrical engineering. The main reason is that with the development and complexity of the system, a mechanism must be set up to understand the internal operation status of the system in order to better monitor and repair problems. For this reason, engineers have designed a number of sensors and dashboards to demonstrate the internal status of the system.
If a system is said to be observable, for any possible evolution of state and control vectors the current state can be estimated using only the information from outputs.
Electrical engineering has been developed for hundreds of years, in which observability in various sub-fields is being improved and upgraded. For example, vehicles (cars/planes, etc.) are also the masters of observability. Regardless of the super project of the plane, there are hundreds of sensors inside a small car to detect various states inside and outside the car, so that the car can be stable, comfortable, and safe.
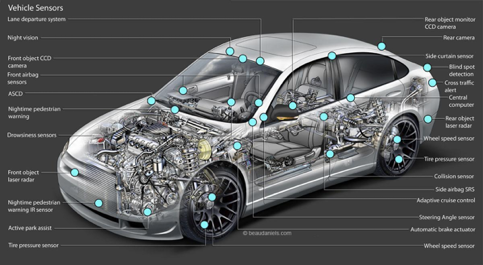
With the development of more than a hundred years, observability under the electrical engineering has not only been used to assist people to check and locate problems. In terms of automobile engineering, the entire observability development has gone through several processes:
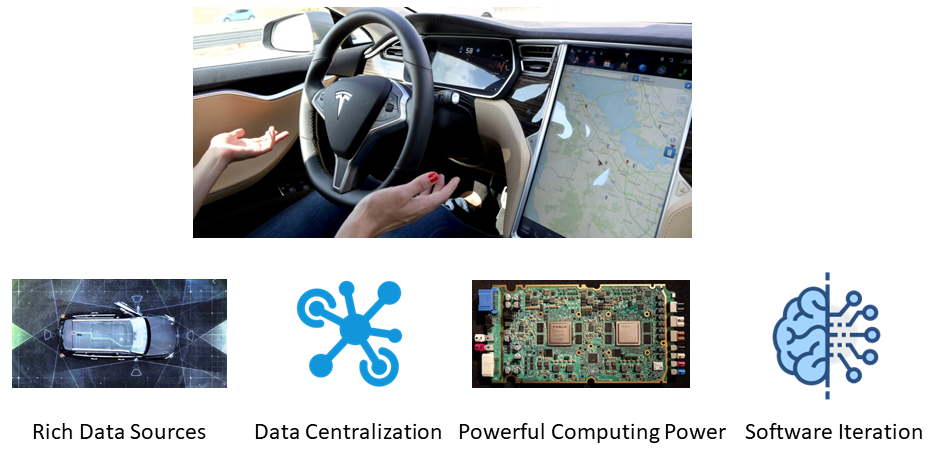
As the peak of observability of electrical engineering, autonomous driving gives the best play to all kinds of internal and external data obtained by automobiles. To sum up, it mainly has several core elements:
With decades of development, the monitoring and troubleshooting methods in IT systems have also been gradually used for observable engineering. At that time, the most popular method was to use a combination of Metrics, Logging, and Tracing.

The preceding figure may already be very familiar to you. It is excerpted from a blog post published by Peter Bourgon after he attended the 2017 Distributed Tracing Summit. This figure briefly introduces the definitions and relationships of Metrics, Tracing and Logging. Each of the three types of data plays a role in observability, and each kind of data can not be completely replaced by other data.
The following shows a typical troubleshooting process described in Grafana Loki.
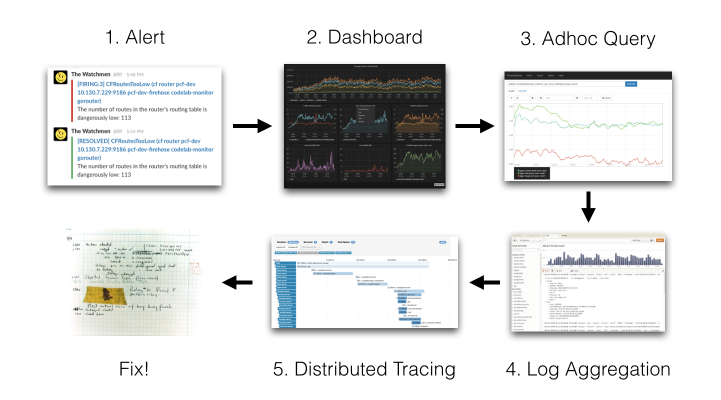
The preceding example illustrates how to use Metrics, Tracing, and Logging for joint troubleshooting. Different combination solutions can be used in different scenarios. For example, a simple system can directly trigger alerts based on error messages from Logging and locate problems. It can also trigger alerts based on Metrics (latency and error code) extracted from Tracing. But on the whole, a system with good observability must have the above three types of data.
What cloud native brings is not only the ability to deploy applications on the cloud, but also the upgrading of a new IT system architecture, including development models, system architecture, deployment models, and the evolution and iteration of the infrastructure suite.
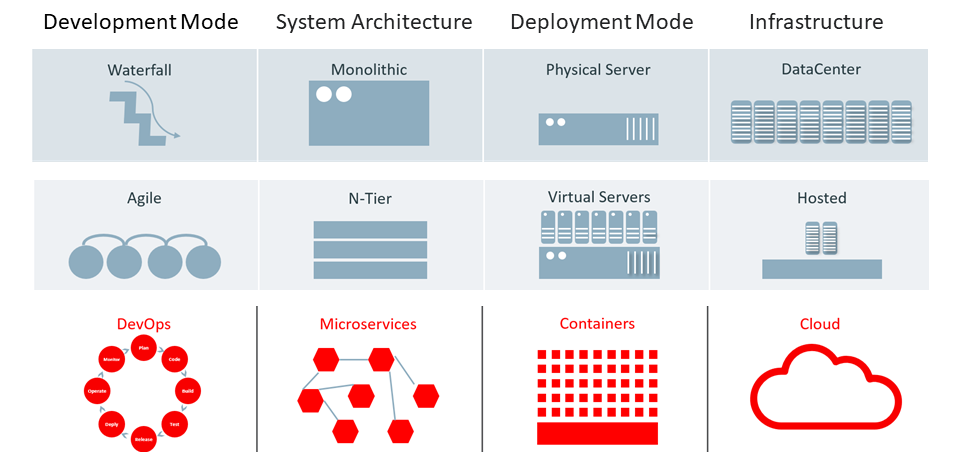
Many readers will have a deep understanding of the preceding problems. The industry has also withdrawn various observability-related products, including many open-source and commercial projects. For example:
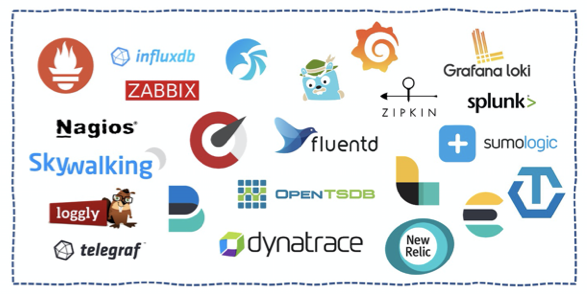
A combination of these projects can solve one or several specific problems, but when these projects are applied, you will find various problems:

In this context, the OpenTelemetry project was born under the Cloud Native Computing Foundation (CNCF). It aims to unify Logging, Tracing, and Metrics to achieve data interoperability.
Create and collect telemetry data from your services and software, then forward them to a variety of analysis tools.
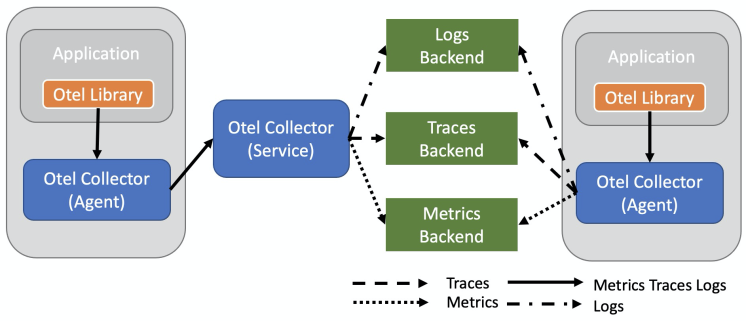
The core function of OpenTelemetry is to generate and collect observability data, which can be transferred to various analysis softwares. The following figure shows the architecture. The Library is used to generate observability data in a unified format, and the Collector is used to receive the data and transmit the data to various backend systems.
The revolutionary progress that OpenTelemetry has brought to the cloud-native, includes:
From the above analysis, you can see that the orientation of OpenTelemetry is the infrastructure for observability and the solution for data specification and acquisition problems. Subsequent implementations rely on vendors. Of course, the best way is to have a unified engine to store all Metrics, Logging, and Tracing, and a unified platform to analyze, display, and correlate these data. Currently, no vendor can well support the unified backend of OpenTelemetry. However, we still need to use the products of each vendor to implement OpenTelemetry. Another problem brought by this is that the association of various data is more complex, and the data association between each vendor needs to be dealt with. This problem will definitely be solved in one to two years. Now, many vendors are trying to implement a unified solution for all types of data in OpenTelemetry.
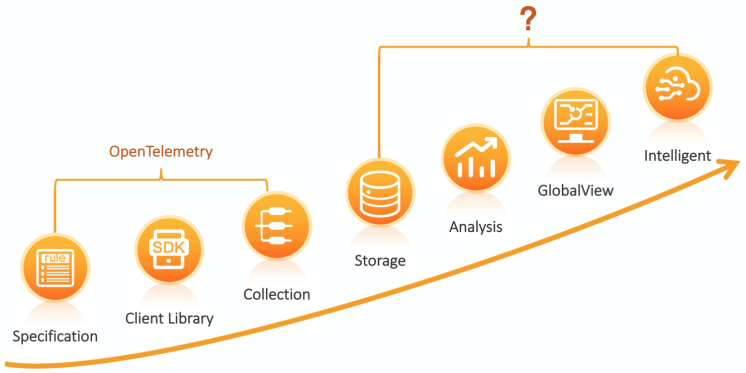
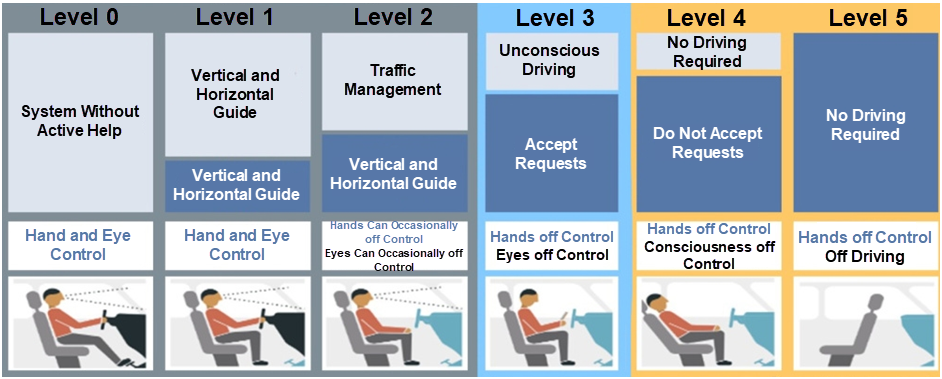
Our team has been responsible for monitoring, logging, distributed tracing, and other observability-related tasks since we started the Apsara 5K project in 2009. We have experienced some architecture changes from minicomputers to distributed systems, and then to microservices and cloud services. The relevant observability solutions have also undergone a lot of evolution. We think that the development of the overall observability correlation is very consistent with the setting of the autonomous driving class.
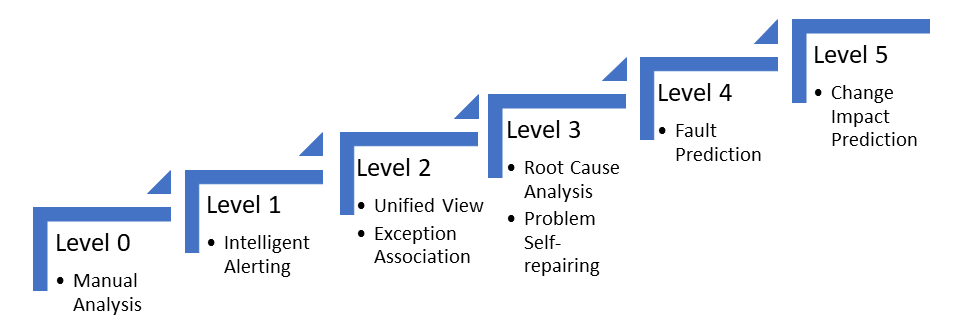
Autonomous driving is divided into six levels, of which level 0-2 is mainly decided by people. Unconscious driving can be carried out above level 3, that is, hands and eyes can temporarily not pay attention to driving. At level 5, people can completely leave the boring job of driving and move freely on the car.
The observability of an IT system can also be divided into six levels:
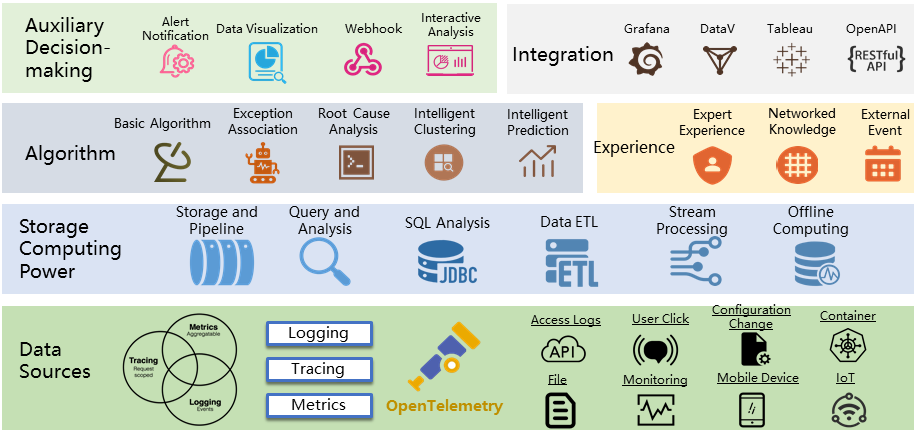
Log Service (SLS) is currently working on cloud-native observability. Based on OpenTelemetry, the future cloud-native observability standard, collects all types of observability data, covers all kinds of data sources and data types, and achieves multi-language support, multi-device support and unified type. We will provide unified storage and computing capabilities to support all kinds of observability data, support PB-level storage, Extract, Transform, and Load (ETL), stream processing, and analysis of tens of billions of data records within seconds. We will provide strong computing power for upper-layer algorithms.
The problems of the IT system are very complex, especially when different scenarios and architectures are involved. Therefore, we combine the algorithm and experience to carry out abnormal analysis. The algorithm includes basic statistics and logical algorithms, as well as Algorithmic IT Operations (AIOp)-related algorithms. Experience includes manually input expert knowledge, problems, solutions, and events accumulated on the internet. The top layer provides functions to assist in decision-making, such as alert notifications, data visualization, and webhooks.
In addition, the top layer provides rich external integration capabilities, such as integration with third-party visualization, analysis or alerting systems. It also provides OpenAPI to facilitate integration among different applications.
As the most active project under CNCF with the exception of Kubernetes, OpenTelemetry has received attention from major cloud vendors and related solution companies. It is believed that OpenTelemetry will become the observability standard under the cloud-native in the future. Although it has not yet reached the level of production availability, the Software Development Kit (SDK) and Collector in various languages are basically stable, and the production available version can be released in 2021, which is worthy of everyone's expectation.
OpenTelemetry only defines the first half of the observability, and there is still a lot of complicated work to be done, so there is a long way to go.
A Unified Solution for Observability - Make SLS Compatible with OpenTelemetry
12 posts | 1 followers
FollowAlibaba Container Service - August 16, 2024
Alibaba Cloud Community - July 25, 2022
Alibaba Clouder - April 28, 2021
Apache Flink Community - March 7, 2025
amap_tech - April 20, 2020
ApsaraDB - November 18, 2025
12 posts | 1 followers
Follow Microservices Engine (MSE)
MSE provides a fully managed registration and configuration center, and gateway and microservices governance capabilities.
Learn More ACK One
Provides a control plane to allow users to manage Kubernetes clusters that run based on different infrastructure resources
Learn More Container Registry
A secure image hosting platform providing containerized image lifecycle management
Learn More Architecture and Structure Design
Customized infrastructure to ensure high availability, scalability and high-performance
Learn MoreMore Posts by DavidZhang