In today's mobile app market, user experience is the decisive factor for product success. Even a feature-rich app will lose users if it frequently crashes or responds slowly. However, the complexity of the Android ecosystem poses major challenges for developers:
● Ecosystem fragmentation: Since its inception in 2008, the Android ecosystem has expanded to thousands of device models with varying screen sizes, hardware capabilities, and system versions (over 16 system versions and 35 API levels). In addition, mobile phone manufacturers tend to apply deep customizations to the Android system. As a result, an app that behaves well in development and test environments may exhibit unexpected problems on real user devices.
● Lack of visibility: After release, apps run inside isolated "black boxes." When users encounter crashes, stutters, or functional exceptions, developers often lack visibility into the root cause. Traditional logs and user feedback channels are inefficient and offer limited help in reproducing or diagnosing issues.
● Performance optimization challenges: Beyond stability, app metrics like startup time, page load speed, and network latency directly affect user experience. Without precise measurements, performance optimization lacks direction and effectiveness.
To address these problems, Real User Monitoring (RUM) has emerged. The core idea of RUM is to integrate a lightweight SDK into an app to collect data on performance, stability, and behavior during real users' app usage, and report the data to a data analysis platform.
To effectively address the challenges above, a modern RUM solution must offer a systematic approach to data collection and analysis. It should not only detect issues but also provide enough context for developers to quickly identify and fix them. Specifically, its core capabilities should cover the following aspects:
● Comprehensive exception and stability monitoring: It can automatically capture various exceptions in an app, including Java crashes, native crashes, Application Not Responding (ANR) errors, and custom errors. It provides detailed stack information and device environment information to help developers quickly locate code issues and assess impact.
● Fine-grained performance metrics: It can accurately measure key metrics that affect user experience, such as the app launch time, page load time, network request latency and success rate, and slow page loading. This allows developers to identify bottlenecks and optimize performance effectively.
● Visualized user session tracing: It can record users' complete interaction flow and related performance events. When an issue occurs, developers can trace back the user's actions, API calls, and resource loading details, which provide critical insights for reproducing the issue and understanding the user scenario, enabling deep root-cause analysis.
● Flexible custom data reporting: Beyond standard performance and exception data, it must allow an app to report custom events and logs based on business needs. By correlating user behavior with business metrics, developers gain deeper insights for product analysis and decision-making.
Alibaba Cloud RUM SDK for Android is purpose-built to address these needs, offering a comprehensive, efficient, and low-intrusion data collection solution that provides developers with deep visibility into real app performance and enables continuous improvement of the user experience.
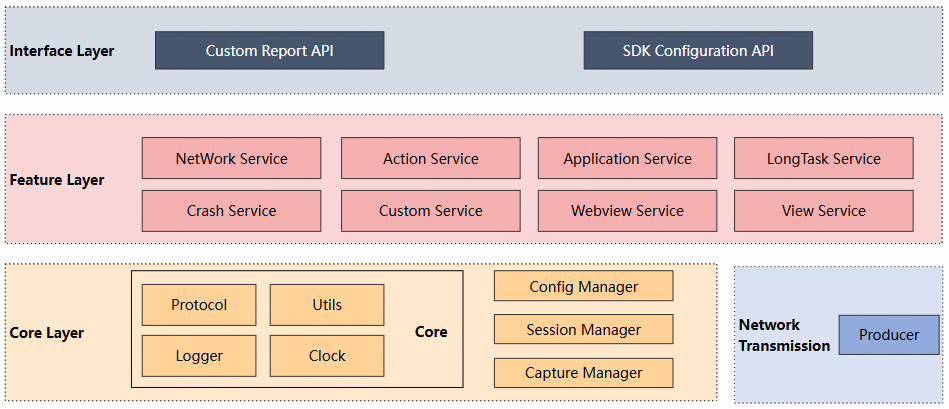
Alibaba Cloud RUM SDK for Android is designed to provide comprehensive user experience monitoring for Android apps. By using hooks, instrumentation, and event listeners throughout the app lifecycle, it enables full visibility into performance and stability. Its lightweight, modular architecture supports non-intrusive collection of data on app stability, performance, and user behavior.

The preceding figure shows the overall architecture of the RUM SDK for Android.
● Interface layer: the top layer, which exposes APIs for client use.
● Feature layer: provides data collection services and specifically includes the Network, Action, Application, LogTask, Crash, Custom, WebView, and View modules.
● Core layer: includes basic services, utility classes, logger, clock, data protocol, session management, configuration management, and collection module management.
● Network: the producer, which is used to send data packets.
Within the feature layer, we leverage Android's system features and framework capabilities to efficiently and accurately capture various events through a diverse set of data collection strategies. Depending on the scenario and data type, we take the most suitable approaches, including data collection based on Android native signals, bytecode instrumentation, and standard APIs.
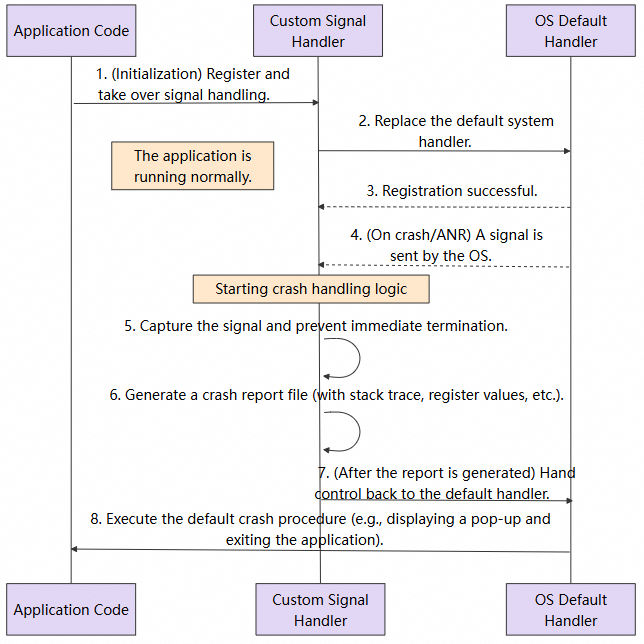
● Android apps can include C/C++ (native) code that runs directly on device hardware. When native code encounters a critical error, such as accessing invalid memory or executing an illegal instruction, the operating system sends a POSIX signal to the corresponding process. For example, SIGSEGV indicates a segmentation fault and SIGILL indicates an illegal instruction. By default, the system immediately terminates the app process, resulting in a crash.
● Meanwhile, in Android, all UI operations and most application callbacks must run on the main UI thread. If the main thread is blocked by time-consuming operations such as heavy computations, disk I/O, network requests, or infinite loops, and fails to respond to user input or system events within the defined time limits (5 seconds for input events and 10 seconds for broadcasts), the system marks the app as ANR.
For Android developers, accurately and promptly capturing native crash stacks and ANR context data is essential for diagnosing and resolving the root causes of application failures.
The core idea is to register a custom signal processor during app initialization to override the system's default processor. When a crash signal is received or at the exact moment the system detects an ANR, the app does not terminate immediately. Instead, it first generates a crash report file containing detailed information (such as the thread stack traces, register states, and loaded libraries) before proceeding with the default crash handling process.

Native crash collection: By monitoring native signals, the SDK captures native stack traces, CPU and register state, and generates a snapshot file when a crash occurs. On the next app launch, the SDK scans, parses, and uploads the crash report.
ANR collection: This leverages the system's mechanism of sending the SIGQUIT signal during ANR detection. By using the sigaction method in the native layer to listen for this signal, the SDK can be notified at the precise moment the system flags an ANR, enabling it to trigger the data-collection workflow.
● Instrumentation is a technique for dynamically or statically modifying a program's code at runtime. In Android, it typically involves analyzing and modifying compiled Java bytecode to inject additional functionalities like logging or performance monitoring.
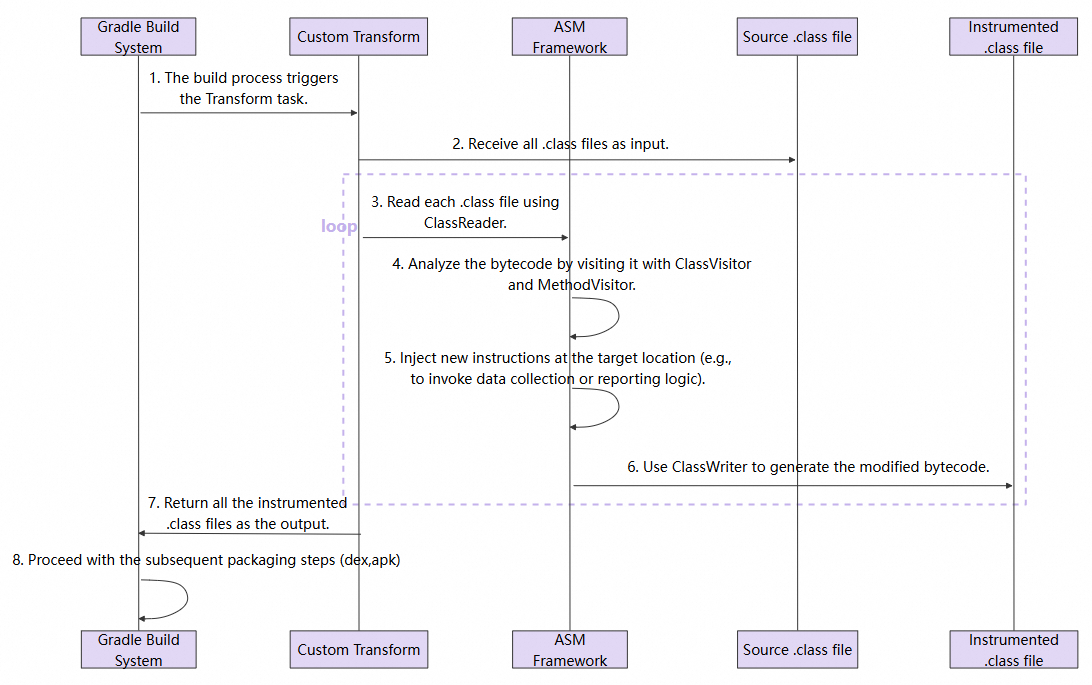
Our SDK uses the Transform/Instrumentation API in combination with ASM to implement the main data collection. This process is fully transparent to app developers and requires no manual modification of business code.
Transform/Instrumentation: Google provides the Transform and Instrumentation APIs to allow third-party plug-ins to manipulate .class files during the compilation process before an app is packaged into .dex files. By implementing a custom converter, you can modify and replace code to achieve instrumentation.
ASM: ASM is a comprehensive Java bytecode manipulation and analysis framework, capable of dynamically generating classes or enhancing existing ones.
Using the Transform/Instrumentation API combined with ASM, we modify the bytecode during the app packaging process to inject logging and data collection code.

Network request collection: Using instrumentation, we monitor network requests, and capture performance metrics (such as latency, status codes, and throughput) as well as error information. Key methods in mainstream networking libraries, including HttpURLConnection and OkHttp2/3, are instrumented to enable end-to-end tracing and metric collection.
WebView collection: Instrumentation enables communication with WebView, allowing the collection of resource requests, page performance, and error data within the WebView context.
Action collection: Instrumentation is used to listen for button tap events, enabling the collection of user actions.
In addition to native signal handling and bytecode instrumentation, the SDK also leverages standard Java and Android APIs to capture key runtime events.
Java API: The Java Virtual Machine (JVM) provides a standard mechanism for handling uncaught exceptions: Thread.UncaughtExceptionHandler. Developers can configure a global processor that is invoked whenever any thread is about to terminate due to an uncaught exception. This serves as the only opportunity to perform final logging or cleanup before the app crashes.
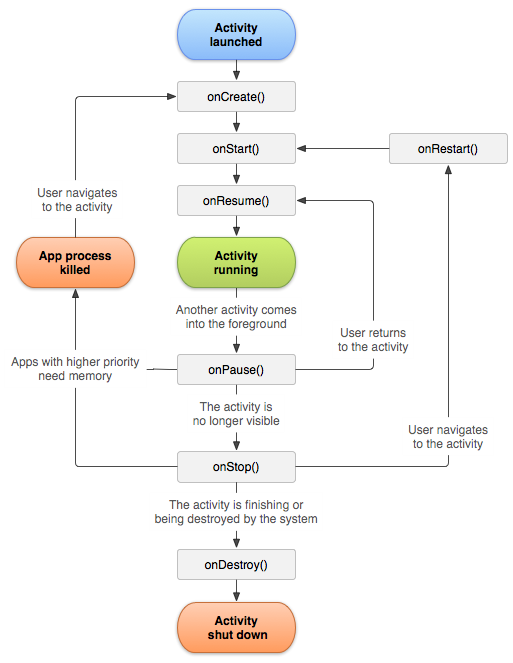
Android API: The Android framework offers a lifecycle callback mechanism to monitor events such as page transitions, user interactions, and app startup. For example, an activity, the fundamental UI component in Android, is managed through a series of lifecycle callback methods defining its states from creation to destruction.

● onCreate(): The activity is created and initialized.
● onStart(): The activity is visible but not interactive.
● onResume(): The activity is visible in the foreground and interactive.
● onPause(): The activity is about to enter the background; typically used to stop animations or release resources.
● onStop(): The activity is fully invisible.
● onDestroy(): The activity is destroyed.
To monitor these states globally, Android provides the Application.ActivityLifecycleCallbacks interface that allows registering a listener to receive lifecycle events from all activities within the app.
Java crash collection: The SDK registers a global exception processor Thread.setDefaultUncaughtExceptionHandler(this) to collect information about Java exceptions, including the exception type, message, stack trace, and contextual information such as the current session and active page. The collected data is then reported on the next app launch.
ANR collection: The SDK leverages Java multithreading capabilities to monitor ANR errors.
View collection: By using standard Android lifecycle callbacks, the SDK precisely tracks user activity across pages. These callbacks are used to compute key page metrics, such as page load time and dwell time.
Application state collection: By listening to lifecycle events, the SDK captures cold and warm app starts, as well as foreground-background transitions.
Alibaba Cloud RUM SDK provides comprehensive user experience monitoring for apps, offering a non-intrusive solution to collect performance, stability, and user behavior data on Android. Refer to the integration guide for hands-on setup. If you have any questions, join the RUM support DingTalk group (group ID: 67370002064) for consultation.

706 posts | 57 followers
FollowAlibaba Cloud Native Community - October 10, 2025
Alibaba Cloud Native Community - January 20, 2026
OpenAnolis - January 4, 2023
Alibaba Cloud Native Community - December 24, 2025
Alibaba Cloud Native Community - April 8, 2026
Alibaba Cloud Native - September 12, 2024

706 posts | 57 followers
Follow Application Real-Time Monitoring Service
Build business monitoring capabilities with real time response based on frontend monitoring, application monitoring, and custom business monitoring capabilities
Learn More Real-Time Livestreaming Solutions
Stream sports and events on the Internet smoothly to worldwide audiences concurrently
Learn More Managed Service for Prometheus
Multi-source metrics are aggregated to monitor the status of your business and services in real time.
Learn More CloudMonitor
Automate performance monitoring of all your web resources and applications in real-time
Learn MoreMore Posts by Alibaba Cloud Native Community