The Custom Configurations tab provides centralized control over your ARMS Java agent's behavior -- sampling policies, feature switches, thresholds, filtering rules, and collection parameters. Adjust these settings to balance observability coverage against performance overhead and cost.
To configure these settings programmatically, use the SaveTraceAppConfig API.
Configuration sections at a glance
| Section | What it controls |
|---|---|
| Sampling settings | Sampling policy, sample rate, full-sampling rules |
| Agent switch settings | Application monitoring on/off, plug-in selection |
| Thread profiling settings | Thread profiling on/off |
| Application log association settings | Log source, Trace ID/Span ID injection |
| URL convergence settings | URL grouping rules and thresholds |
| Arthas monitoring | Arthas diagnostics on/off, target IPs |
| Continuous profiling settings | CPU, memory, and code profiling |
| Information desensitization settings | Sensitive data masking rules |
| Interface call settings | Slow call thresholds, status code whitelists, interface filtering |
| Database call settings | Slow SQL thresholds, SQL display options |
| Trace context propagation protocol settings | Preferred or enforced tracing protocol |
| Message queue settings | Custom consumer configuration |
| Agent collection settings | Rate limits, log level, metric filters |
| Advanced exception filtering settings | Exception collection and filtering rules |
| Pooling monitoring settings | Thread pool and connection pool monitoring |
| Span attribute settings | OTel attributes, application labels |
| Advanced settings | Method stack depth, trace compression, async propagation |
Prerequisites
An ARMS agent is installed for the application.
Application Monitoring provides a new application details page for users who have enabled the new billing mode. If you have not enabled the new billing mode, click Switch to New Version on the Application List page to access the new page.
Open the Custom Configurations page
Log on to the ARMS console. In the left-side navigation pane, choose Application Monitoring > Application List.
On the Applications page, select a region at the top, then click the application name.
NoteThe icons in the Language column indicate the application type:
 : Java application.
  : Go application.
  : Python application. - : Application connected to Managed Service for OpenTelemetry.
In the top navigation bar, choose Configuration > Custom Configurations.
Configure the parameters described in the following sections, then click Save.
Sampling settings
Configure the sampling policy, sample rate, and full-sampling rules for specific interfaces. Toggle low-traffic sampling on or off.
For details on sampling modes and their trade-offs, see Select a trace sampling mode for an agent of V3.2.8 or later.
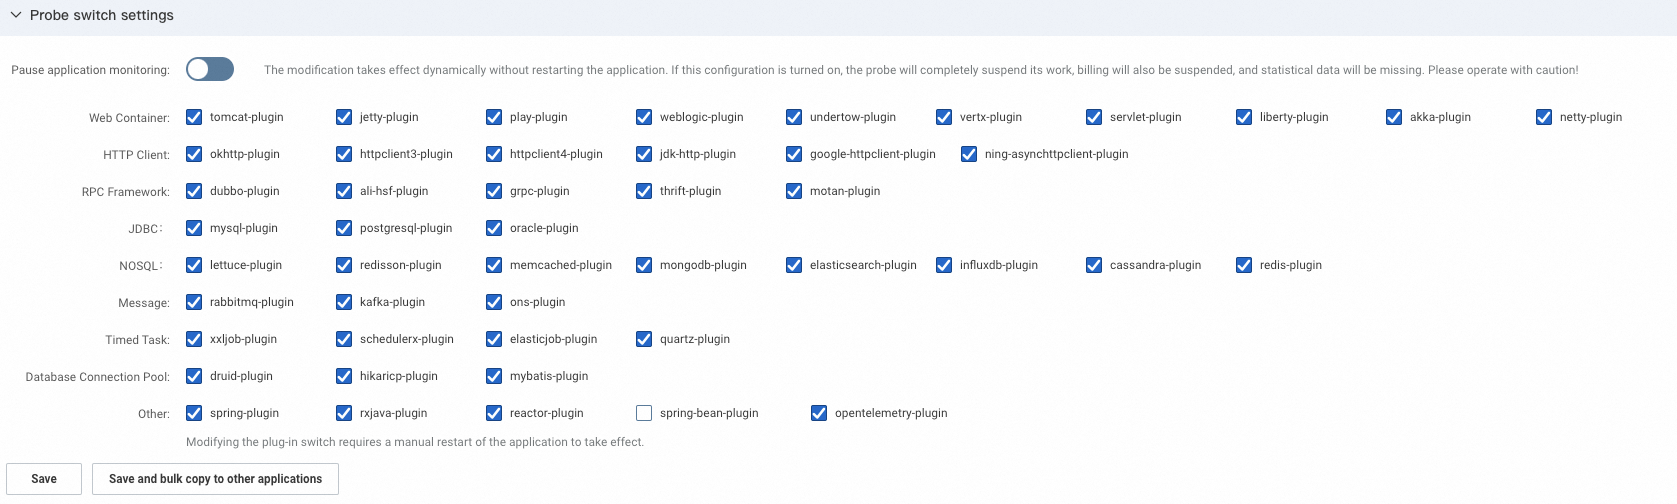
Agent switch settings
Enable or disable application monitoring and select the plug-ins to use.
Enabling or disabling application monitoring takes effect immediately without an application restart. Disabling it stops monitoring for the application entirely. Proceed with caution.
Plug-in switch changes require a manual application restart to take effect.
Thread profiling settings
Enable or disable the main switch for thread profiling.
Application log association settings
Configure a log source for the application and control whether Trace ID and Span ID are automatically injected into logs. For details, see Log analysis.
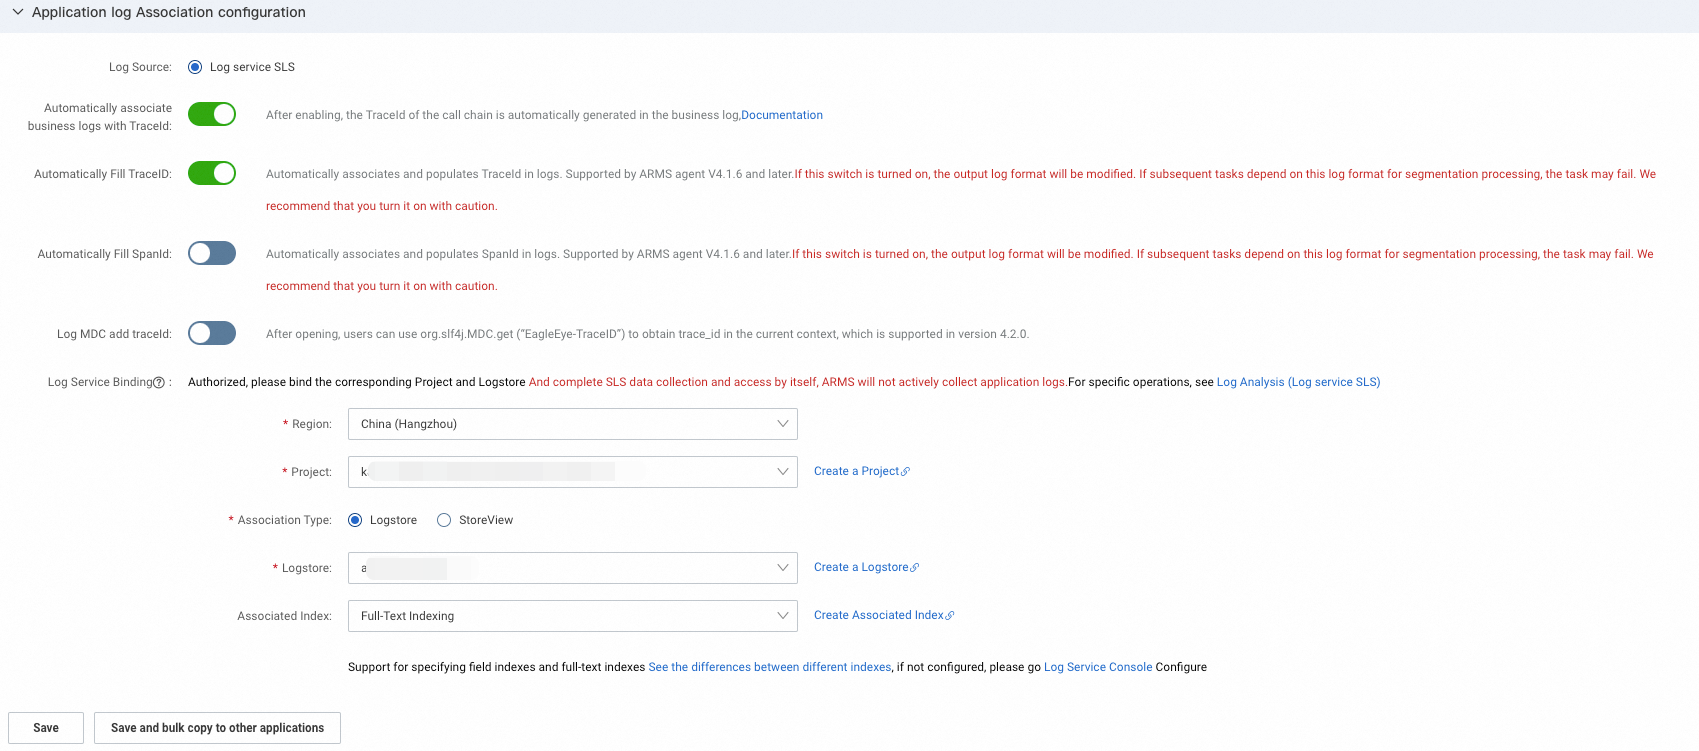
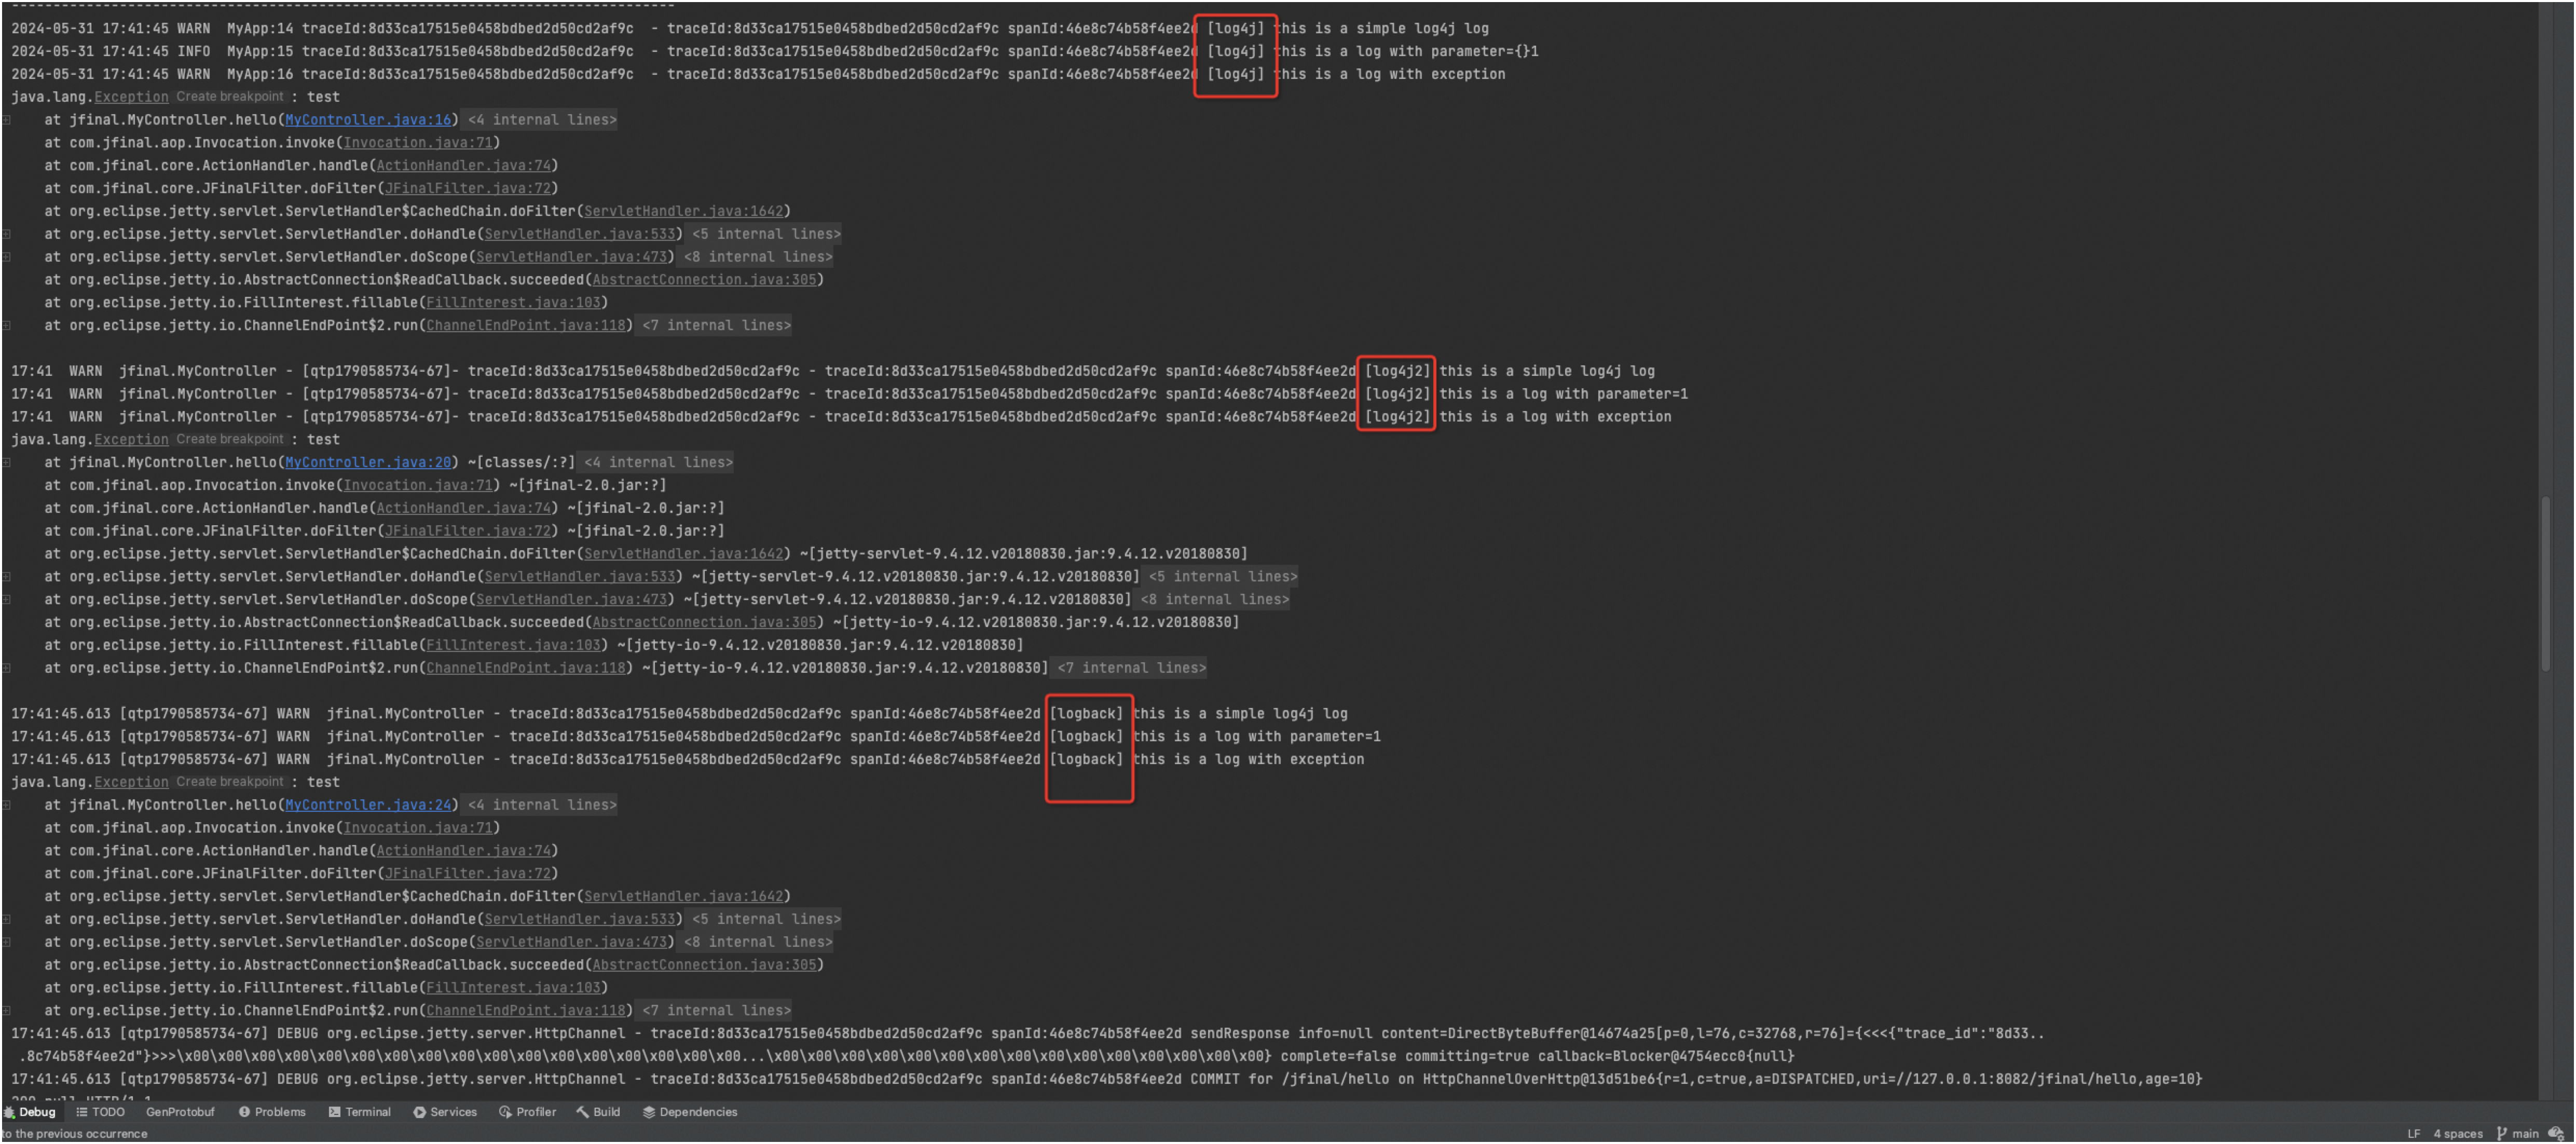
Auto Fill TraceId and SpanId
Automatically injects Trace ID and Span ID into logs. No changes to the log configuration file are required.
| Attribute | Detail |
|---|---|
| Supported frameworks | log4j, log4j2, logback |
| Restart required | No |
After enabling this switch, the supported frameworks automatically print Trace ID and Span ID without any modifications to the log configuration file.
Support adding traceId in log MDC
By default, agents of V4.x do not support retrieving Trace ID through org.slf4j.MDC.get("EagleEye-TraceID"). Enable this switch if your application relies on this method.
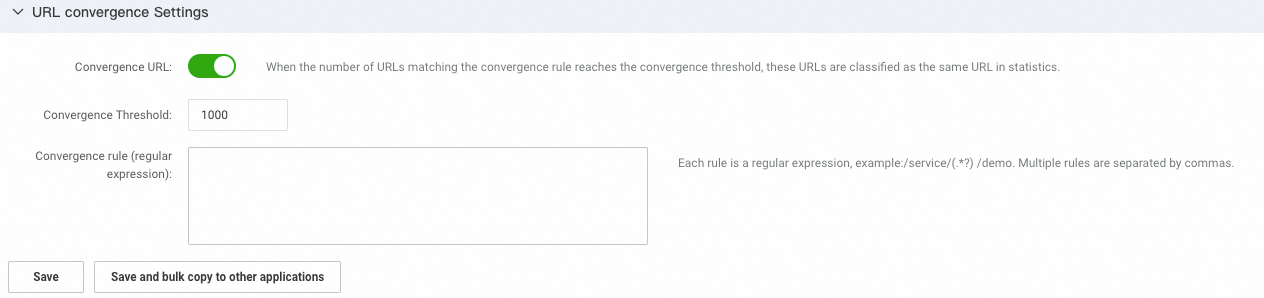
URL convergence settings
URL convergence groups similar URLs into a single entry. For example, URLs prefixed with /service/demo/ are displayed as one object.
Enable or disable convergence, and configure the convergence threshold and rules. The convergence threshold is the minimum number of matching URLs required to trigger convergence. For example, if the threshold is 100, convergence only activates when at least 100 URLs match a rule's regular expression.
For details, see ARMS convergence policies.
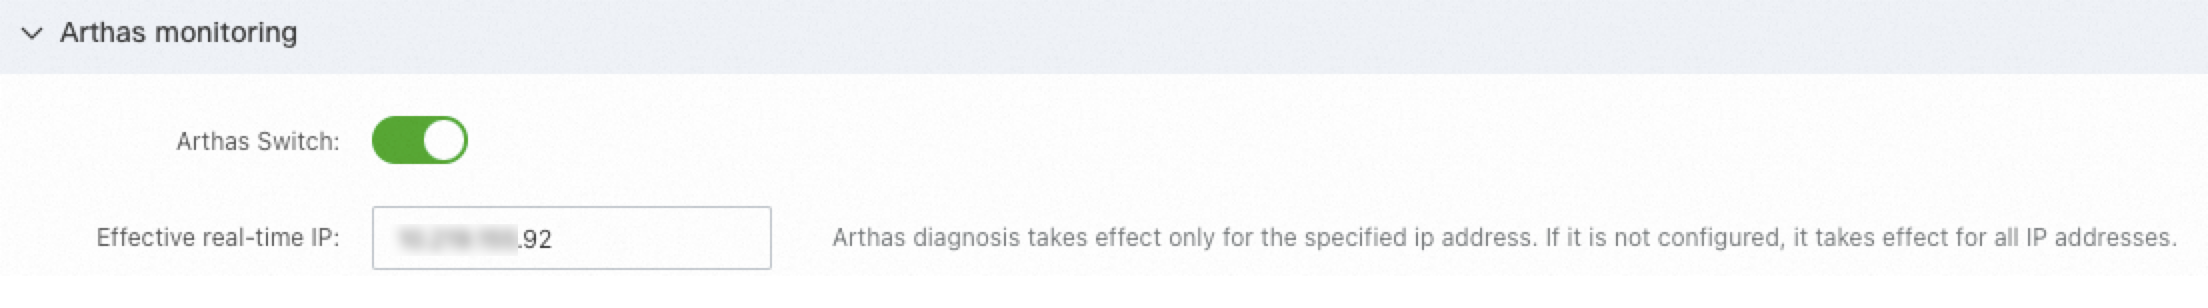
Arthas monitoring
Enable or disable the Arthas diagnostics feature and specify the IP addresses on which to perform diagnostics. For details, see Arthas diagnostics.
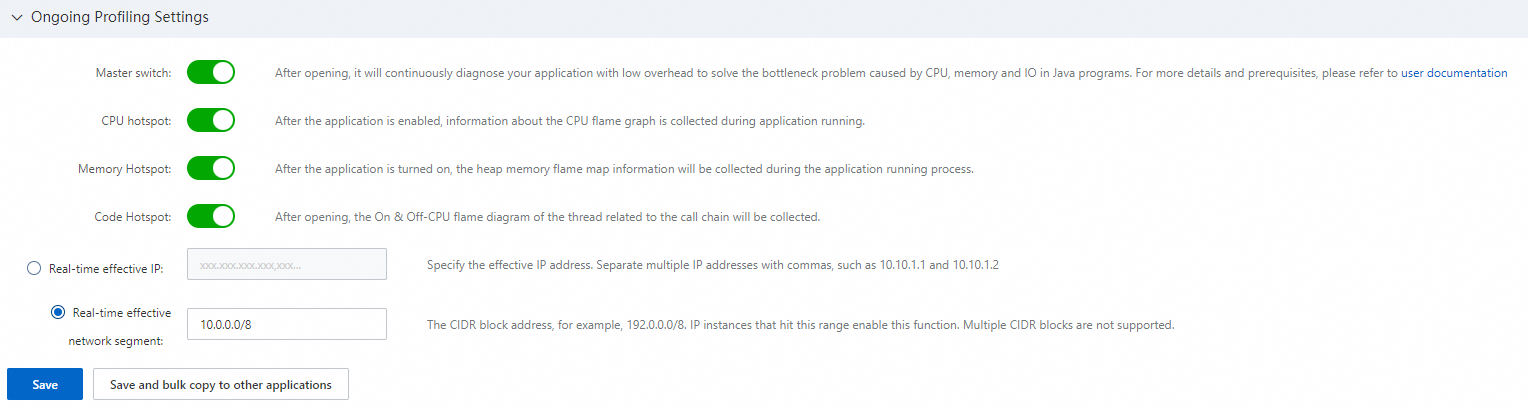
Continuous profiling settings
Enable or disable the main switch and the individual switches for CPU Hotspot, Memory Hotspot, and Code Hotspot. Specify the IP addresses or CIDR block to which profiling applies.
For details, see Continuous profiling for Java applications.
Information desensitization settings
Set desensitization rules to mask sensitive content -- such as JVM system parameters, K8s YAML values, method input parameters, Arthas environment variables, and system variables -- during data collection.
Separate rule elements with commas. Each element is a case-insensitive regular expression. For example, password is equivalent to .*password.*.
When the agent collects data, it matches data keys against these expressions. If a key matches, the corresponding value is masked. For example, if the rule is set to licenseKey, the value of -Darms.licenseKey is masked.
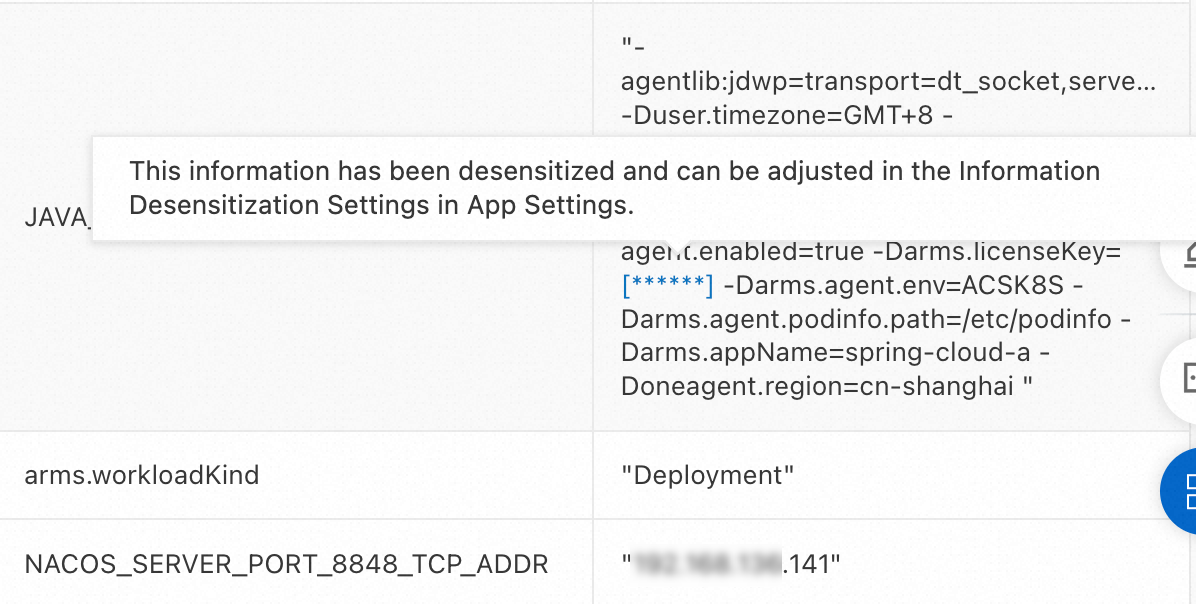
IP desensitization can also be enabled to mask IP addresses in collected data.
Interface call settings
Configure thresholds, whitelists, and filtering policies for interface calls.

Slow call threshold
| Attribute | Detail |
|---|---|
| Default | 500 ms |
| Description | Calls with a response time exceeding this threshold are marked as slow |
HTTP status code whitelist
By default, HTTP status codes >= 400 are classified as errors. To prevent a specific status code from being counted as an error, add it to the whitelist.
This setting applies only to the HTTP frameworks supported by Application Monitoring.
| Attribute | Detail |
|---|---|
| Affected data | Error count metrics (arms_http_requests_error_count, arms_http_client_requests_error_count, arms_app_requests_error_count) and span status |
| Affected features | Error counts on the Overview, Provided Services, and Dependencies tabs; span status and error count alerts on the Trace Explorer page |
| Format | Single status codes separated by commas. Fuzzy match is not supported. Example: 403,502 |
| Default | Empty |
Invalid interface call filtering
Hide specific interfaces from the Provided Services tab by entering their names. The agent stops reporting observability data for these interfaces.
For Java agents earlier than V4.2.0, this setting only applies to interfaces on the Provided Services tab.
For Java agents of V4.2.0 or later, this setting applies to any LocalRootSpan.
| Attribute | Detail |
|---|---|
| Affected data | All metrics and spans for the matching interfaces are dropped |
| Affected features | Metrics on the Overview, Provided Services, and Dependencies tabs; span counts, call counts, error counts, and slow call alerts on the Trace Explorer page |
| Format | Use a string or AntPath expression to match the full interface name. Separate multiple rules with commas. The default AntPath expressions maintain backward compatibility -- do not delete them. Append new rules after the existing ones. Example: /api/test/*,/api/playground/create |
| Default | /**/*.jpg,/**/*.png,/**/*.js,/**/*.jpeg,/**/*.pdf,/**/*.xlsx,/**/*.txt,/**/*.docs,/**/*.gif,/**/*.csv |
Record upstream interface name in interface call metric
Record upstream application name in interface call metric
These two settings control whether the upstream application and upstream interface that call this interface are recorded in the interface call metrics. This primarily affects whether data exists for upstream and downstream traces on the Provided Services tab.
When an application has many upstream callers, recording this information can significantly increase reported metric volume and costs.
After disabling these settings, the corresponding upstream data drops to 0.
Record original status code in metrics
Records the original HTTP response code in interface-related metrics, as shown below.
Record HTTP method name for interface
When enabled, the interface name displayed on the Interface Calls page includes the HTTP request method. For example, /api/v1/use/{userId} becomes GET /api/v1/use/{userId}.
Database call settings
Configure thresholds and display options for database calls.
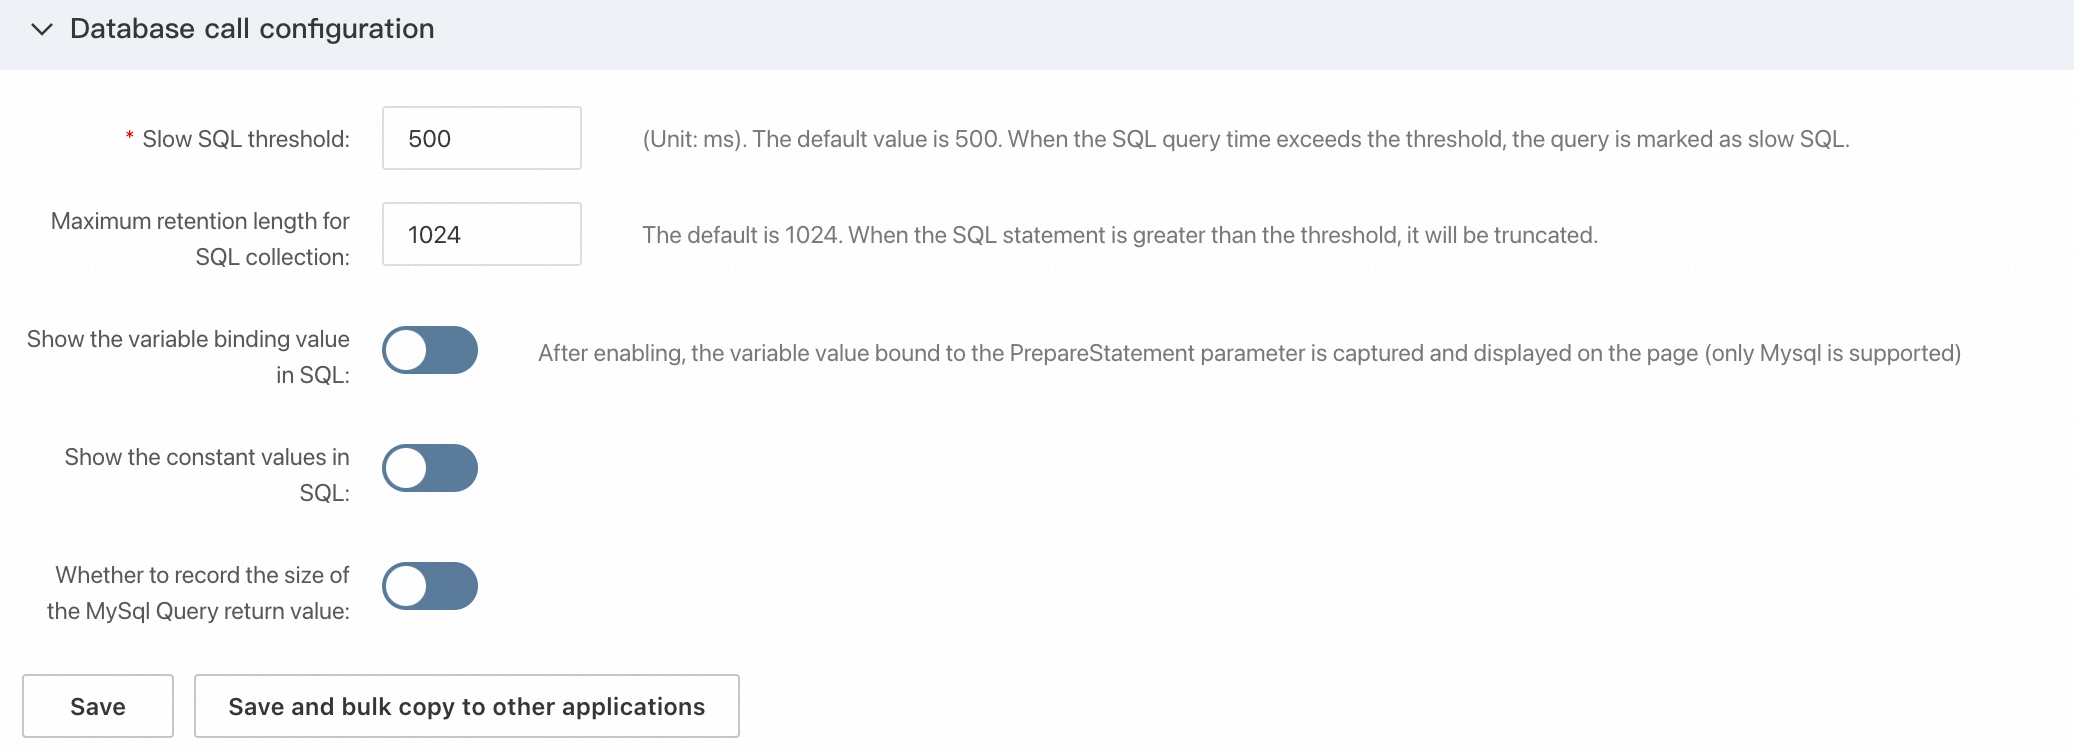
Slow SQL threshold
Set the threshold (in milliseconds) for identifying slow SQL statements.
Maximum length of collected SQL statements
Set the maximum character length for SQL statements collected by the agent.
Display variable binding values in SQL
Captures variable values bound to PreparedStatement parameters and stores them as span attributes with the key db.bindvalue. The value is a comma-separated list of variable values. This setting takes effect without an application restart.
| Attribute | Detail |
|---|---|
| Supported frameworks | All JDBC-based frameworks supported by ARMS |
| Supported variable types | Boolean, Byte, Short, Int, Long, Float, Double, BigDecimal, Date |
| Restart required | No |
| Performance impact | Additional overhead proportional to the number of variables. In official stress testing scenarios (with one variable): less than 0.5% additional CPU overhead, negligible memory overhead |

Record MySQL query return value size
Records the size of the return value for MySQL queries.
Display constant values in SQL
Displays constant values in SQL statements without additional processing. This setting takes effect without an application restart.
Enabling this option treats SQL statements with different constant values as distinct statements. This can prevent correct convergence and may cause statements to be grouped under {ARMS_OTHERS}. Keep this option disabled unless you have a specific need.
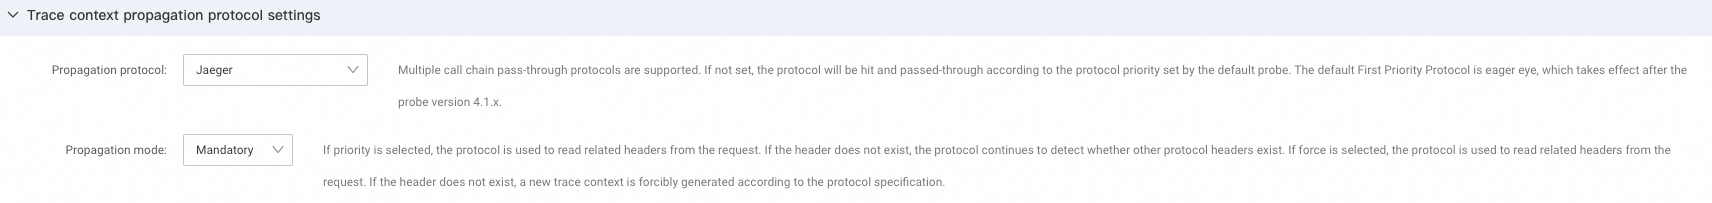
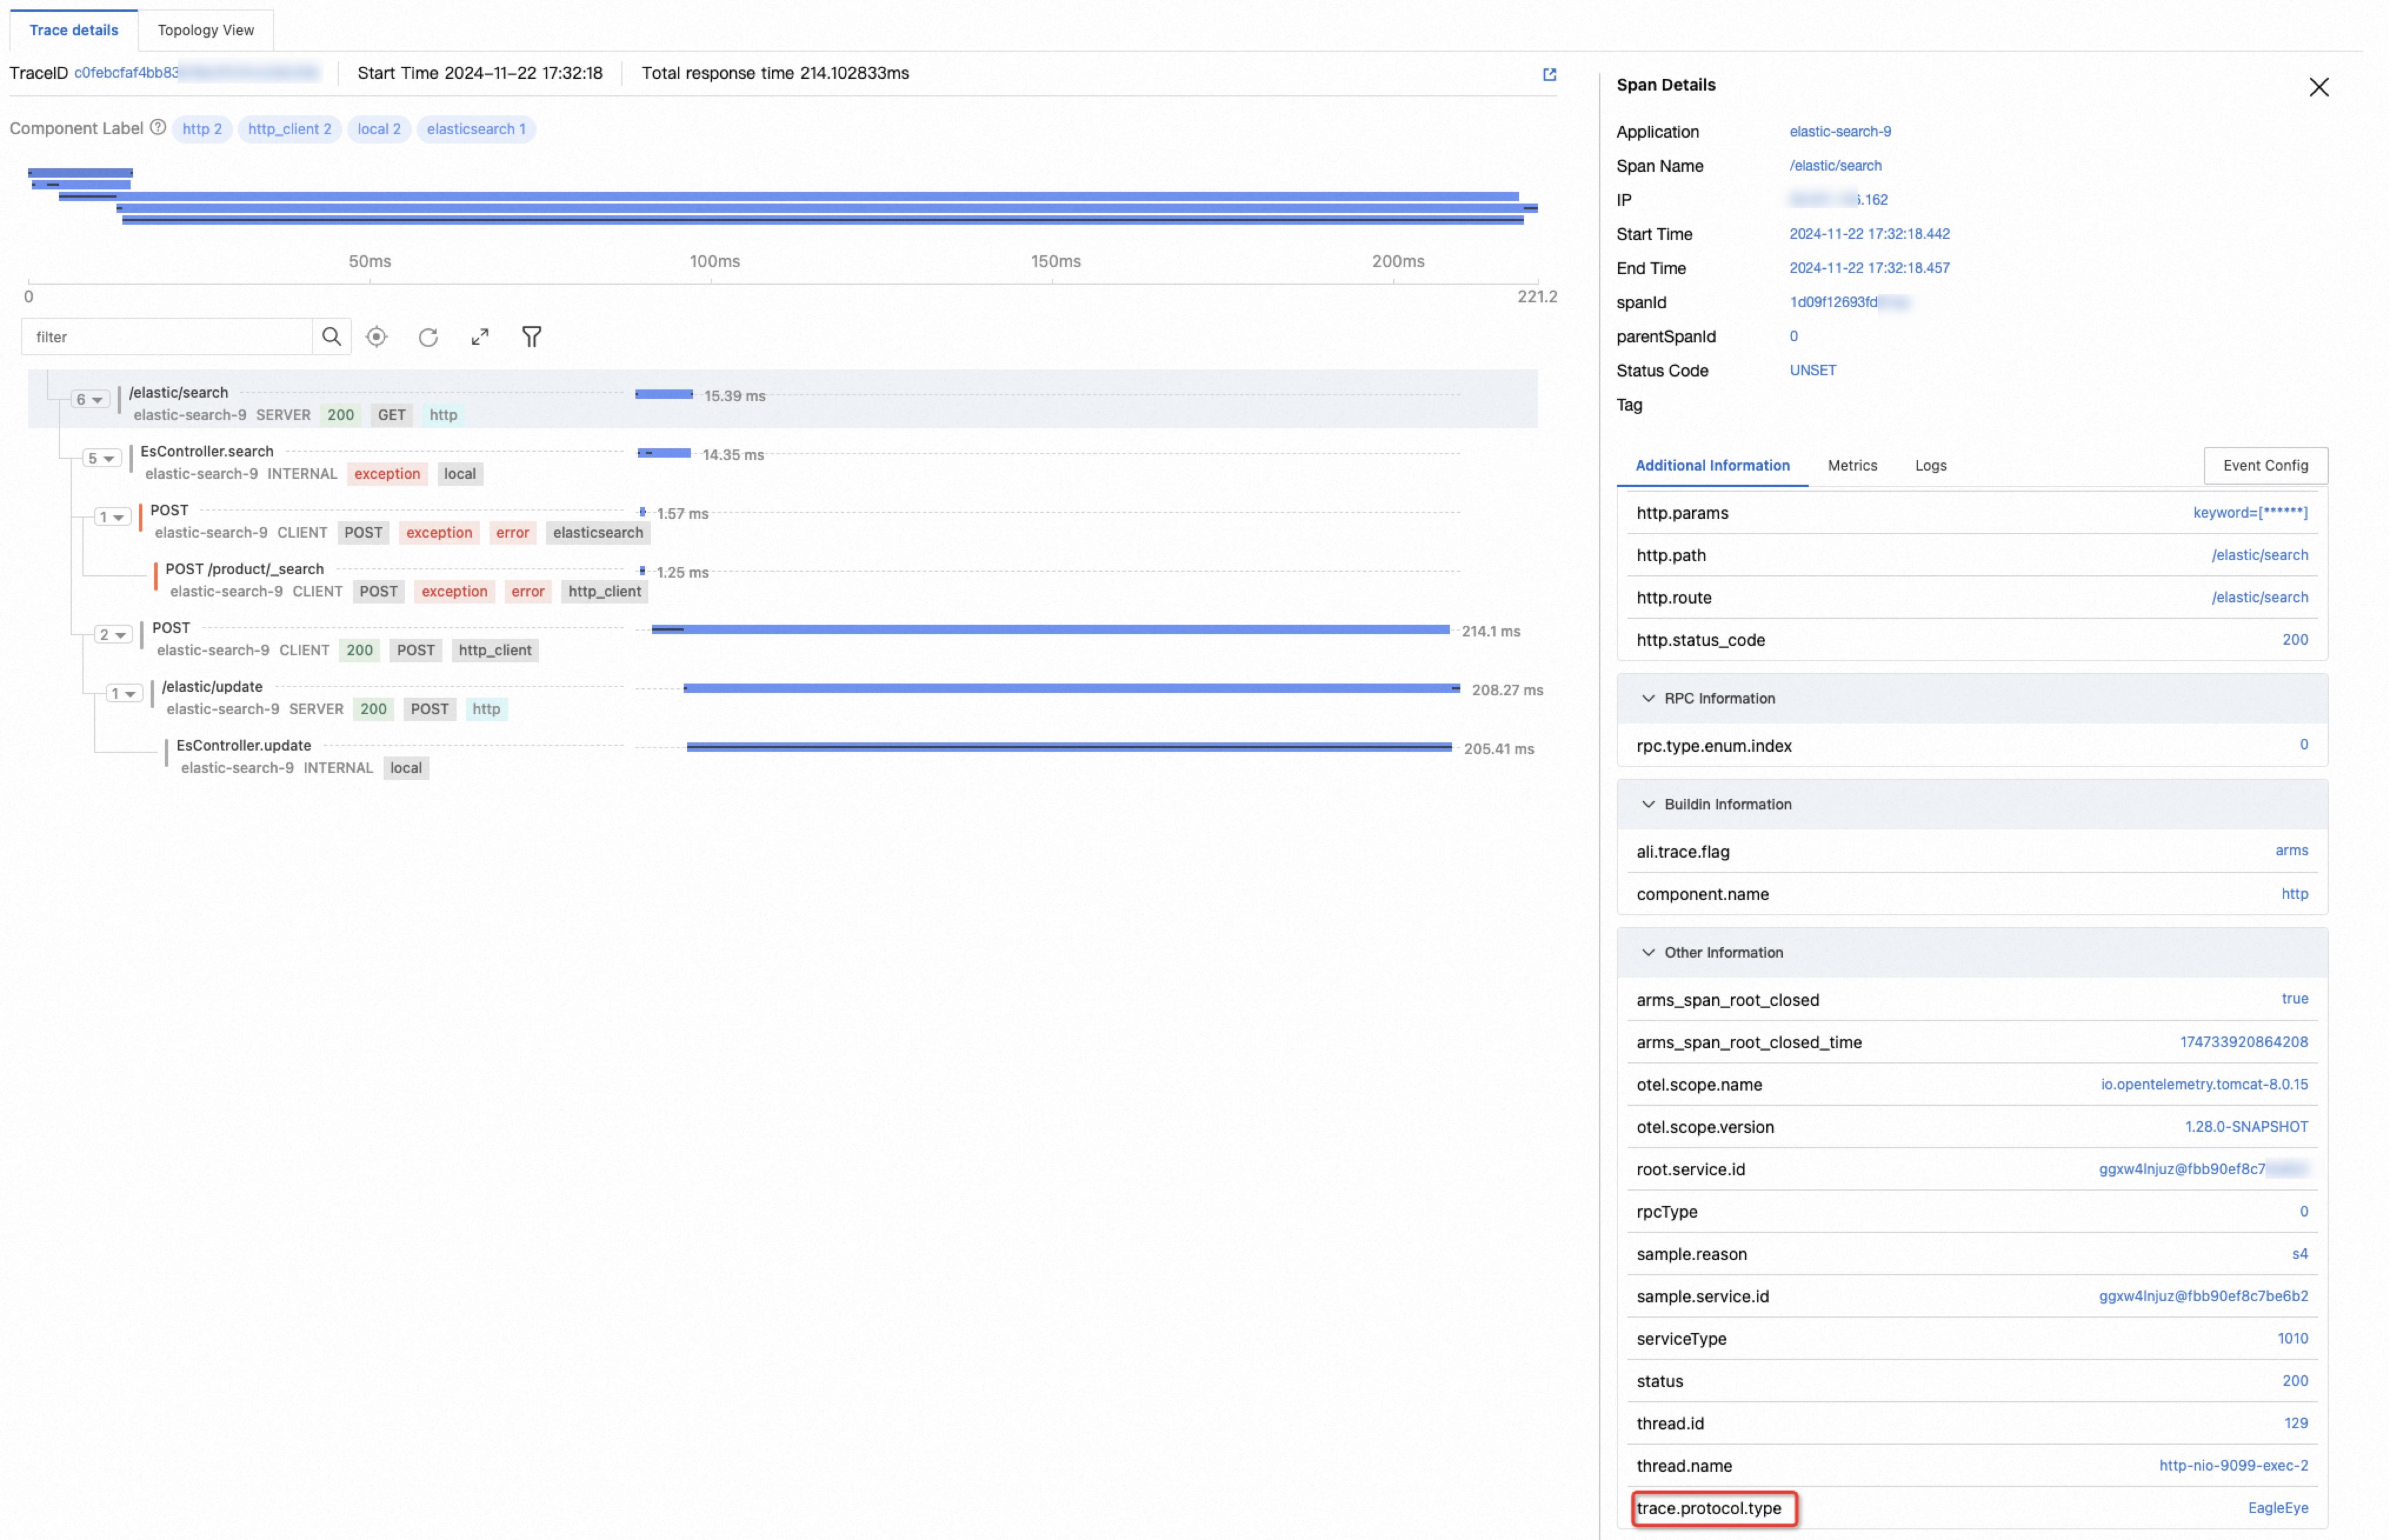
Trace context propagation protocol settings
Select a trace context propagation protocol based on your requirements.
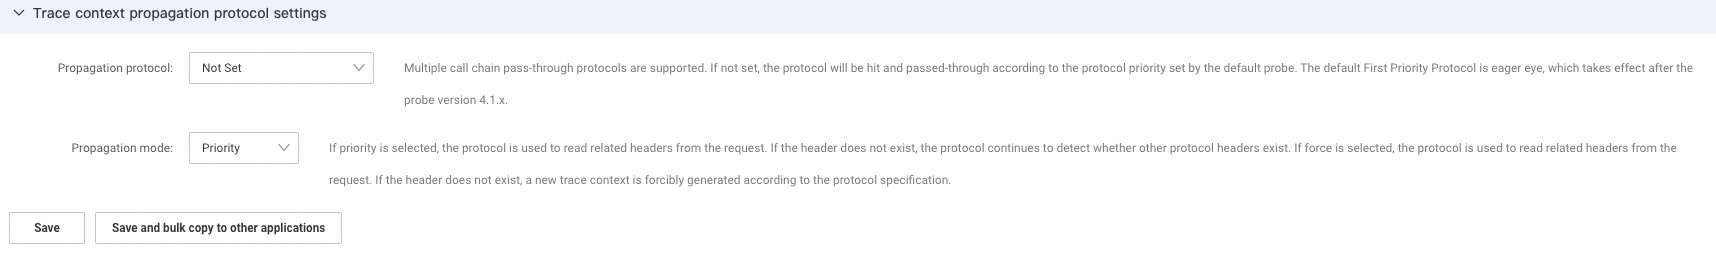
By default, the ARMS agent selects a protocol based on whether the request header contains specified protocol headers. For details, see ARMS trace context propagation protocol selection policy.
Preferred protocol
Select a protocol to set its priority in the detection order. For example, with the following configuration, the agent checks for protocol context in this order: Jaeger, EagleEye, W3C, SkyWalking, Zipkin.

Enforced protocol
Enforce a specific protocol so the agent only checks for that protocol's headers. If those headers are absent, the agent generates a new trace context instead of falling back to other protocols.
Common use cases
Change the default parsing priority: If a request carries trace contexts in multiple formats and the default order does not meet your needs, set a preferred protocol. For example, if a request carries both W3C and Zipkin headers, W3C is parsed first by default. Setting Zipkin as the preferred protocol prioritizes it instead.
Ignore an existing trace context: If a request carries a trace header but you want to generate a new context with a different protocol, set that protocol as both preferred and enforced. For example, to ignore a Zipkin header and generate a W3C context, set W3C as the protocol and change the propagation mode to Enforced. Without enforced mode, the agent still falls back to parsing the Zipkin header if W3C parsing fails.
Configuration effect
After saving, each LocalRootSpan in a trace includes a trace.protocol.type attribute indicating the active protocol.
Message queue settings
Customize consumer configuration for message queues.
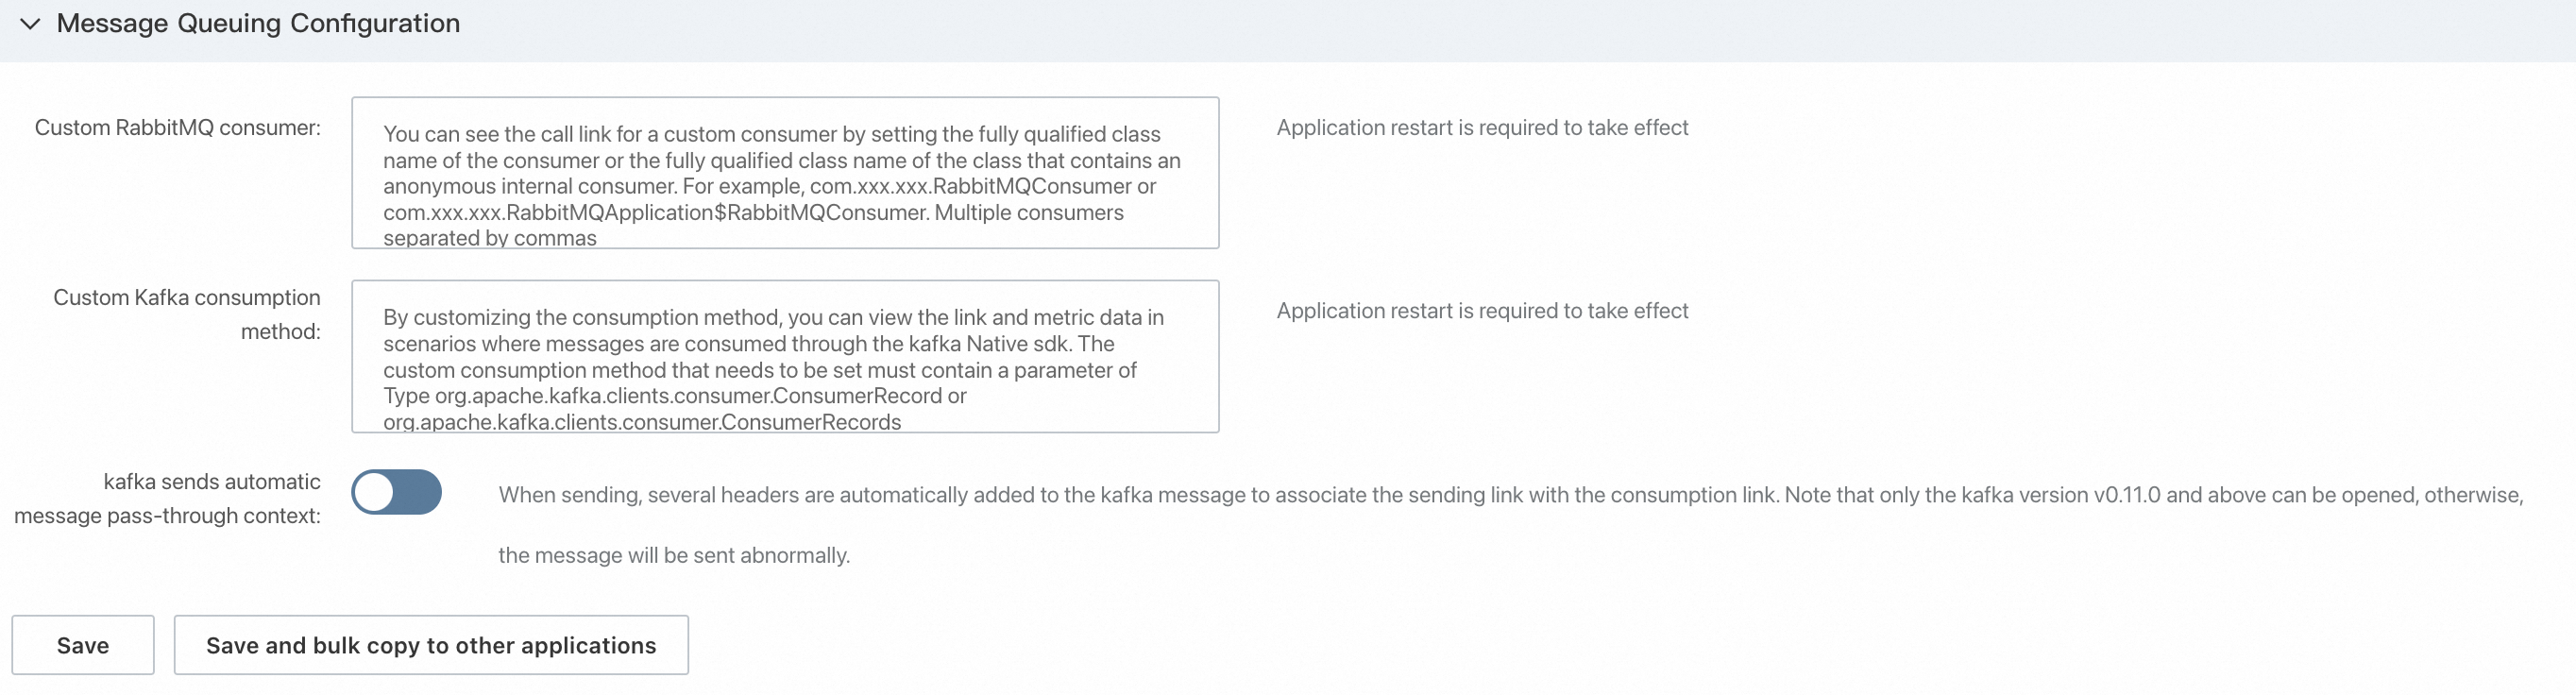
| Setting | Description |
|---|---|
| Custom RabbitMQ consumer | Specify class names for custom consumers or anonymous internal consumers to view their traces. Separate multiple consumers with commas. |
| Custom Kafka consumption method | Specify a custom consumption method to view traces and metrics when consuming messages through the native Kafka SDK. |
| Automatic context pass-through for Kafka messages | When sending a message, the agent automatically adds headers to the Kafka message to associate the sending trace with the consumption trace. |
Agent collection settings
Configure rate limits, collection toggles, and log settings for the agent.
| Setting | Description | Default |
|---|---|---|
| Collect traces | Controls whether trace data is reported. | Enabled |
| Maximum number of traces collected by the agent per second | The maximum number of spans the agent reports per second. The actual threshold may deviate up to 5% from the configured value for performance reasons. Spans exceeding this limit are dropped. | -- |
| Maximum QPS threshold that the agent can handle | The maximum number of requests the agent handles per second. The actual threshold may deviate up to 5%. Requests exceeding this threshold are not monitored -- no spans, metrics, or Trace ID log associations are generated. | -- |
| Agent log level | Adjusts the agent's logging level. Useful for troubleshooting. | -- |
| Report agent logs | Controls whether the agent sends its operational logs to the ARMS server for troubleshooting. Under normal conditions, only a small volume of logs is sent per minute. | -- |
Collect internal call data without an entry
In ARMS, HTTP services, RPC services, scheduled tasks, and message consumption are considered entries. Calls made within these entries (such as database calls and HTTP requests) are internal calls *with* an entry. Calls initiated outside of entries -- such as scheduled HTTP calls, database calls, NoSQL calls, message sends, and RPC calls through a JDK thread pool -- are internal calls *without* an entry.
Agents of V4.2.2 and later provide a one-click option to filter out entry-less internal calls. For example, the Lettuce framework periodically runs commands to maintain the Redis connection. These are internal calls without an entry. After disabling their collection, the related metrics are no longer reported.
Default metric collection filter
Filters the reporting of specified metric types. Supported types:
| Type | Description |
|---|---|
custom_entry | Custom metrics for method monitoring |
http | Metrics for HTTP server-side |
http_client | Metrics for HTTP client |
rpc | Metrics for RPC call server-side |
rpc_client | Metrics for RPC call client |
sql | Metrics for database service access |
nosql | Metrics for NoSQL service access |
cache | Metrics for cache service access |
producer | Metrics for message sending |
consumer | Metrics for message consumption |
schedule | Metrics for scheduling service |
Custom metric collection configuration
Configure metrics defined by the OpenTelemetry SDK. For details, see Customize metrics using the OpenTelemetry Java SDK.
Baggage collection list
When your application uses baggage, this setting writes specific baggage entries to span attributes, making it easier to retrieve specific traces.
Advanced exception filtering settings
Configure exception collection and filtering rules.
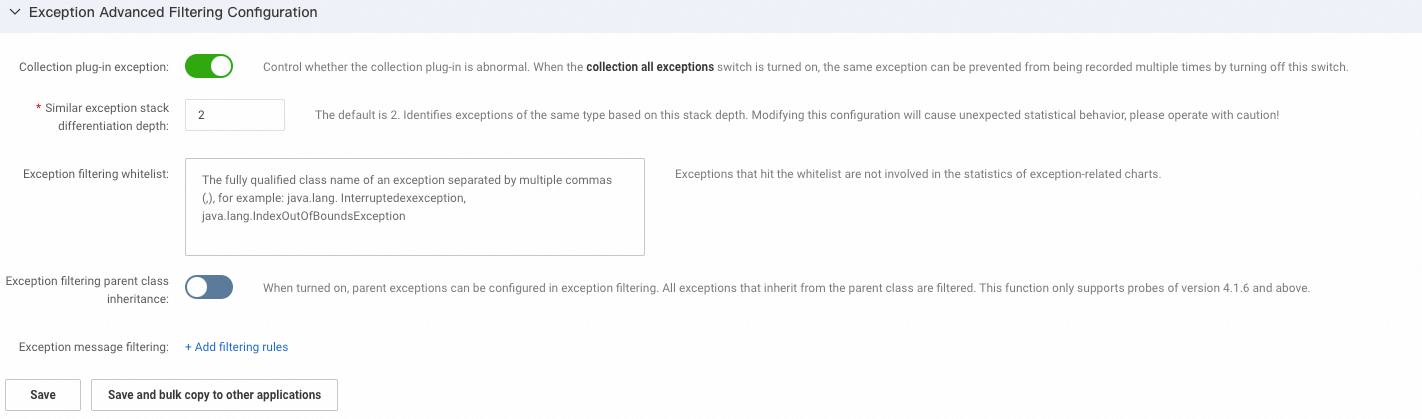
Collect plug-in exceptions
Controls whether plug-in exceptions are collected.
Stack depth for distinguishing similar exceptions
Default value is 2. This depth is used to identify similar exception types. Modifying it may cause unexpected statistical behavior. Proceed with caution.
Exception filtering whitelist
Enter the fully qualified class names of exceptions to hide them from the Exception Analysis tab.
| Attribute | Detail |
|---|---|
| Affected data | Exception count metrics (arms_exception_requests_count_raw, arms_exception_requests_seconds_raw) and exception information in spans |
| Affected features | Exception metrics on the Exception Analysis tab |
| Format | Fully qualified class names separated by commas. Example: java.lang.InterruptedException,java.lang.IndexOutOfBoundsException |
| Default | None |
Exception filtering for parent class inheritance
When enabled, an exception is also filtered if it is a subclass of a class in the exception filtering whitelist.
Exception message filtering
Filter exceptions of a specified type based on their message content.
| Field | Description |
|---|---|
| Exception name | The exception class to filter |
| Message condition | Match condition: startsWith, endsWith, or contains |
| Message keyword | The keyword string to match |
Exceptions that match these criteria are not displayed in the ARMS console.
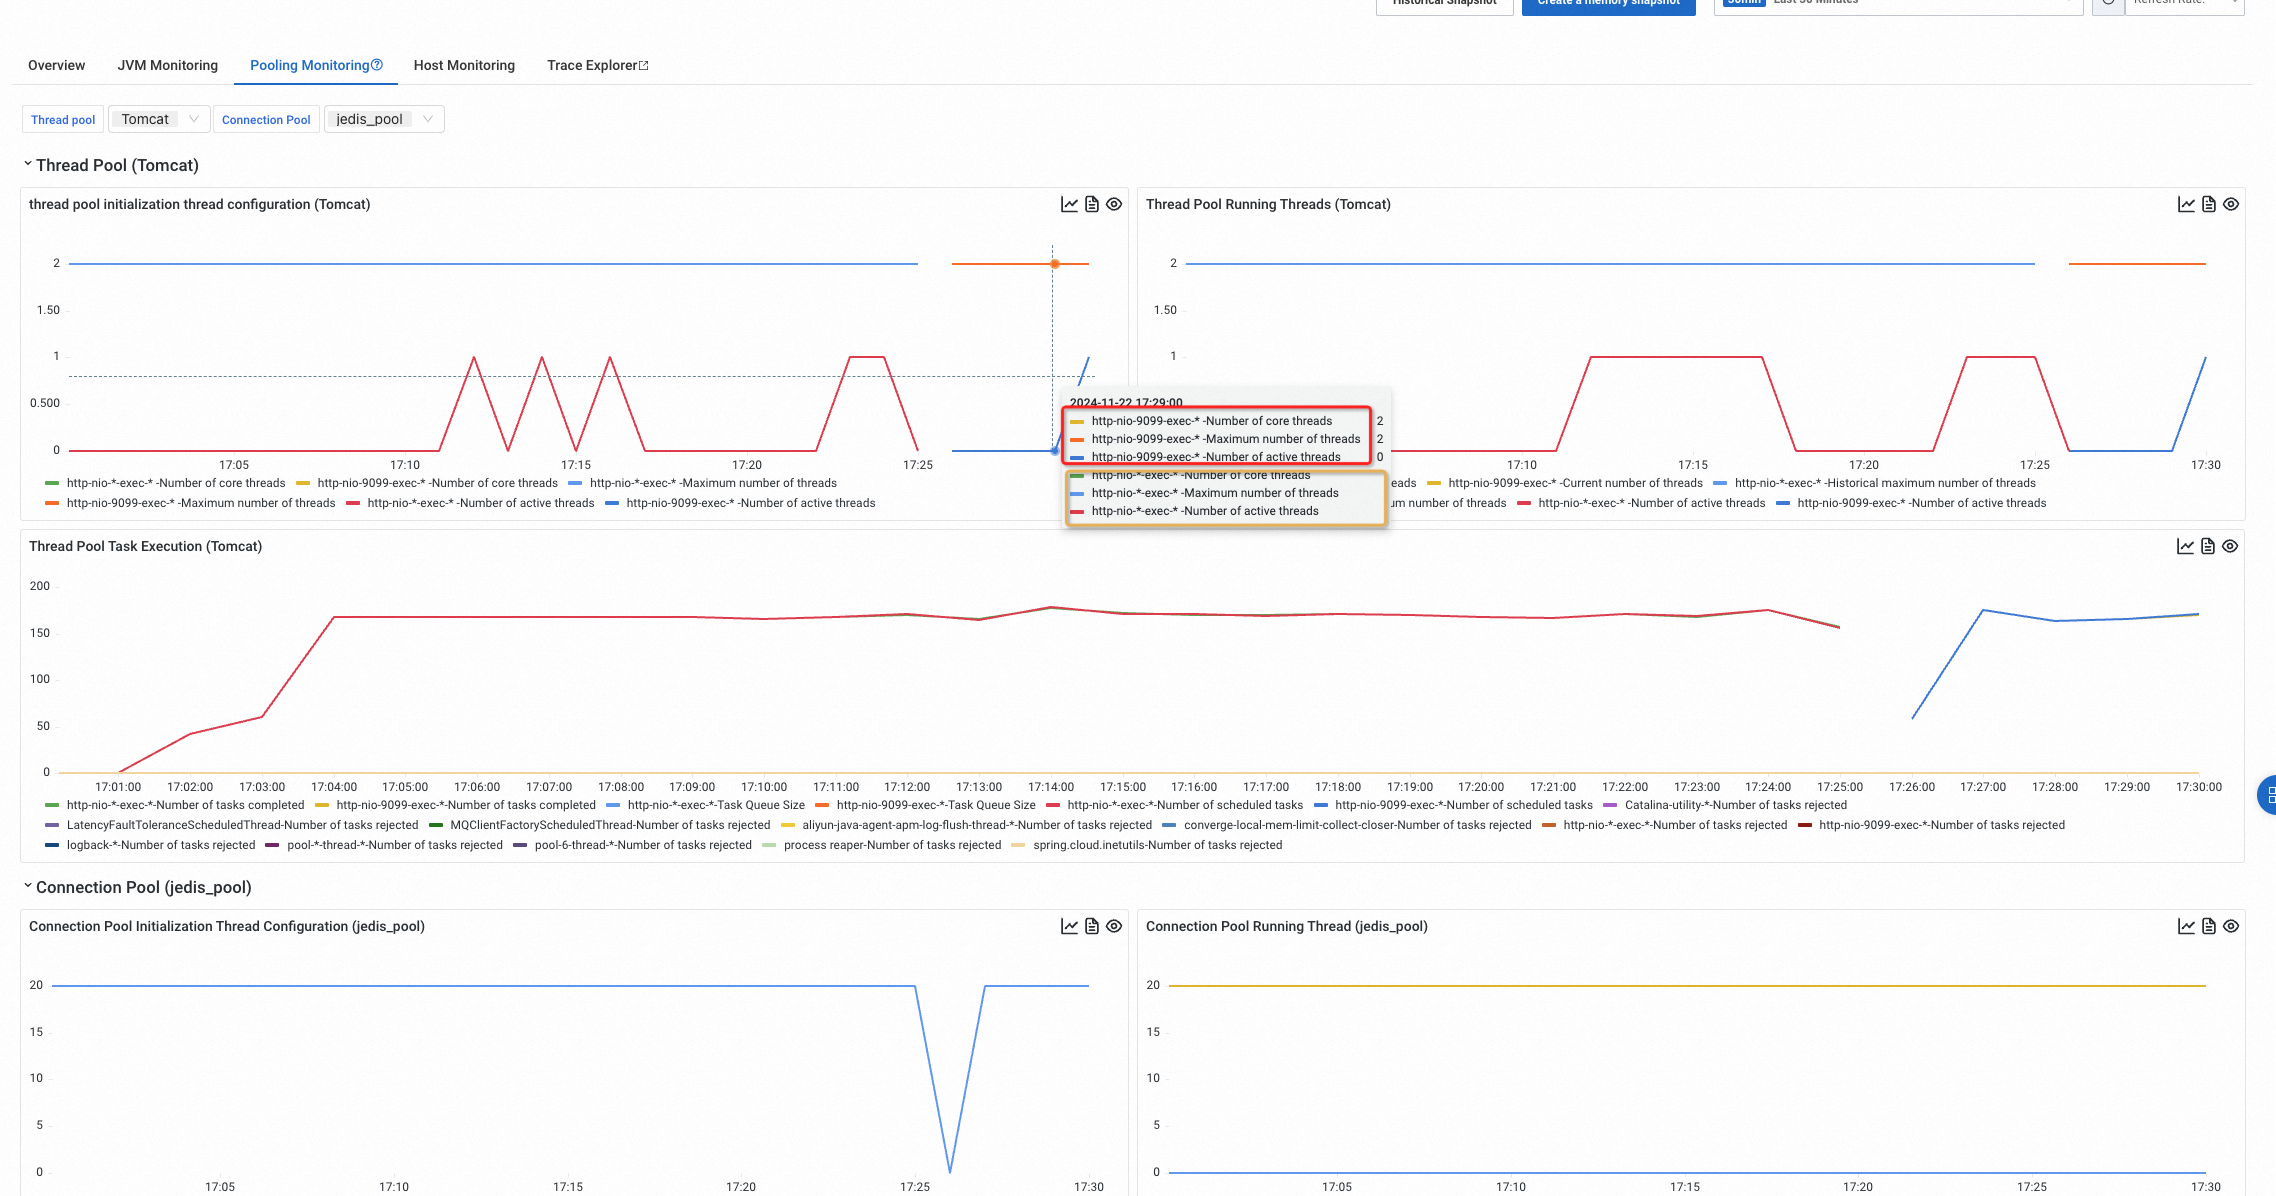
Pooling monitoring settings
Configure collection rules for thread pools and connection pools.
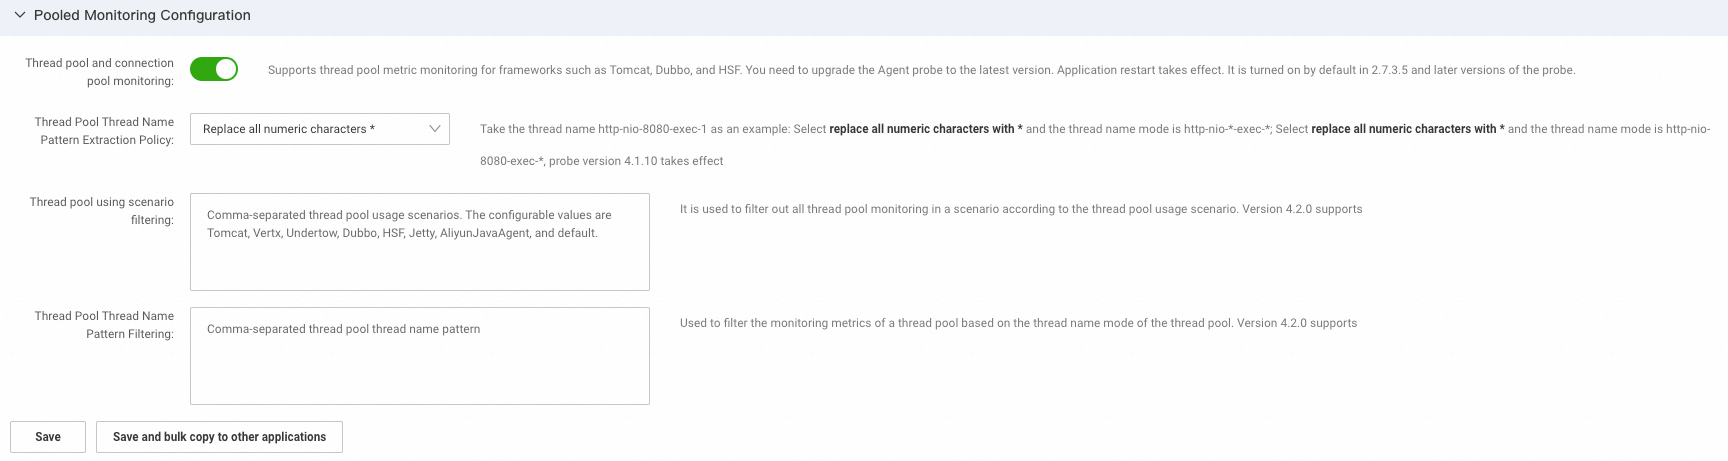
Thread pool and connection pool monitoring
Monitor thread pool metrics in frameworks such as Tomcat, Dubbo, and High-speed Service Framework (HSF). To enable this feature, upgrade the agent to the latest version.
Thread Pool Thread Name Pattern Extraction Policy
By default, all numeric characters in thread names are replaced with *. Adjust this to replace only the trailing numbers.
This matters when your application starts multiple Dubbo providers with different listening ports. With the default policy, thread pools from different providers may be merged because their extracted thread name templates are identical. Adjusting the policy helps distinguish between them.
Example: A Tomcat thread pool displays as http-nio-*-exec-* by default. After adjustment, it becomes http-nio-9099-exec-*.
Thread pool usage scenario filtering and thread pool thread name pattern filtering
Exclude specific thread pools from metric reporting based on their usage scenarios and thread name patterns.
This setting requires Java agents of V4.2.0 or later.
Thread pool usage scenario: The context in which the thread pool is used. Supported values: Tomcat, Vert.x, Undertow, Dubbo, Jetty, AliyunJavaAgent, and default.
AliyunJavaAgentrepresents the thread pool used by the agent.defaultrepresents other unclassified thread pools.Thread pool thread name pattern: The pattern derived by replacing numeric parts of thread names with
*. For example,http-nio-*-exec-*.
| Attribute | Detail |
|---|---|
| Affected data | Thread pool metrics |
| Affected features | The Thread Pool Monitoring tab and alerts configured based on thread pool metrics |
| Format (scenario) | Scenario names separated by commas. Example: AliyunJavaAgent,Jetty |
| Format (pattern) | Thread name patterns separated by commas. Uses exact match only -- rule-based matching is not supported. Example: Catalina-utility-*,DubboServerHandler-*-thread-* |
| Default | None |
Example: Setting the scenario filter to AliyunJavaAgent,Jetty and the pattern filter to Catalina-utility-* means that all thread pool data for the AliyunJavaAgent scenario is not reported, and in other scenarios, thread pools matching Catalina-utility-* are also excluded.
Span attribute settings
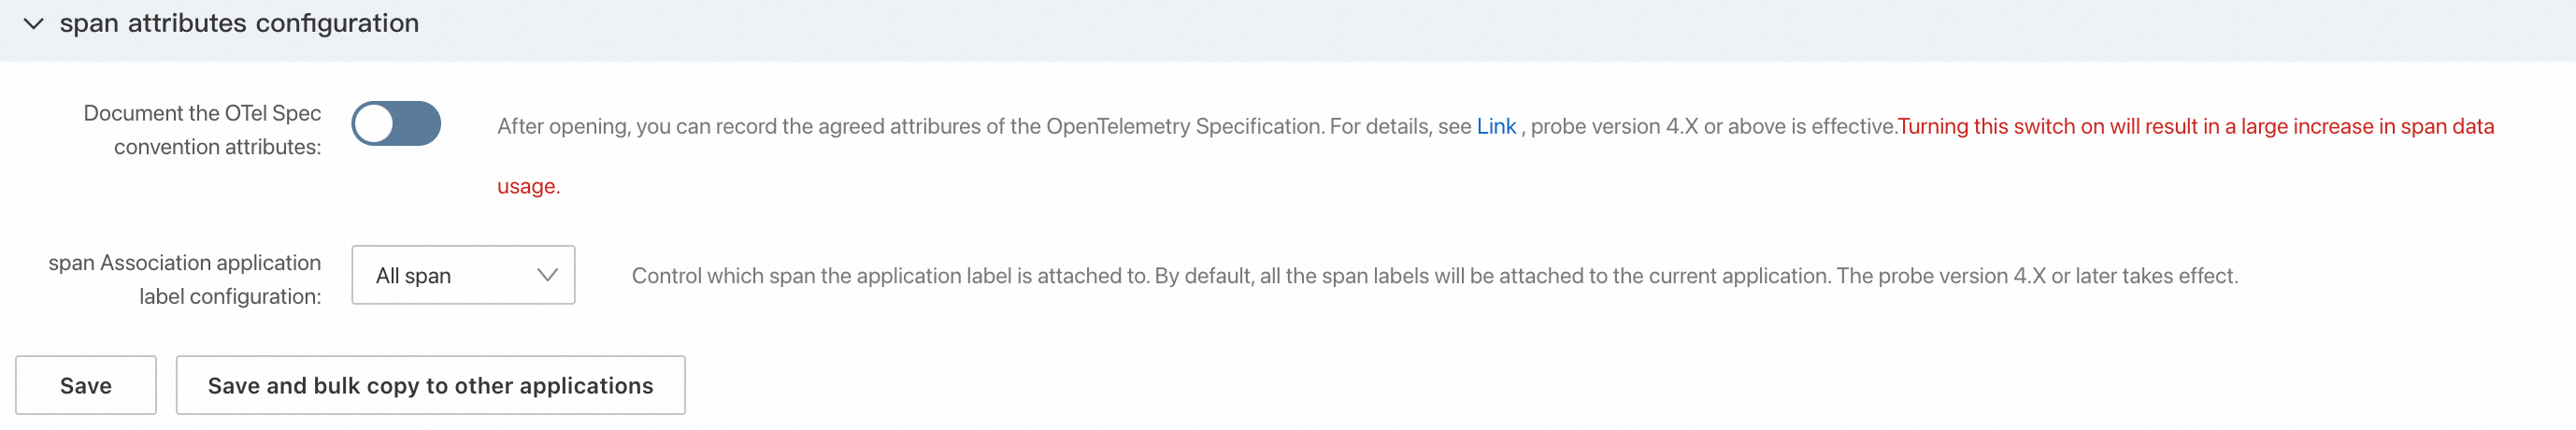
Record OTel Spec conventional attributes
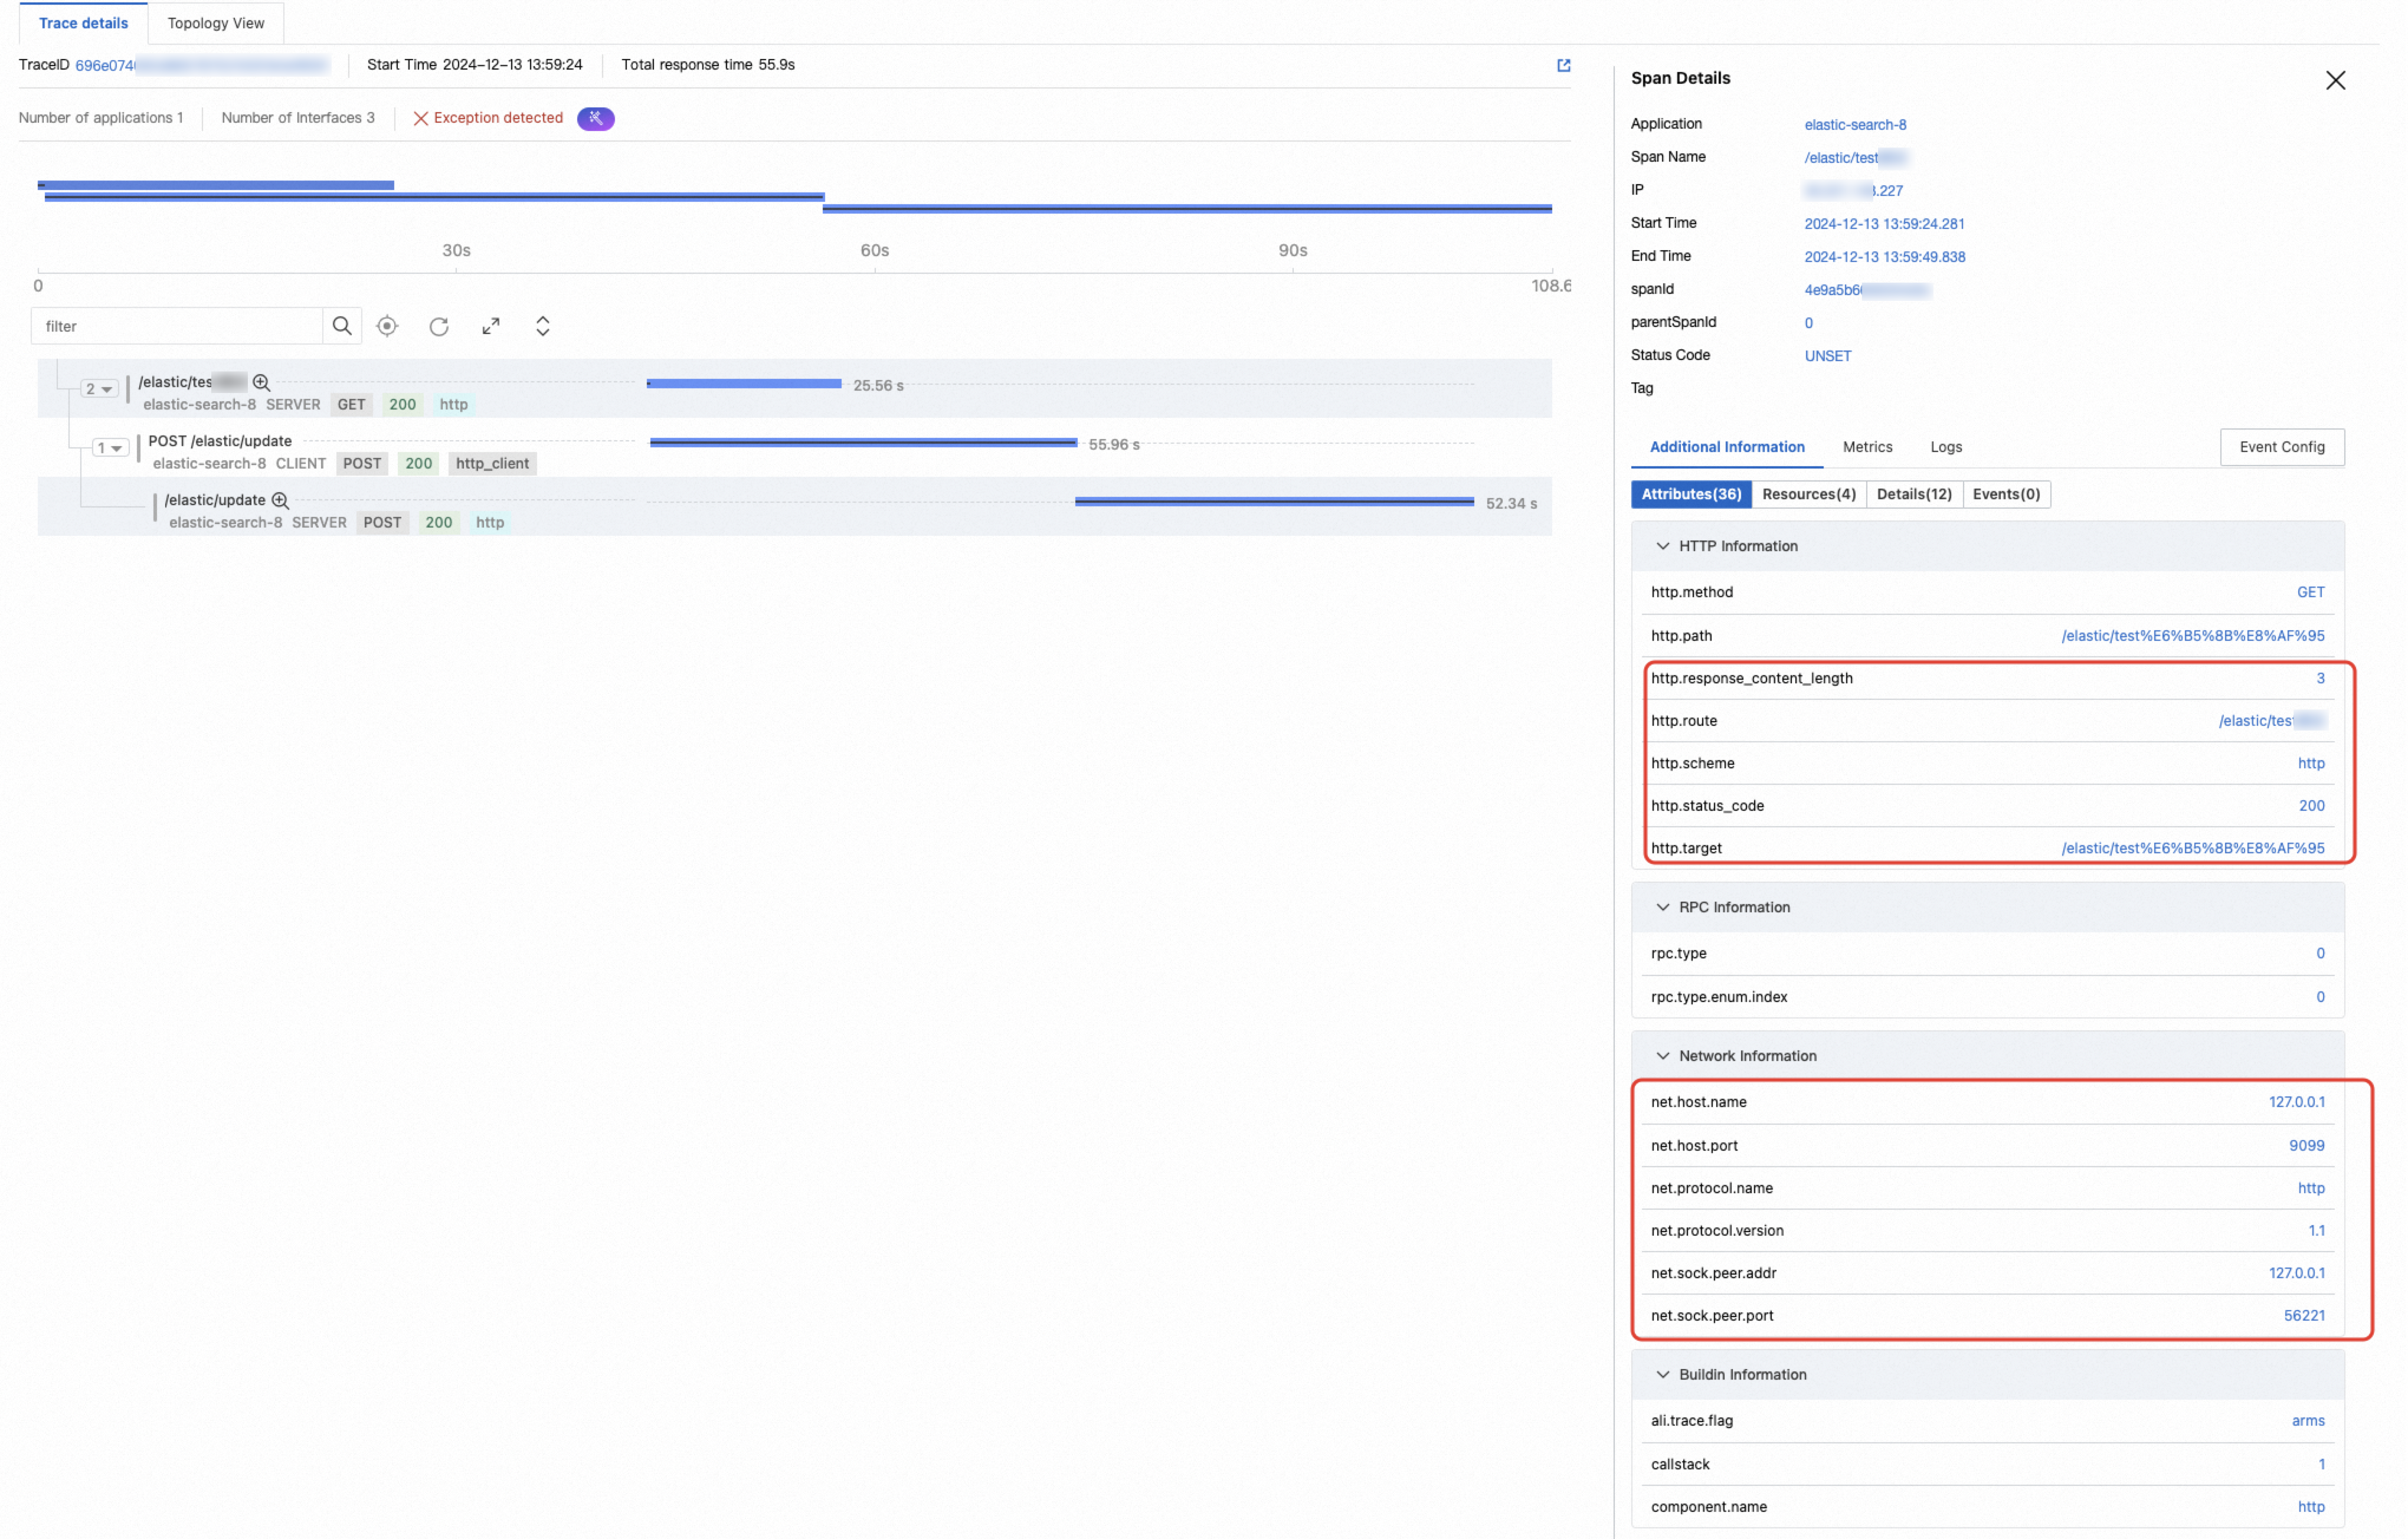
The OpenTelemetry Specification defines attributes that each plug-in type should include in generated spans. To reduce data volume, the ARMS agent does not record these attributes by default. Enable this setting to add them.
For details on the additional attributes added by each framework, see OpenTelemetry Specification.
The following example shows an HTTP Server span. The attributes within the red box are added after enabling this switch.
Span association application label configuration
Controls which spans include application labels. Application labels are configured on the Applications page. By default, all spans include application labels. To reduce data volume, attach labels only to entry spans. Entry spans typically include HTTP Server, RPC Server, message consumption, and scheduled tasks.
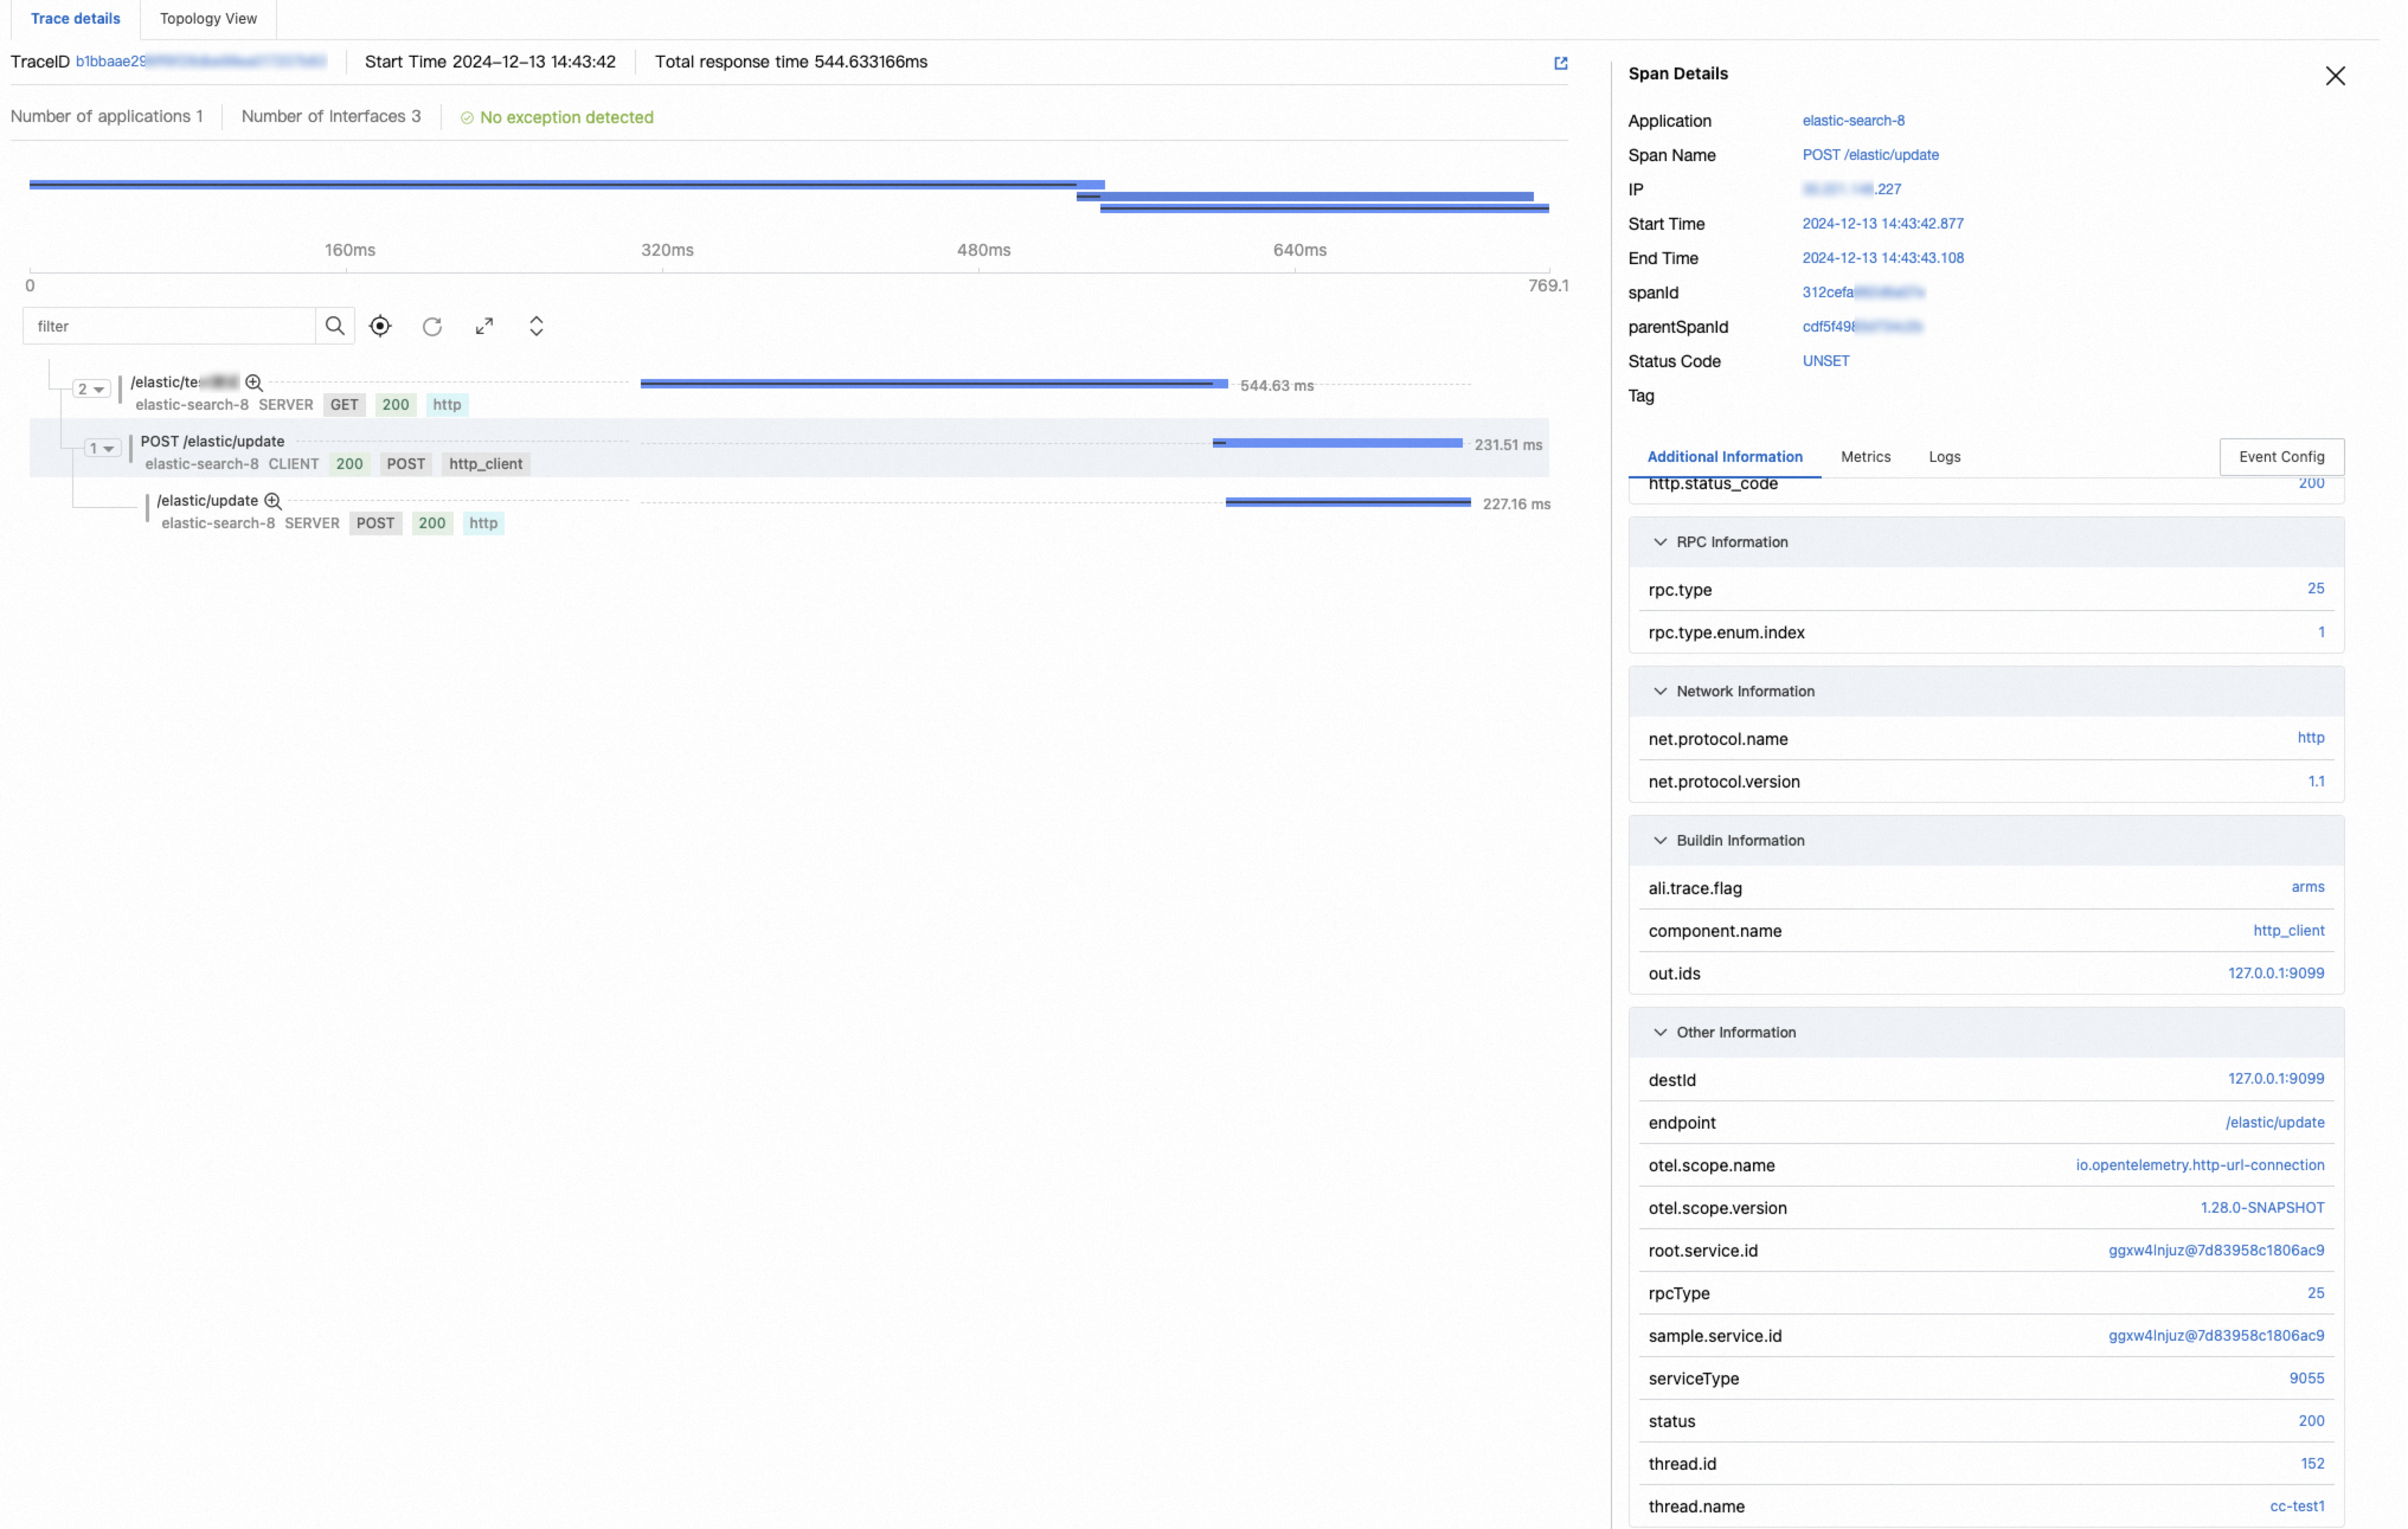
The following figure shows the effect when labels are attached only to entry spans. For an application with a label pair test1:value1:
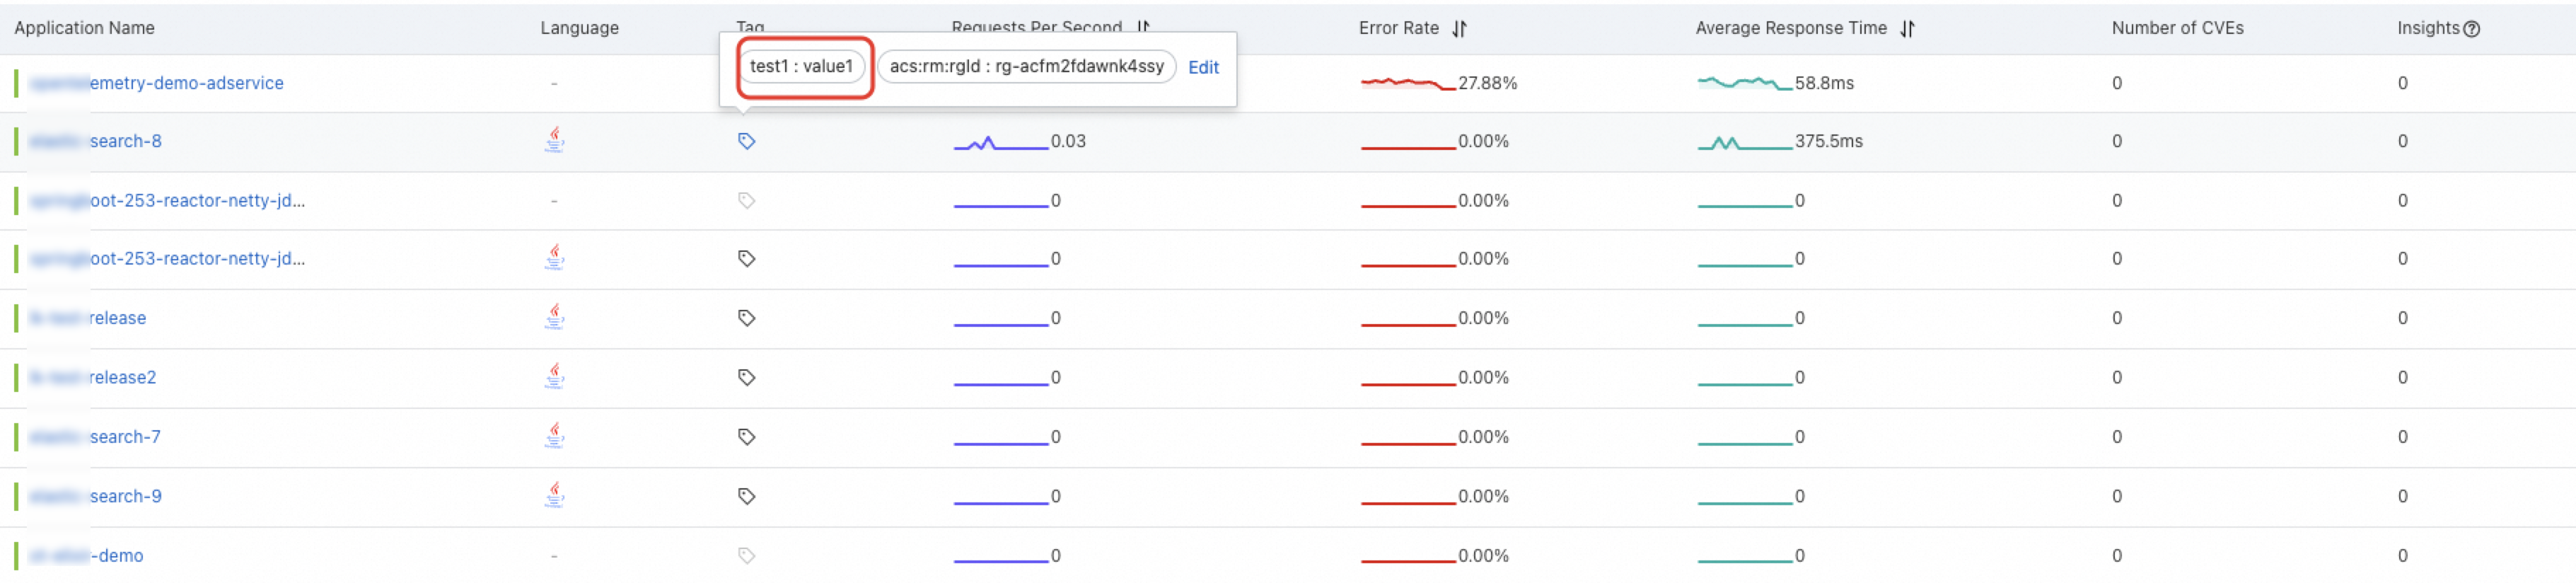
Entry spans contain the label attributes:
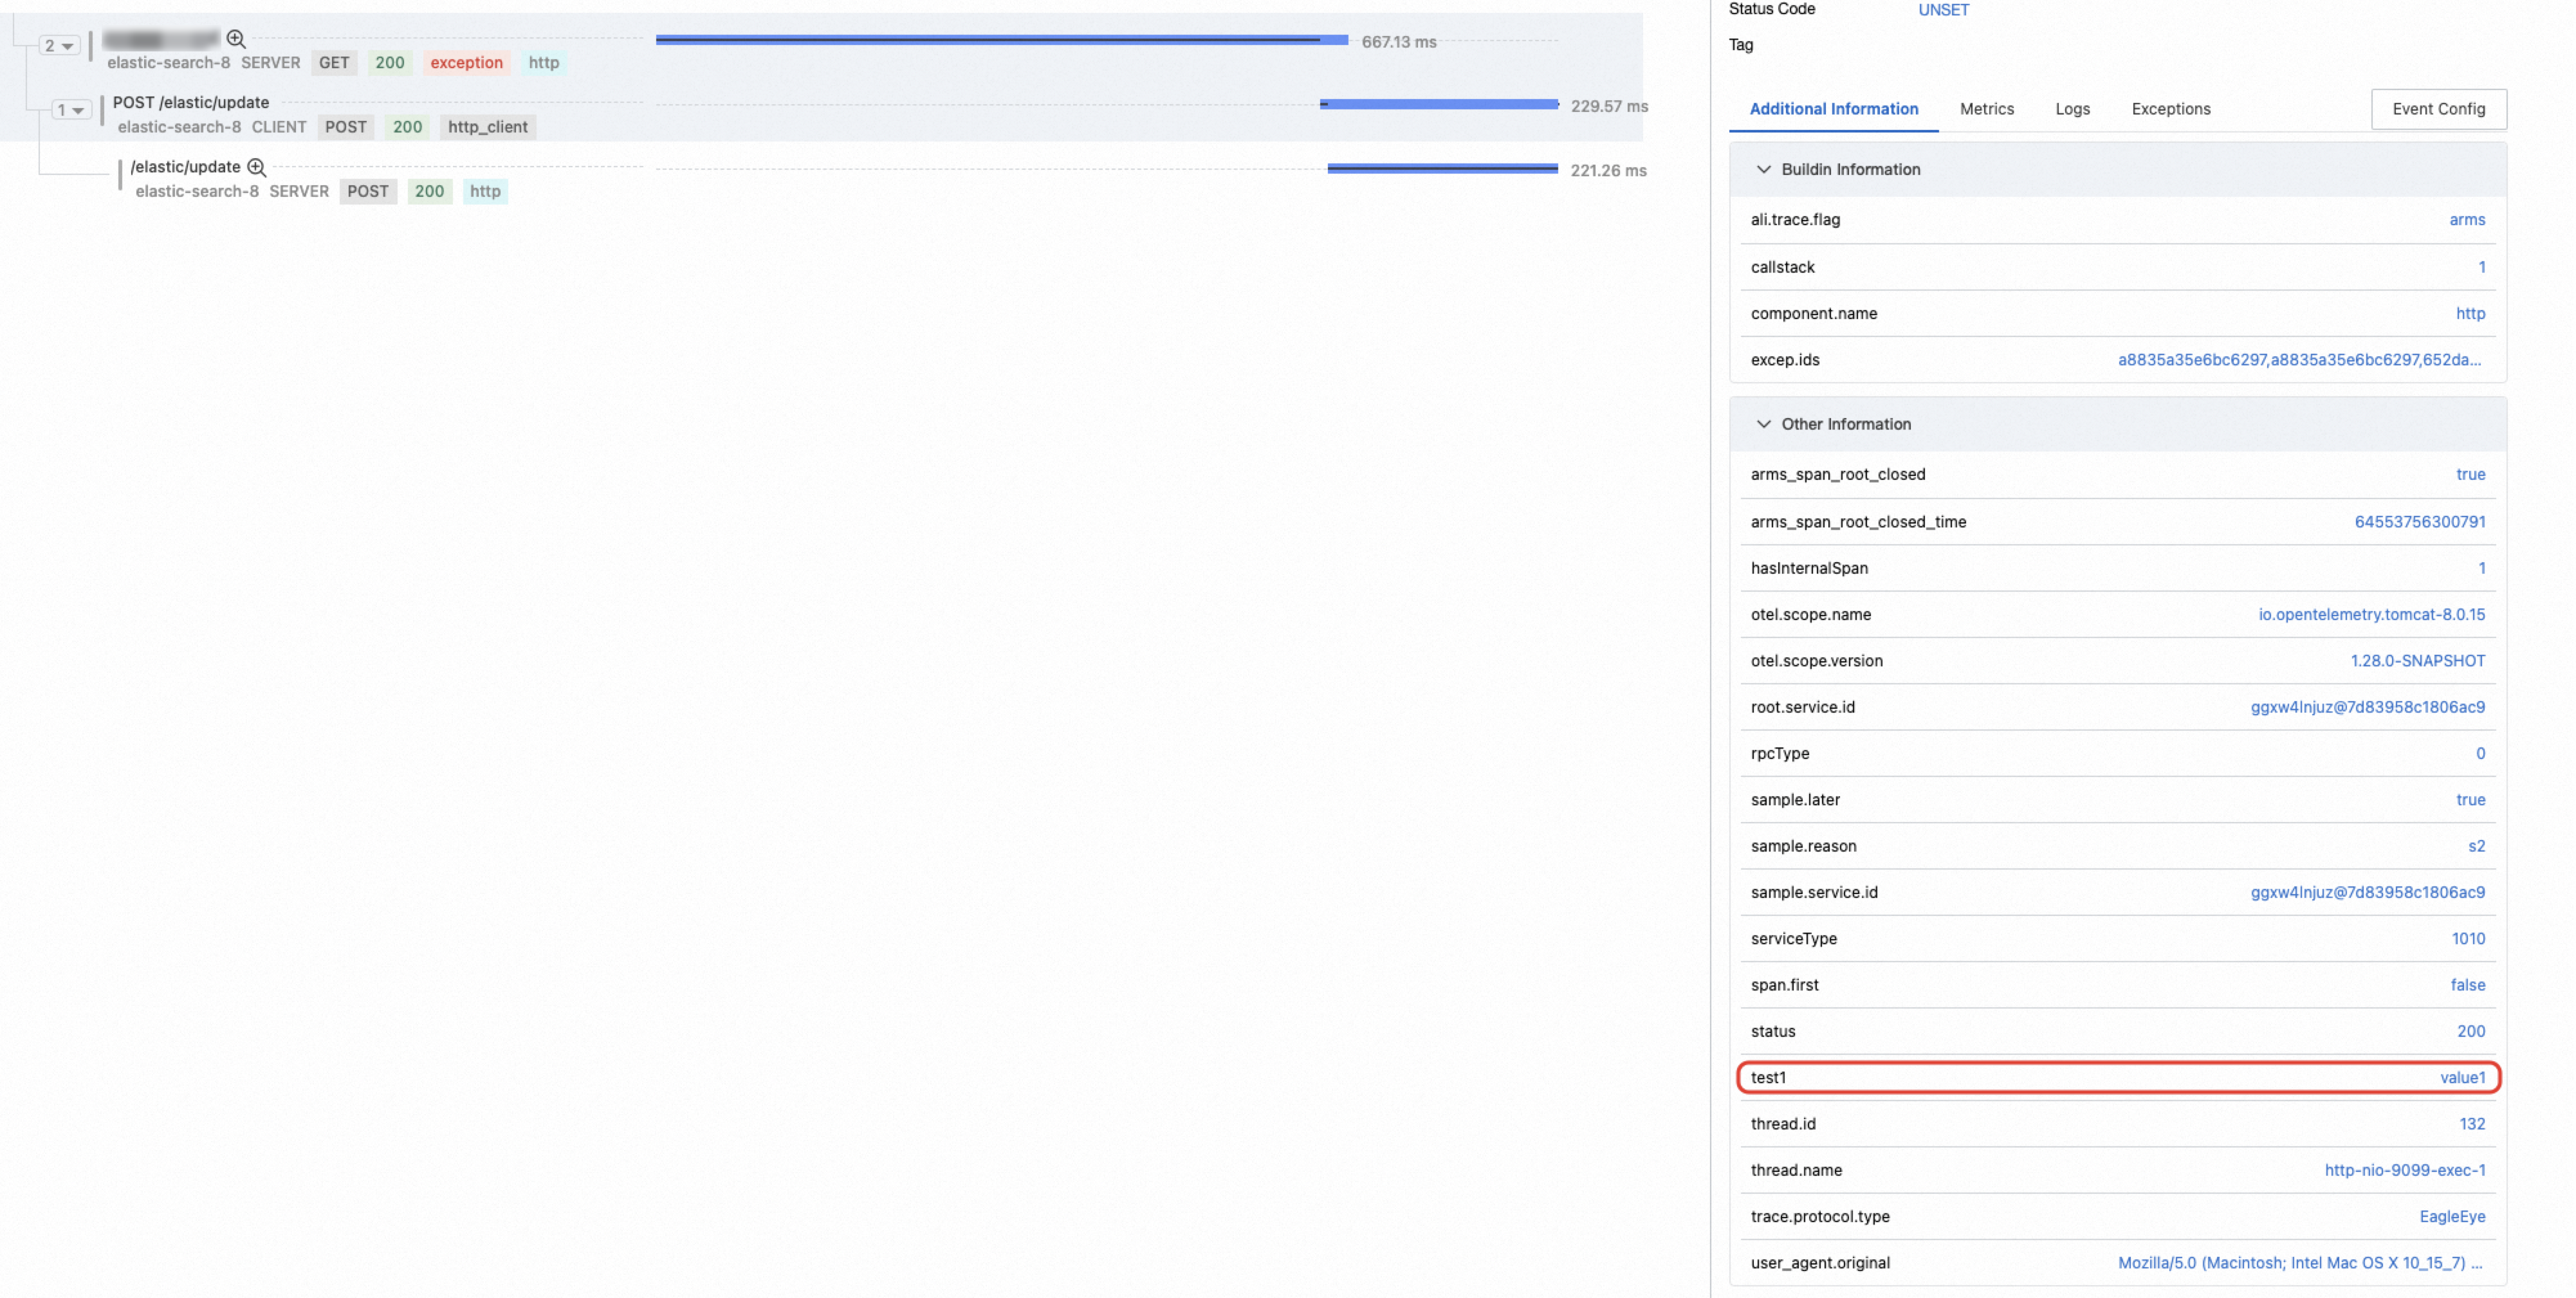
Non-entry spans do not contain the test1:value1 attributes:
Advanced settings
Configure additional agent behavior including method stack depth, trace compression, and asynchronous context propagation.
| Setting | Description | Default | Maximum |
|---|---|---|---|
| Quantile Statistics | Enable or disable quantile statistics. | -- | -- |
| Maximum retention length of method stack | Maximum stack depth retained. | 128 | 400 |
| Trace compression | Simplifies repeated call spans, such as those in loops. | -- | -- |
| Maximum display length of request input parameters | Maximum character length for displaying request parameters. | 512 characters | 2,048 characters |
Asynchronous pass-through scan package name
To monitor asynchronous tasks, add a scan package for asynchronous propagation. When a Runnable, Callable, or Supplier object is created within the specified package, the agent automatically captures the current thread's trace context and propagates it to the new thread during task execution.
Include TraceId in HTTP response
Returns the eagleeye-traceid field in response headers for HTTP requests.
JVM GC Trigger Root Cause
Collects the root causes of JVM garbage collection (GC) triggers. View the results on the JVM Monitoring page. For details on GC trigger root causes, see GC-related metrics.
Copy settings to other applications
To apply the same configuration to other applications, copy settings in bulk.
Copy a single section to other applications
In the target section, click Save and bulk copy to other applications.
If the Current settings not saved dialog box appears, click OK to save the settings first, then click Save and bulk copy to other applications again.
Select the target applications and click OK.
Copy all settings to other applications
At the bottom of the page, click Save and bulk copy to other applications.
If the Current settings not saved dialog box appears, click OK to save first, then click Save and bulk copy to other applications again.
Select the target applications and click OK.
Global default configurations
Save the current settings as global defaults so that new applications use them automatically.
Saving global defaults creates a point-in-time snapshot. Subsequent changes to the source application are not synchronized automatically. To update the defaults, save them again.
At the bottom of the page, click Save current app settings as global default configuration.
If the Current settings not saved dialog box appears, click OK to save first, then click Save current app settings as global default configuration again.
Click Confirm.
FAQ
Why do switch settings not take effect?
Check whether the setting has a minimum agent version requirement.
If a version requirement exists, verify that your agent version meets it. If the version is compatible but the setting still does not take effect, check the agent logs for configuration-related entries.
If no version requirement exists, check the agent logs for configuration push entries:
V3.x agent: Search for
[Diamond] receive. If this entry appears, the configuration was pushed successfully.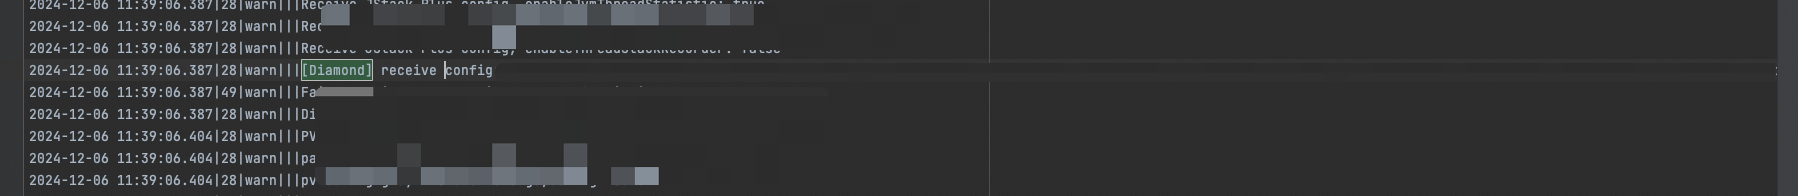
V4.x agent: Search for
config update. If this entry appears, the configuration was pushed successfully.
Why does the adjusted sample rate not take effect?
The sample rate only affects traces that originate from this application. If a request already carries a trace context, the application uses the existing context and its sampling flag -- your sample rate setting does not override it.
Why are lambda expressions not supported with the asynchronous pass-through scan package?
Upgrade the agent to V4.x. This version supports automatic asynchronous context pass-through without additional code changes or configuration.
Why do global default configurations not apply to new applications?
Global defaults are a point-in-time snapshot. Changes made after saving are not synchronized automatically. Save the defaults again to apply updated settings to new applications.
Why does filtering the /error interface not take effect?
For agents earlier than V3.2.0, interface filtering runs at the entry point of a call. The /error path is generated by the framework after an error occurs, bypassing the initial filter. Upgrade to V3.2.0 or later to resolve this.
Why are URLs still converged after disabling URL convergence?
The URL Convergence Settings on the Custom Configurations tab apply only to V3.x agents. For V4.x agents, go to Configuration > Convergence Settings to configure convergence.
For applications using Spring MVC with agents earlier than V3.x, upgrade the agent to V3.x or later.