Continuous profiling helps you identify performance bottlenecks in your Java applications related to CPU, memory, and I/O. It breaks down performance data by method name, class name, and line number. You can use this data to optimize applications, reduce latency, increase throughput, and lower costs. This topic describes how to enable continuous profiling in ARMS and view the profiling data.
ARMS application monitoring provides a new monitoring details page for users on the new billing plan. For more information about the new billing plan, see Product billing (New).
If you have not enabled the new billing plan, you can switch to the new monitoring details page by clicking Switch to New Version on the Apps page.
Performance tests show that when all continuous profiling features are enabled for a typical Spring Web application, the CPU overhead increases by about 5%, and off-heap memory usage increases by about 50 MB. The impact on GC and request latency is negligible. For more information, see the Performance Test Report for Continuous Profiling with Java Agent v4.x.
Prerequisites
-
Continuous profiling is available only for the Expert Edition and in the billing mode based on the volume of observable data written. To upgrade to the Expert Edition, see Pay-as-you-go. To change your billing method, see Change billing method.
-
Continuous profiling data is stored for only 7 days.
-
You must enable ARMS application monitoring for your application and upgrade the agent to v2.7.3.5 or later. For instructions, see Application monitoring overview and Upgrade the ARMS agent.
-
If your application's VPC has a policy that restricts access to Object Storage Service (OSS) buckets, you must update the policy. Continuous profiling uploads collected data to a dedicated OSS bucket named
arms-profiling-<regionId>for storage and processing. You must add this bucket to your policy's allowlist. Replace<regionId>with your application's region ID. For example, if your application is in the China (Hangzhou) region, the bucket name isarms-profiling-cn-hangzhou. -
Continuous profiling currently supports only OpenJDK and Oracle JDK. It does not support IBM OpenJ9 or Oracle GraalVM JDK.
Limitations
Operating system kernel
Linux 2.6.32-431.23.3.el6.x86_64 or later.
You can run the uname -r command to check your kernel version.
JDK version
Continuous profiling in ARMS uses the Java Virtual Machine Tool Interface (JVM TI) to get your application's method stacks. This allows it to obtain details about CPU and memory usage during runtime. However, JVM TI has a known crash issue that can cause applications to fail. This issue is fixed in OpenJDK 8u352/11.0.17/17.0.5 and Oracle JDK 11.0.21/17.0.9. The ARMS team has conducted extensive testing on earlier JDK versions and found that this issue is rare and occurs only in specific scenarios. Therefore, ARMS does not prevent you from using continuous profiling on unsupported JDK versions. You can temporarily enable the feature and use an IP whitelist to limit its scope. However, for application stability, we strongly recommend upgrading your JDK to a supported version. Using continuous profiling on older JDK versions carries a risk of application crashes.
Continuous profiling requires debug symbols in the JDK. Since Alpine base images are optimized for size, they often strip these debug symbols from the JDK, which prevents the feature from working correctly. If you need this feature, we recommend using a non-Alpine base image.
Recommended JDK versions for continuous profiling:
|
Type |
Version |
|
OpenJDK |
|
|
Oracle JDK |
|
Enable continuous profiling
-
Log on to the ARMS console. In the left-side navigation pane, choose .
-
At the top of the Application List page, select your target region, and then click the name of your target application.
NoteThe icons in the Language column have the following meanings:
 : A Java application connected to application monitoring.
 : A Go application connected to application monitoring.
 : A Python application connected to application monitoring.
-: An application connected to Managed Service for OpenTelemetry.
-
In the top navigation bar, choose .
-
In the Continuous profiling section, turn on the main switch, and then set the IP whitelist or IP range.
-
Click Save.
View continuous profiling data
-
Log on to the ARMS console. In the left-side navigation pane, choose .
-
At the top of the Application List page, select your target region, and then click the name of your target application.
NoteThe icons in the Language column have the following meanings:
: A Java application connected to application monitoring.: A Go application connected to application monitoring.: A Python application connected to application monitoring.-: An application connected to Managed Service for OpenTelemetry.
-
In the top navigation bar, choose .
-
In the instance list on the left, select your target instance. Then, on the right side of the page, set the time range for the data you want to view.
-
On the Search tab on the right, you can filter data and view aggregated analysis by performing the following steps:
-
In the Time window size area, select a snapshot interval. Then, drag over the chart to select a snapshot time range.
-
From the data type drop-down list, select CPU, JVM Heap, or JVM GC.
-
The snapshot list displays the data within the selected snapshot time range. Click Aggregation & Analysis in the upper-right corner to view snapshot details.
Figure 1. Performance analysis
The snapshot details page contains three tabs: Performance analysis, Metric list, and Snapshot list. On the Performance analysis tab, you can select an analysis type such as CPU Time from the drop-down list, and switch the view mode to Table, Both, or Flamegraph. The left side lists the time consumed by each method, and the right side shows the call stack in a flame graph.
-
The Self column shows the time or resources consumed by the method itself, excluding the time or resources consumed by its child methods. This helps you identify which methods spend a significant amount of time or resources internally.
-
The Total column shows the time or resources consumed by the method itself plus all of its child methods. This helps you understand which methods contribute the most to the time or resource consumption of the entire call stack.
To troubleshoot specific hotspot code, you can focus on the Self column or examine the wider bars at the bottom of the flame graph on the right. These wider bars represent the root cause of high resource consumption in the upper layers of the stack and often indicate system performance bottlenecks. You should pay close attention to them.
Figure 2. Metric list
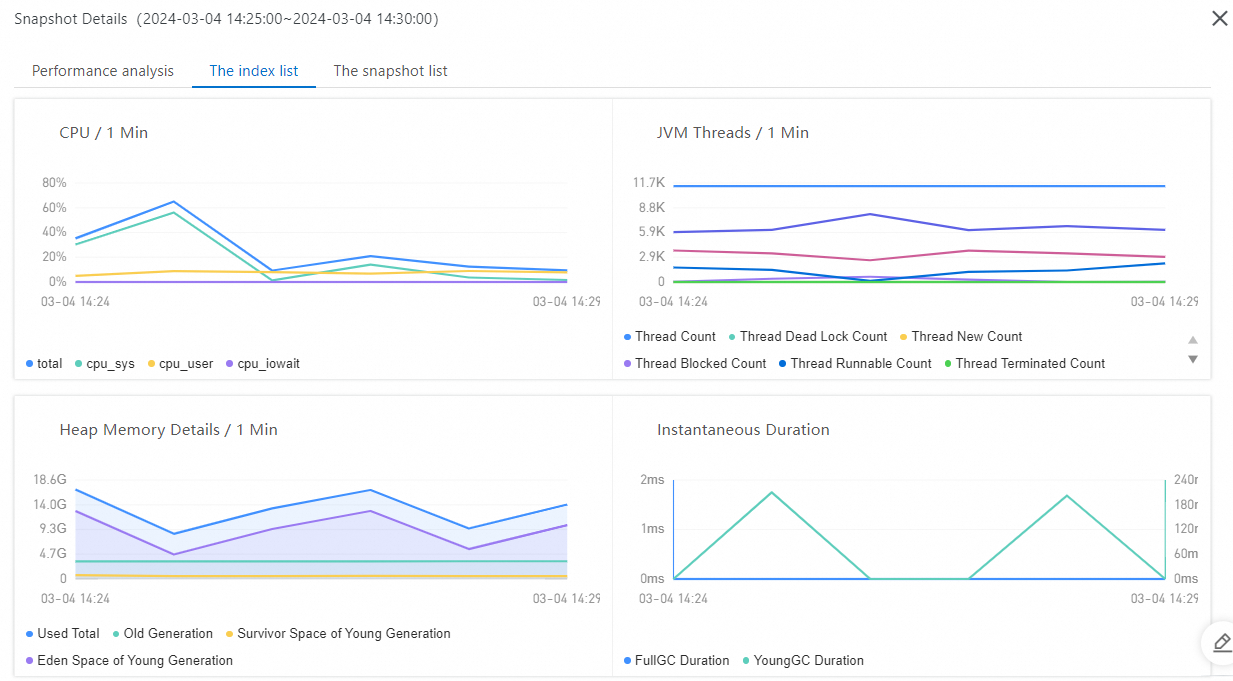
Figure 3. Snapshot list
The Snapshot list tab displays the snapshot data of each point in time, including the following columns:
-
Time
-
Snapshot size
-
CPU CORES
-
Memory allocations
-
Memory (TLAB)
-
-
Related documents
You can use the continuous profiling feature to troubleshoot high CPU and memory utilization issues. For more information, see the following topics:
For common issues when using continuous profiling, see FAQ.