After an Application Real-Time Monitoring Service (ARMS) agent is installed in an application, ARMS starts to monitor the application. On the Application List page, you can view key metrics, such as the number of requests per second, error rate, and response time, along with the global topology and health of the application.
Applications
The Applications tab on the Application List page displays basic metrics of all applications that are integrated with ARMS, such as the number of requests per second, error rate, and response time.

Click the name of an application to view its details and customize its settings. For more information, see View monitoring details (new).
Click
 in the Tag column of an application to bind a tag to the application. For information about how to create a tag, see Add a custom tag.
When you create tags to filter data from other applications (such as scenario-based analysis data), name the tags with only letters, digits, and underscores (_), and start with a lowercase letter, following the naming conventions of open source Prometheus.
Icons in the Language column indicate the application's programming language:
 : Java
 : Go
: Go : Python
- (Hyphen): an application monitored in Managed Service for OpenTelemetry
Global topology
The Global Topology tab on the Application List page displays the call relationships among all connected applications in a selected time period.

Health
The Global Health View tab on the Application List page assigns each application a color-coded square (red, yellow, or green) based on preset thresholds.

You can perform the following operations:
Click Threshold Settings to set the thresholds for uncleared alerts, new exceptions, and the average duration.
After you set the thresholds, the color priority of the squares is as follows: red > yellow > green. If you set different thresholds on the same square, the color indicating a higher priority will be displayed. Assuming that you respectively set Uncleared Alerts, New Exceptions, and Average Duration to yellow, green, and red, the square will be red.

Click a square to view the uncleared alerts, new exceptions, and the average duration of an application in the selected time period.

FAQs
Why are there duplicate application names?
Application names can duplicate in the following scenarios:
Two applications from different sources use the same name, such as a name created through cloud products like Enterprise Distributed Application Service (EDAS) and Serverless App Engine (SAE) during the integration with ARMS, and a name specified when you connect the application to ARMS.
Two applications under different language frameworks share one name.
Why can't RAM users see applications in the application list?
Resource Access Management (RAM) users granted the ReadOnlyAccess or AliyunARMSReadOnlyAccess system policy can only access the ARMS console but cannot view applications.
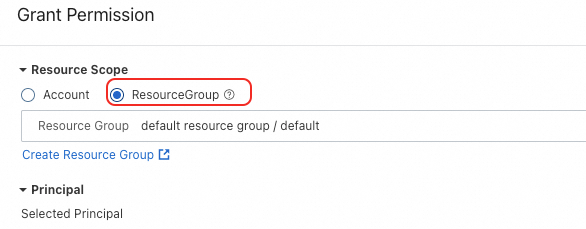
To let them view the applications, grant such users the ReadTraceApp permission, but set Resource Scope to ResourceGroup:

Success example:
