When your Java application runs across multiple instances, pinpointing which instance causes performance degradation or memory pressure requires instance-level visibility. After you install the ARMS agent, ARMS automatically collects infrastructure, garbage collection (GC), and JVM memory metrics per instance. Use the Instance Monitoring page to compare instance health, identify bottlenecks, and diagnose memory issues without switching between tools.
Prerequisite
An ARMS agent is installed for the application.
Application Monitoring provides a new application details page for users who have enabled the new billing mode. If you have not enabled the new billing mode, click Switch to New Version on the Application List page to access the new application details page.
Open the Instance Monitoring page
Log on to the ARMS console. In the left-side navigation pane, choose Application Monitoring > Application List.
Select a region at the top of the page, then click the application name.
In the top navigation bar, click Instance Monitoring.
The icons in the Language column indicate the integration method:
 Java application integrated with Application Monitoring
 Golang application integrated with Application Monitoring
 Python application integrated with Application Monitoring
- Application integrated with Managed Service for OpenTelemetry
Dashboard layout

The Instance Monitoring dashboard adapts to your deployment environment (ECS or containers) and organizes information into three areas:
| Area | Description |
|---|---|
| Quick filter (1) | Filter charts and the instance list by host address (and by cluster in container environments with Managed Service for Prometheus). |
| Trend charts (2) | View time-series charts for infrastructure metrics, GC, and JVM memory. |
| Instance list (3) | View per-instance metrics and access instance details or traces. |
Metrics by environment
Available metrics differ depending on whether your application runs on ECS or in containers, and whether the container environment is integrated with Managed Service for Prometheus.
Trend chart metrics
| Metric category | ECS | Container (Prometheus) | Container (ARMS self-collection) |
|---|---|---|---|
| CPU usage | Yes | Yes | Yes |
| Memory usage | Yes | Yes | Yes |
| Disk usage | Yes | No | No |
| Full GC and Young GC | Yes | Yes | Yes |
| Heap and non-heap memory | Yes | Yes | Yes |
For ECS environments, use the drop-down list next to each infrastructure chart title to switch between average and maximum values.
For GC charts, switch between GC count and average GC duration. For JVM memory charts, switch between heap and non-heap memory views.
Instance list columns
| Column | ECS | Container (Prometheus) | Container (ARMS self-collection) |
|---|---|---|---|
| Instance IP | Yes | Yes | Yes |
| CPU utilization | Yes | Yes (+ request, limit) | Yes (usage only) |
| Memory utilization | Yes | Yes (+ request, limit) | Yes (usage only) |
| Disk utilization | Yes | Yes (+ limit) | No |
| Load | Yes | Yes | Yes |
| Full GC count | Yes | Yes | Yes |
| Young GC count | Yes | Yes | Yes |
| Heap memory usage | Yes | Yes | Yes |
| Non-heap memory usage | Yes | Yes | Yes |
| RED metrics (requests, errors, avg response time) | Yes | Yes | Yes |
In the Container (Prometheus) environment, CPU utilization, memory utilization, and disk utilization show - when no limit is set for the resource.
Container environment requirements
With Managed Service for Prometheus: Container metrics come from Managed Service for Prometheus. To set up the integration, see Container Observability.
Without Managed Service for Prometheus: Upgrade the Application Monitoring probe to version 4.1.0 or later. Earlier probe versions do not report basic container metrics. For probe version details, see Probe (Java Agent) version guide.
Chart interactions
Each trend chart supports two actions:
Click
 to view metric statistics over a time range or compare the same time range across different dates.
Click
 to toggle between column charts and trend charts.
Instance list actions
Click an instance IP (or Details in the Actions column for container environments) to open instance details.
Click Trace in the Actions column to view trace details. For more information, see Trace analysis.
ARMS collects JVM metrics through JMX. The non-heap memory regions reported by ARMS are fewer than those in the actual Java process. As a result, the sum of heap and non-heap memory in ARMS may differ from the RES value shown by the top command. For details, see JVM monitoring memory details.
Instance details
Click an instance IP to open the details page, which contains the following tabs.
Overview
The Overview tab shows the request count, error count, average response time, and slow call information for the selected interface.

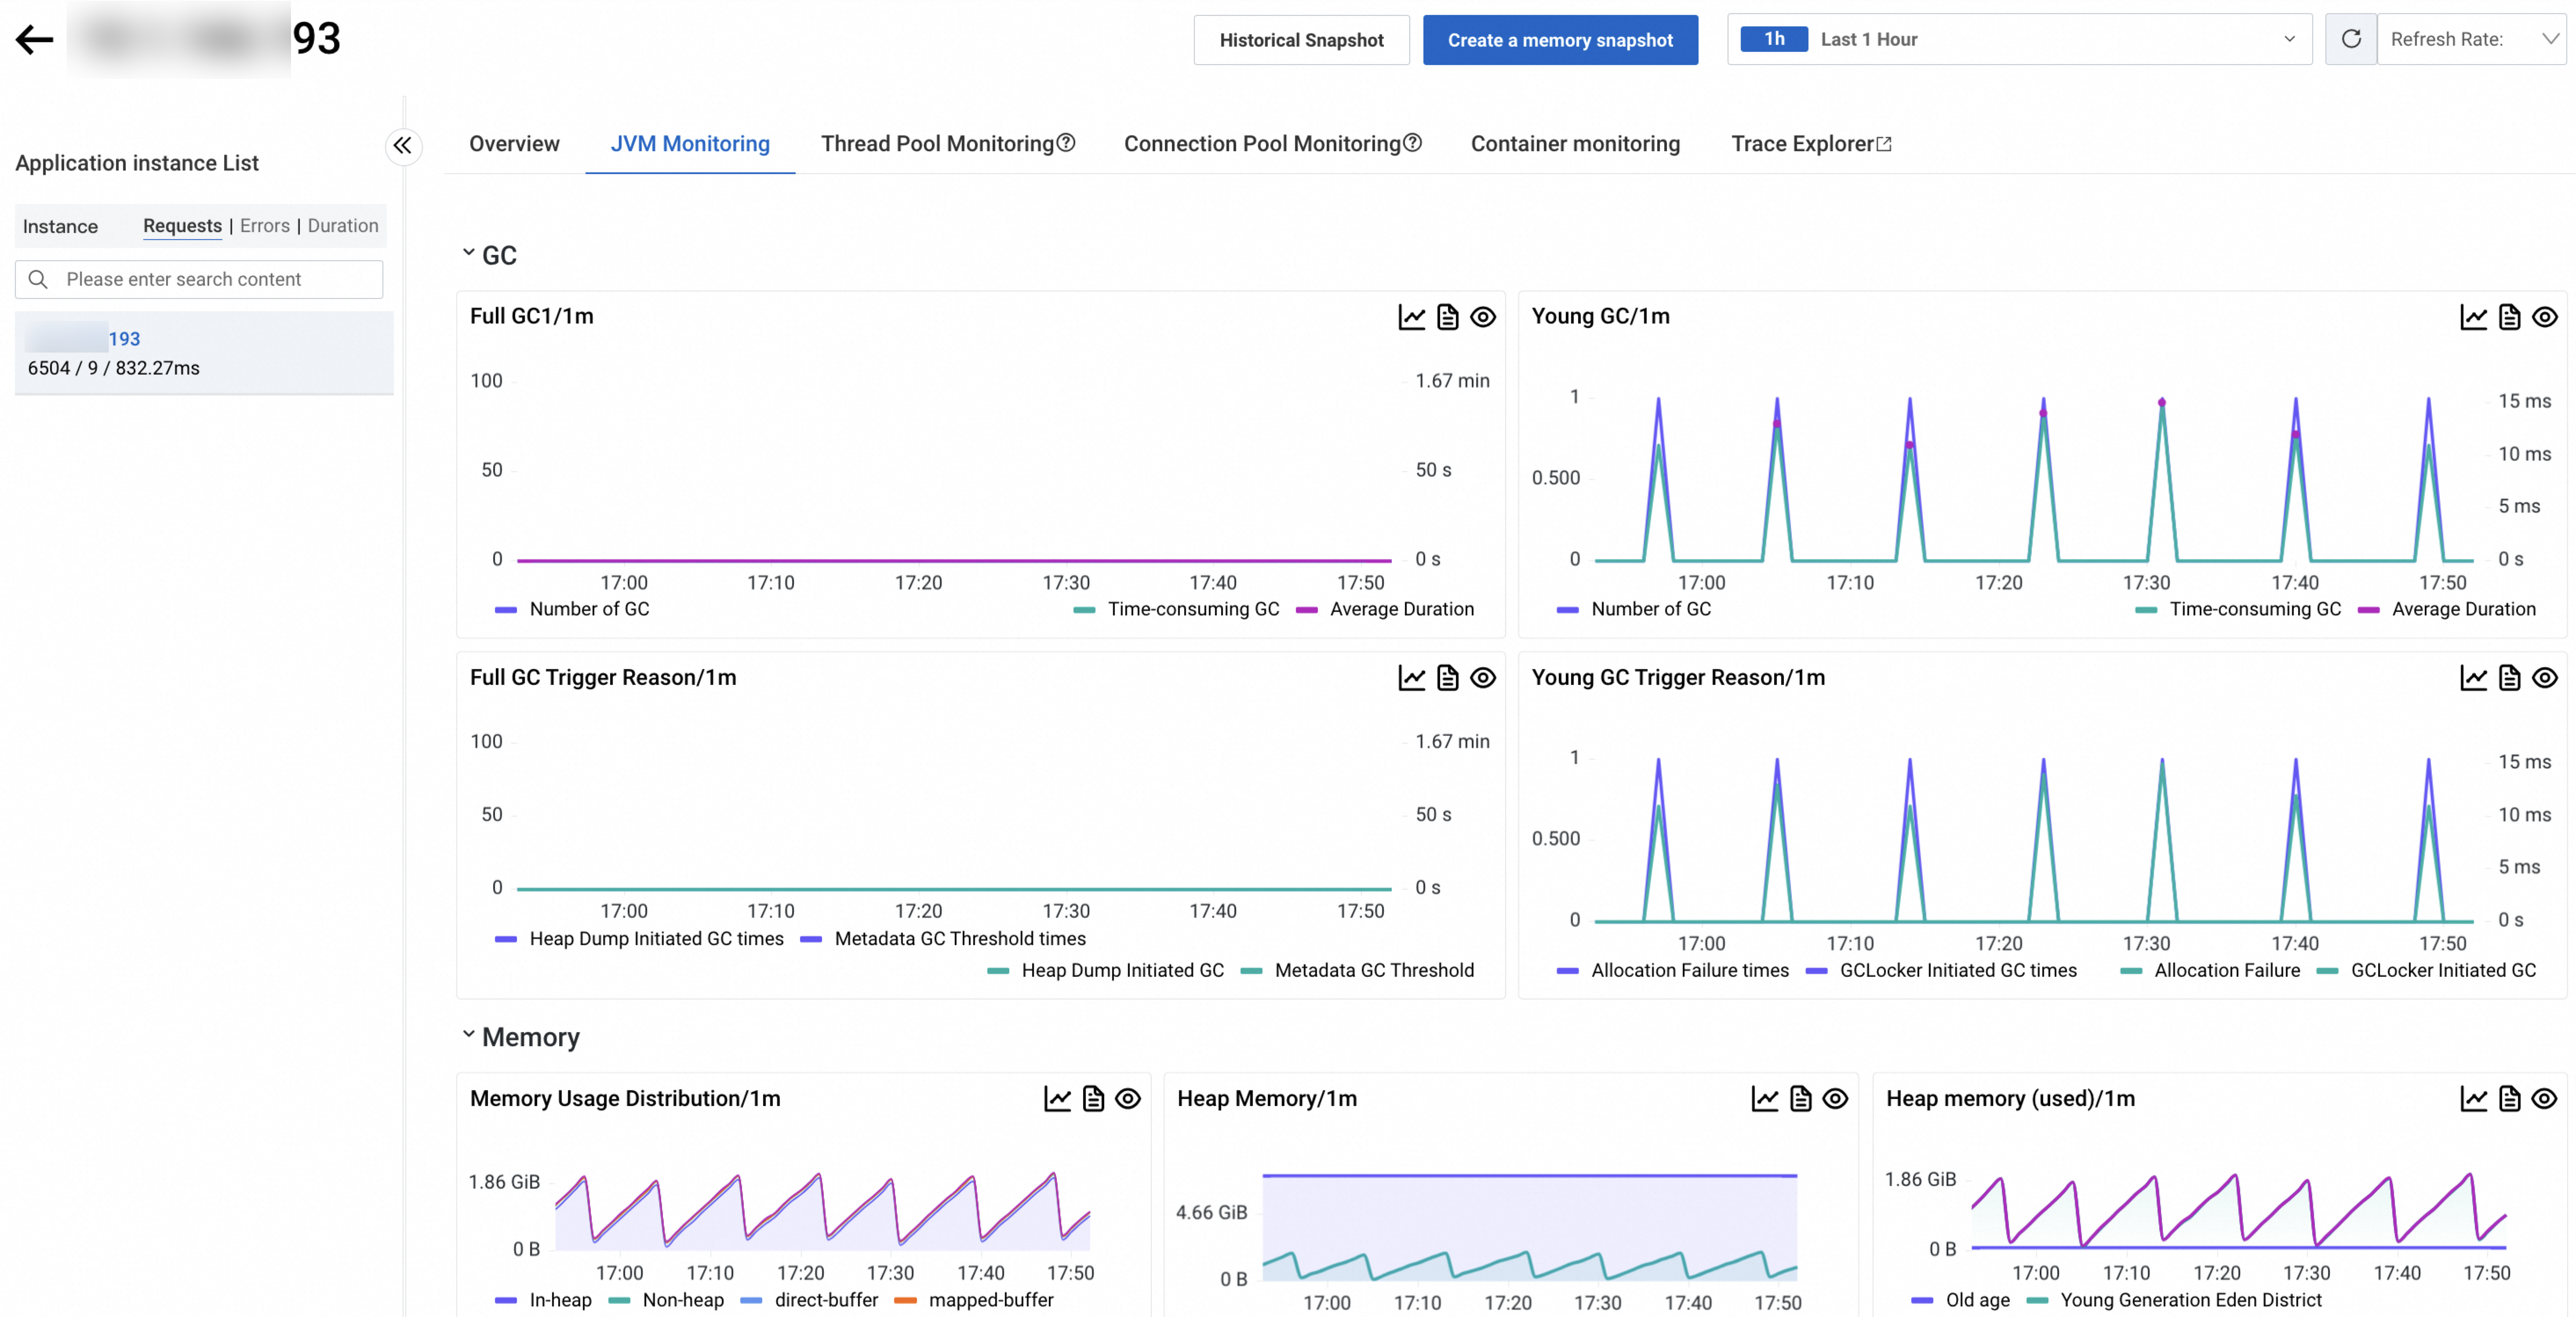
JVM monitoring
The JVM Monitoring tab shows GC, memory, thread, and file descriptor metrics for the selected instance.
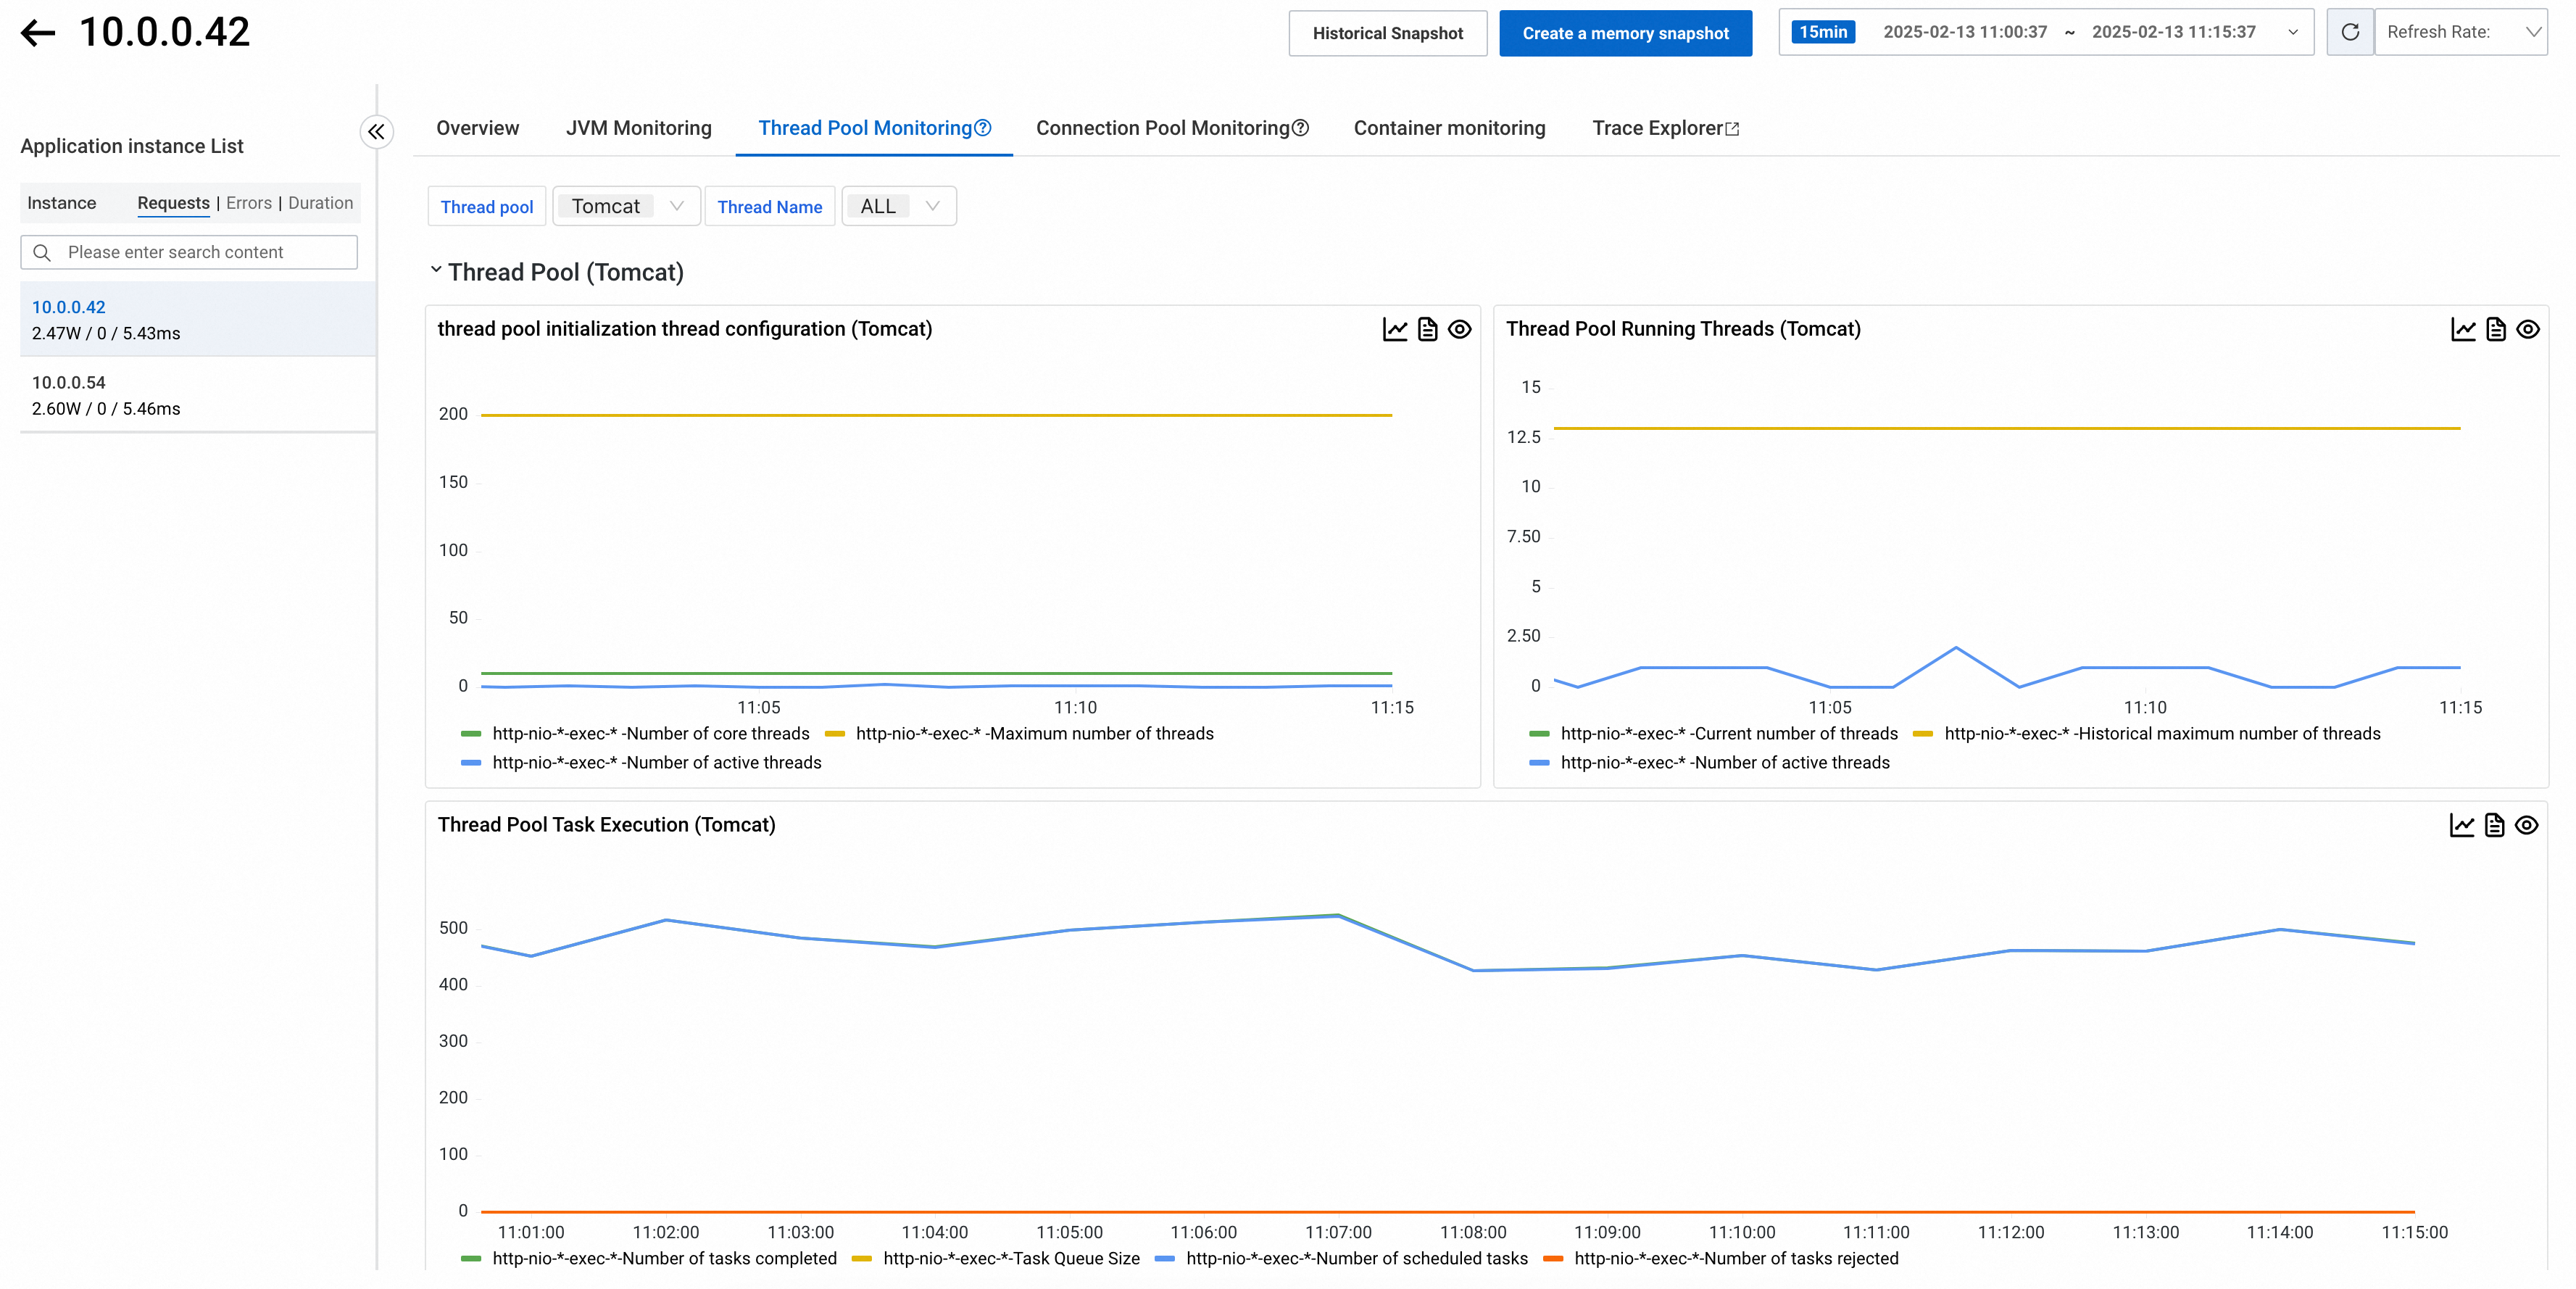
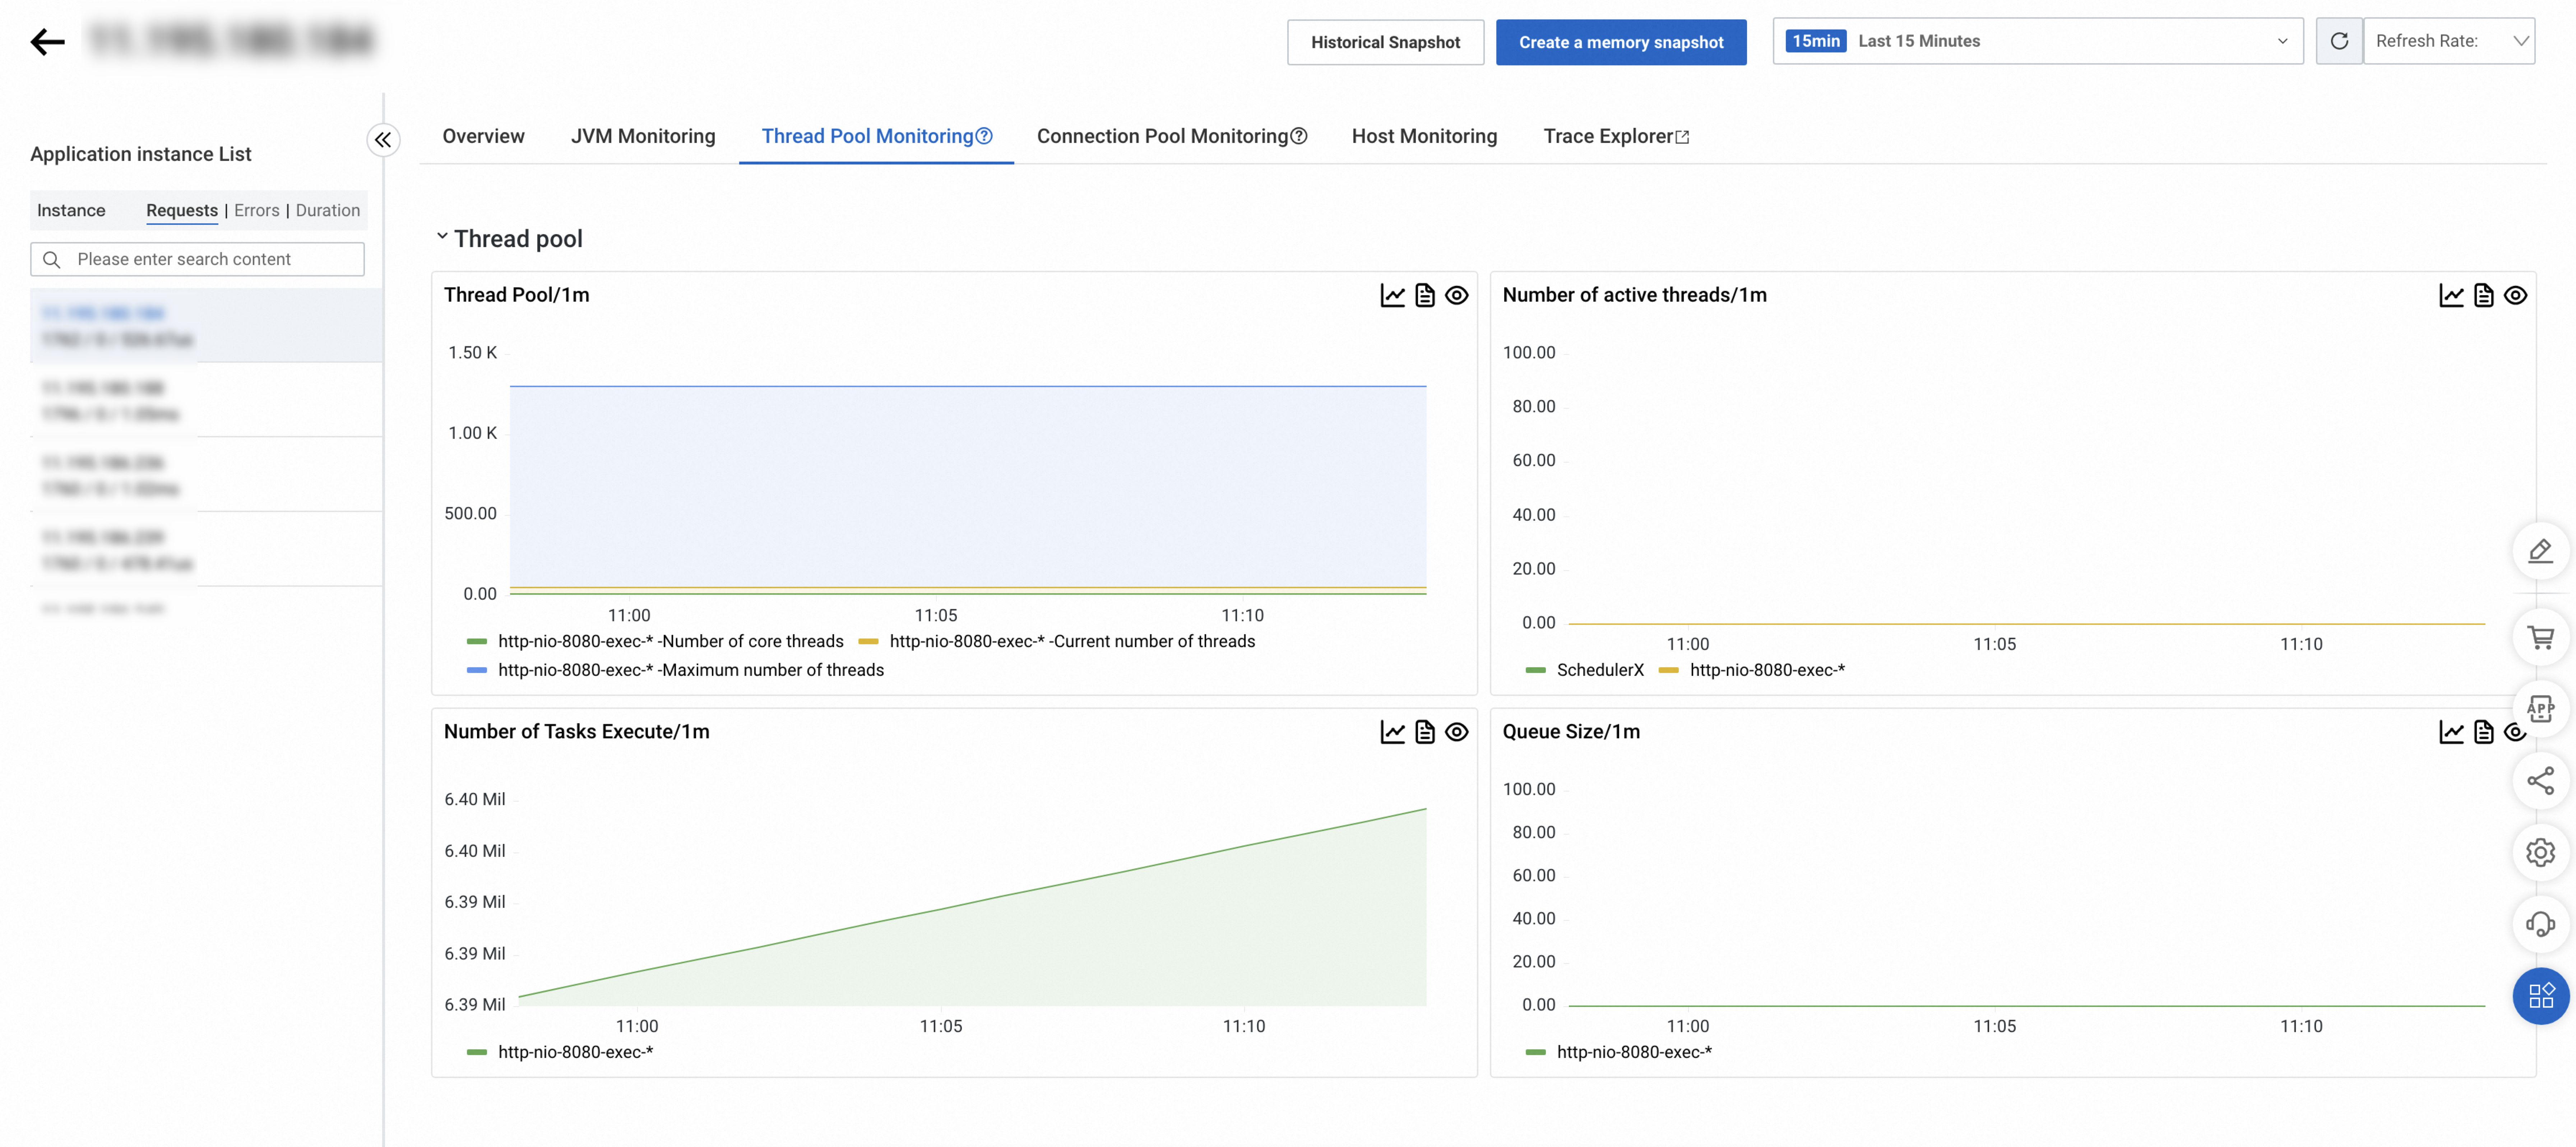
Thread pool monitoring
Thread pool monitoring tracks core thread configuration, active thread status, and task execution metrics. Filter thread pools by type and name at the top of the tab.
Probe version 4.1.x or later
Supported frameworks
| Framework class | Typical use |
|---|---|
java.util.ThreadPoolExecutor | Tomcat 8 to 9.1, Dubbo, HSF, Vert.x, custom thread pools |
org.apache.tomcat.util.threads.ThreadPoolExecutor | Tomcat 9.1 and later |
org.eclipse.jetty.util.thread.QueuedThreadPool | Jetty |
org.xnio.XnioWorker | Undertow |
Collected metrics
| Metric | ThreadPoolExecutor (JDK) | ThreadPoolExecutor (Tomcat 9.1+) | QueuedThreadPool | XnioWorker |
|---|---|---|---|---|
arms_thread_pool_core_pool_size | Yes | Yes | Yes | Yes |
arms_thread_pool_max_pool_size | Yes | Yes | Yes | Yes |
arms_thread_pool_active_thread_count | Yes | Yes | Yes | Yes |
arms_thread_pool_current_thread_count | Yes | Yes | Yes | -- |
arms_thread_pool_max_thread_count | Yes | Yes | -- | -- |
arms_thread_pool_scheduled_task_count | Yes | Yes | -- | -- |
arms_thread_pool_completed_task_count | Yes | Yes | -- | -- |
arms_thread_pool_rejected_task_count | Yes | Yes | Yes | -- |
arms_thread_pool_queue_size | Yes | Yes | Yes | Yes |
Probe version earlier than 4.1.x
Supported frameworks: Tomcat, HSF, Dubbo, Vert.x, and Undertow. Agent versions 3.1.x and earlier support Undertow 1.x to 2.0.x only. Agent versions 3.2.x and later support all Undertow versions.
| Metric | Description |
|---|---|
arms_threadpool_core_size | Core thread count |
arms_threadpool_max_size | Maximum thread count |
arms_threadpool_active_size | Active thread count |
arms_threadpool_queue_size | Queue size |
arms_threadpool_current_size | Current pool size |
SchedulerX thread pools report only arms_threadpool_active_size.
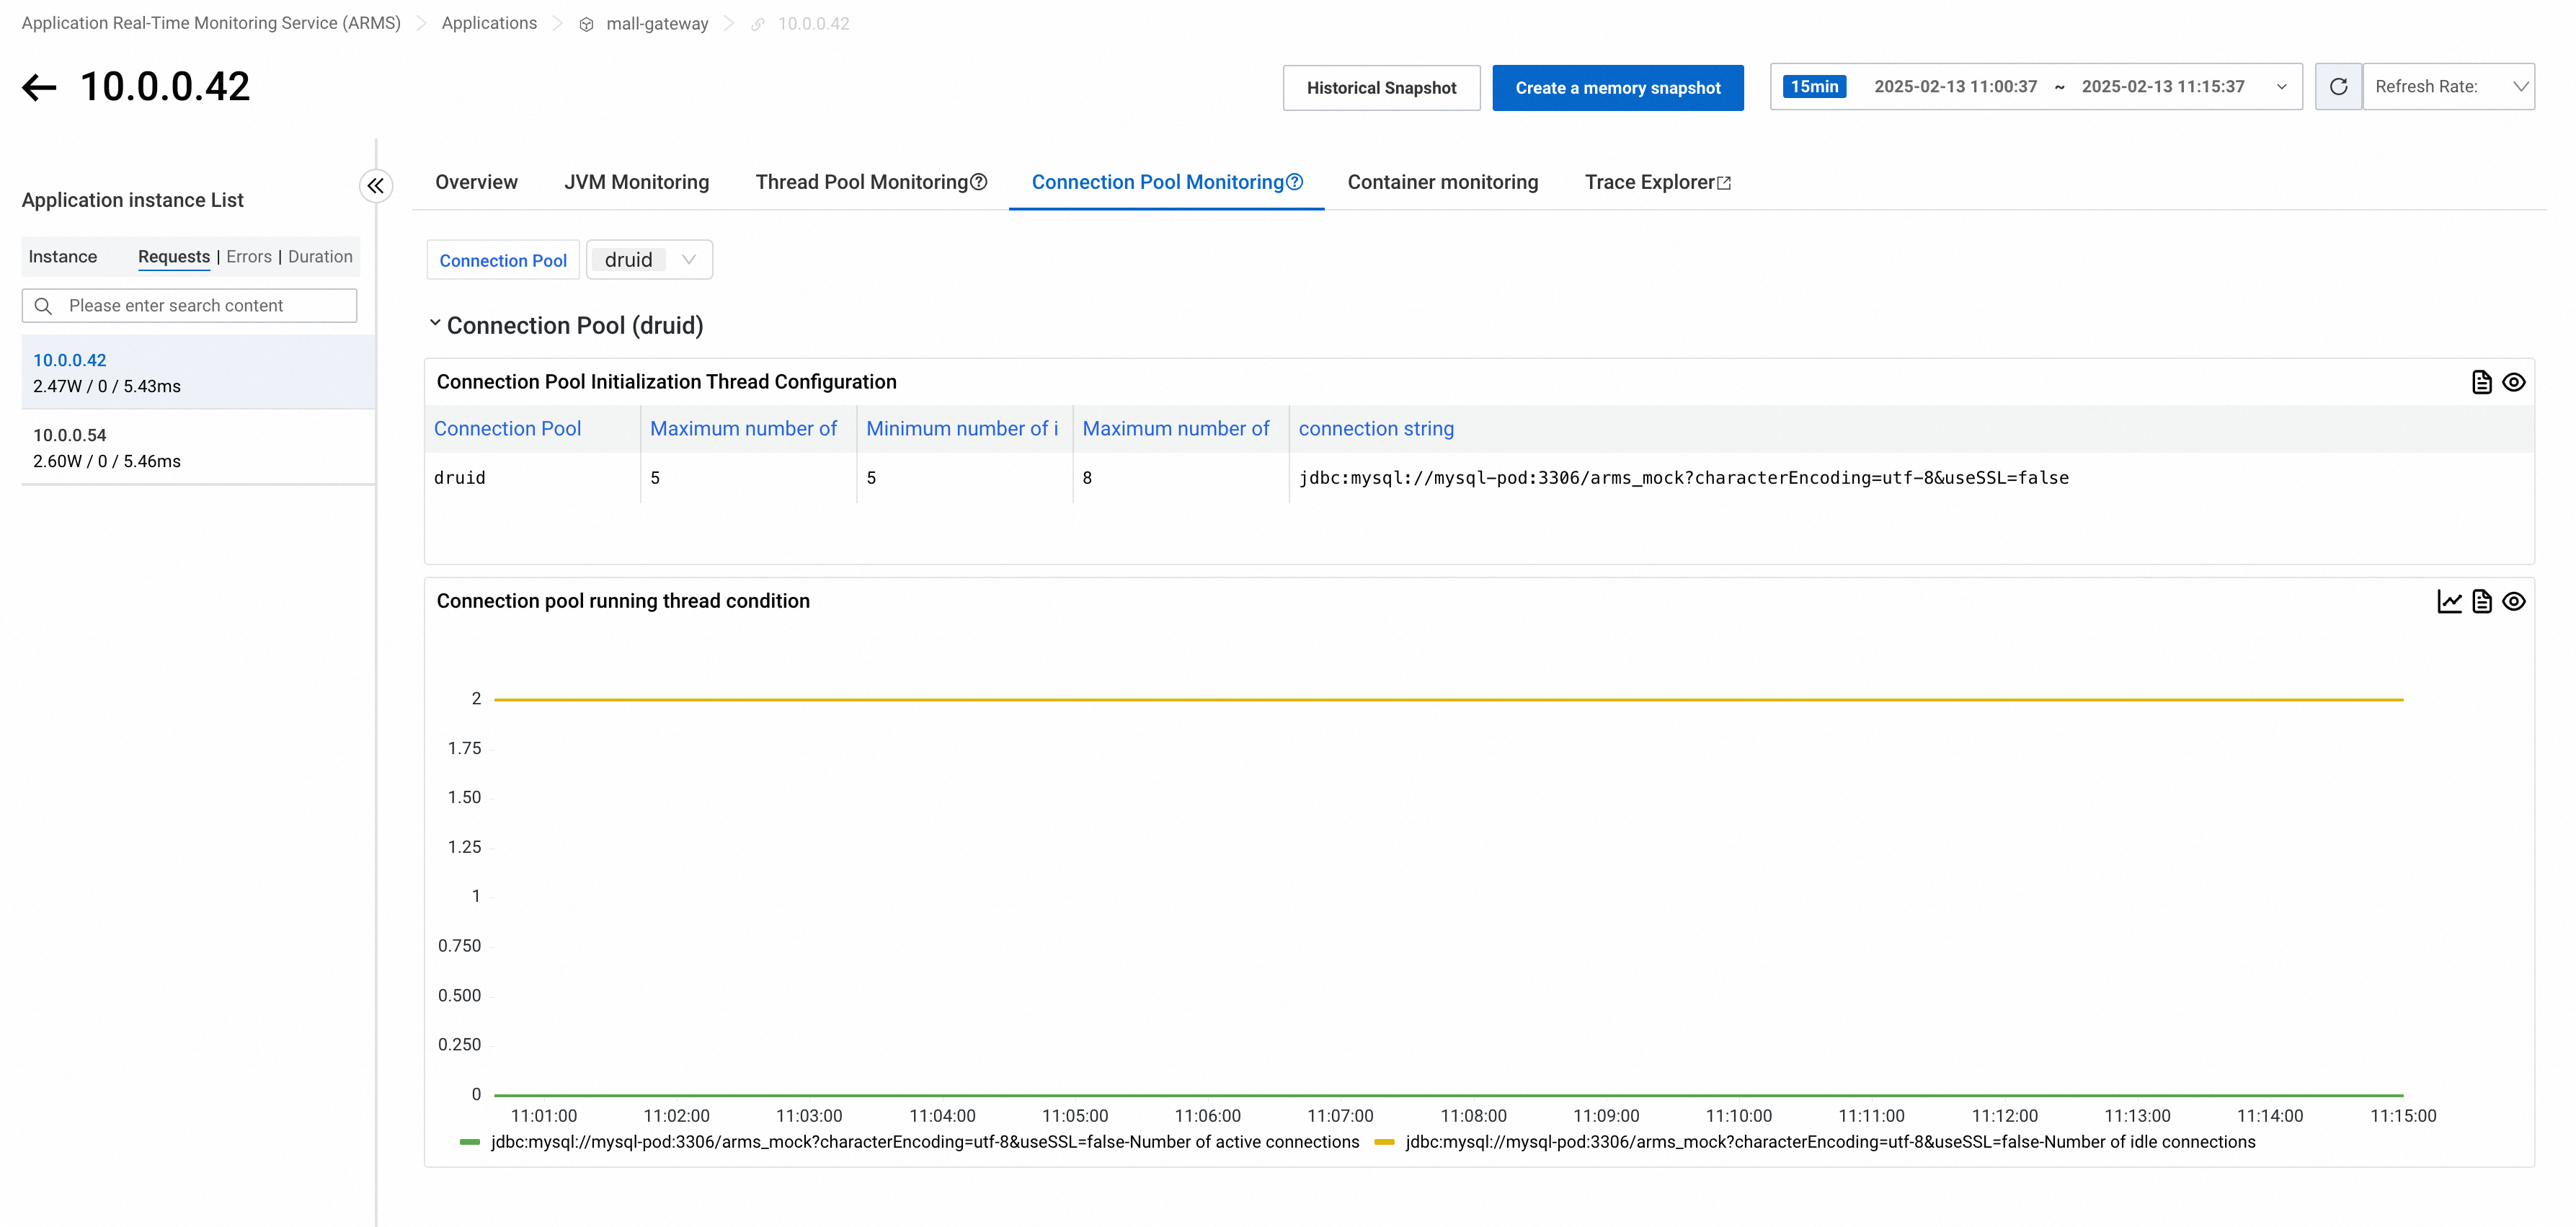
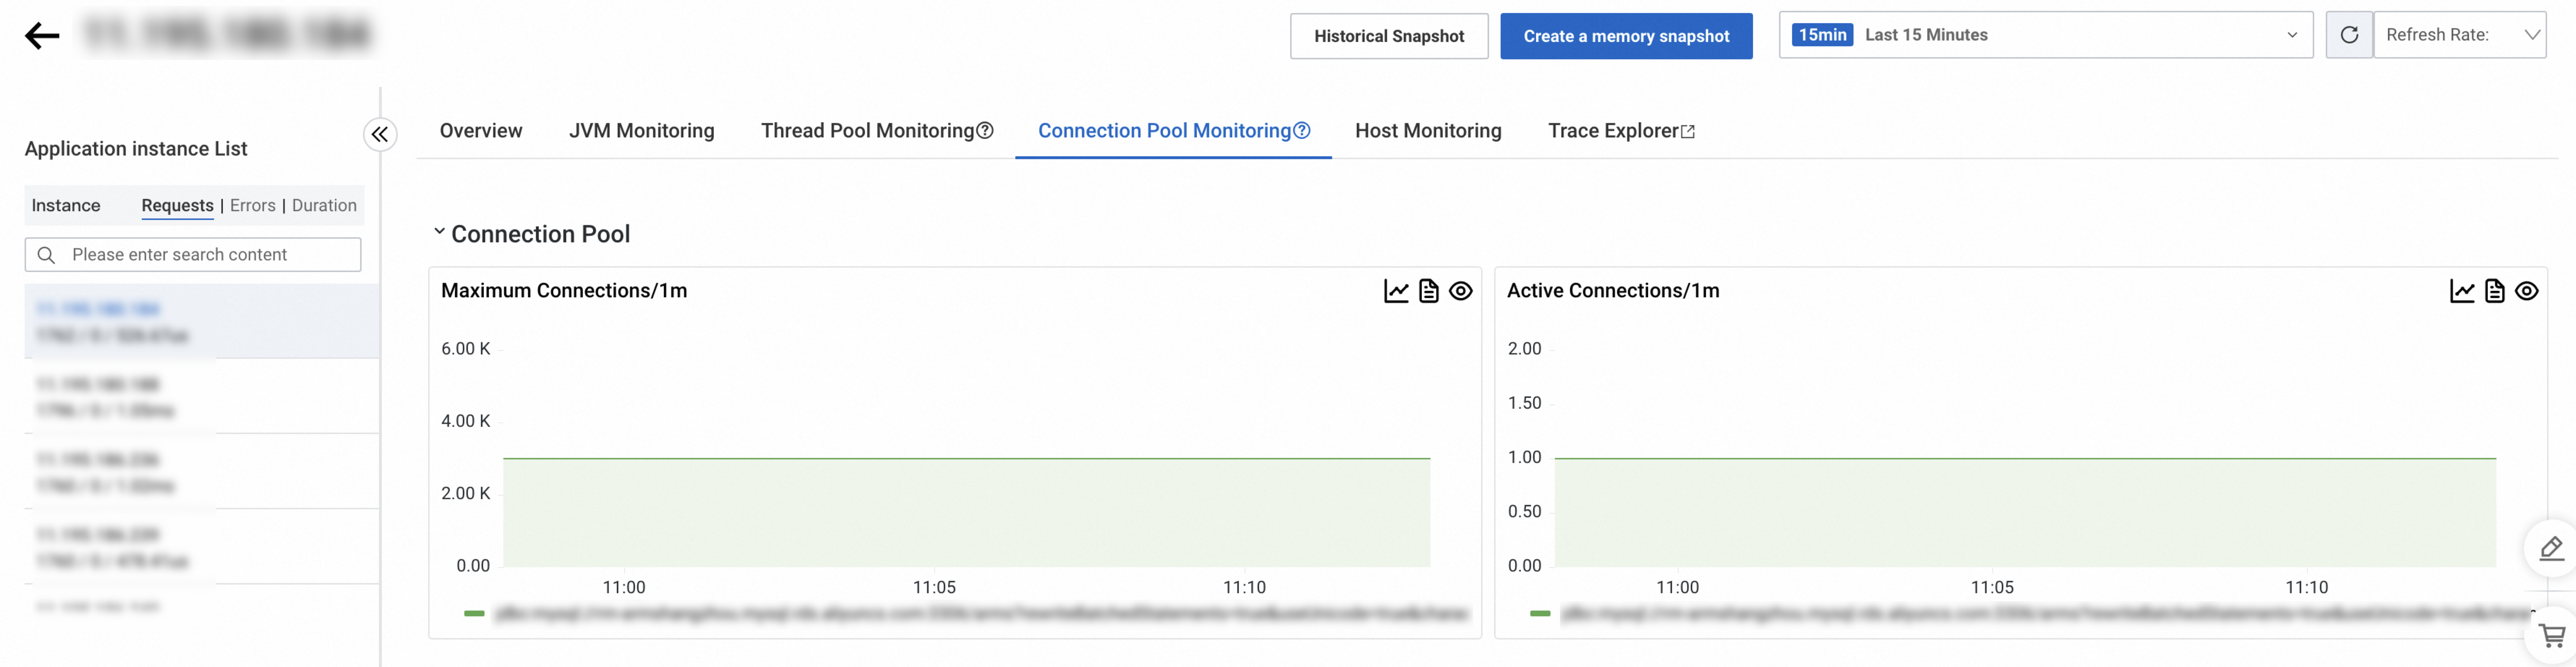
Connection pool monitoring
Connection pool monitoring tracks initialization configuration and runtime connection status. Filter connection pools by type at the top of the tab.
Probe version 4.1.x or later
Supported frameworks: DBCP (>2.0), Vibur DBCP (>11.0), c3p0 (>0.9.2), Druid, HikariCP (>3.0), Jedis (>3.0), Lettuce (>5.0), Redisson (>3.0), tomcat-dbcp (>8.0), tomcat-jdbc (>8.0).
Collected metrics
| Metric | Description | Supported frameworks |
|---|---|---|
arms_connection_pool_connection_count | Connection count (active vs. idle by state) | DBCP, c3p0, Vibur DBCP, Druid, HikariCP, Jedis, Lettuce, Redisson, tomcat-dbcp, tomcat-jdbc |
arms_connection_pool_connection_min_idle_count | Minimum idle connections (static config) | DBCP, Jedis, Druid, HikariCP, Lettuce, tomcat-dbcp, tomcat-jdbc |
arms_connection_pool_connection_max_idle_count | Maximum idle connections (static config) | DBCP, Jedis, Druid, Lettuce, tomcat-dbcp, tomcat-jdbc |
arms_connection_pool_connection_max_count | Maximum connections (static config) | DBCP, Druid, Vibur DBCP, HikariCP, tomcat-dbcp, tomcat-jdbc |
arms_connection_pool_pending_request_count | Blocked connection requests | c3p0, HikariCP, Jedis, tomcat-dbcp, tomcat-jdbc |
Probe version earlier than 4.1.x
| Framework | Metrics collected |
|---|---|
| okHttp2 / okHttp3 | arms_threadpool_active_size, arms_threadpool_current_size |
| Apache HttpClient | arms_threadpool_current_size, arms_threadpool_max_size, arms_threadpool_queue_size |
| Druid | arms_threadpool_active_size, arms_threadpool_max_size |
| HikariCP | arms_threadpool_active_size, arms_threadpool_max_size |
Host monitoring
The Host Monitoring tab shows CPU, memory, disk, load, network traffic, and network packet metrics.

Container monitoring
The Container Monitoring tab displays container-level resource metrics. Available metrics depend on your integration method:
| Integration | Metrics | Setup |
|---|---|---|
| Managed Service for Prometheus | CPU, memory, disk, load, network traffic, network packets | See Prometheus instance for Container Service |
| ARMS self-collection (probe 4.1.0+) | CPU, memory, network traffic | Upgrade probe to 4.1.0 or later. See Probe (Java Agent) version guide |

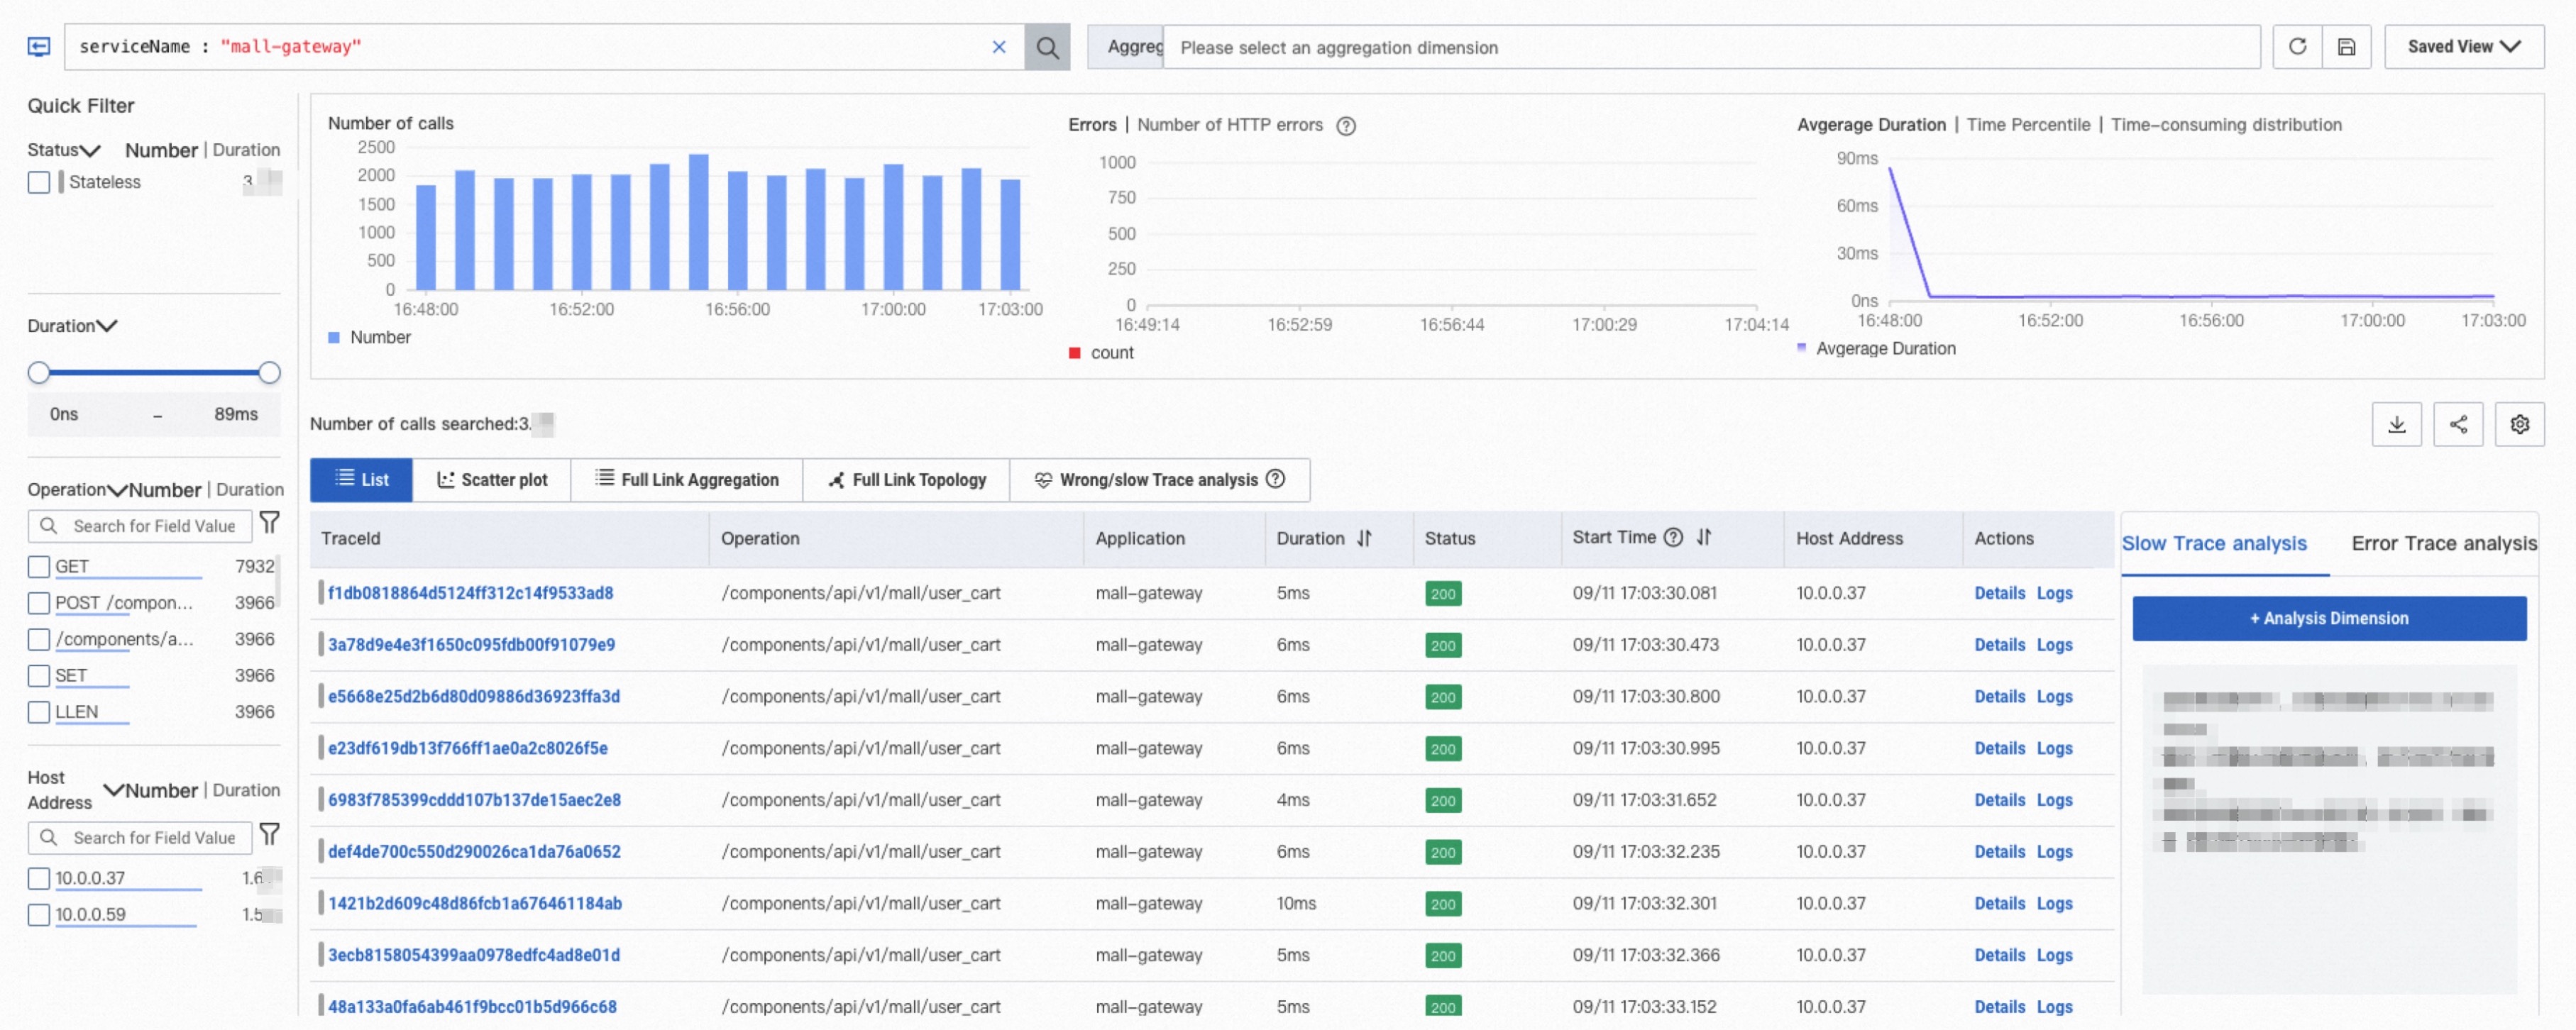
Trace analysis
Trace analysis queries stored trace data in real time. Combine filters and aggregation dimensions to diagnose performance issues across different scenarios. For details, see Trace analysis.
Application-level vs. instance-level metric aggregation
When ARMS aggregates instance-level metrics into application-level values, it uses different methods depending on the metric type:
| Metric type | Aggregation method |
|---|---|
| RED: request count, slow call count, HTTP status code count | Sum |
| RED: response time | Average |
| JVM: GC count, GC duration | Sum |
| JVM: heap memory, thread count | Maximum |
| Thread pool and connection pool: all metrics | Average |
| System metrics: all metrics | Maximum |
| SQL and NoSQL: call counts | Sum |
| SQL and NoSQL: other metrics | Average |
| Exceptions: all metrics | Sum |
References
For the full list of Application Monitoring metrics, see Application Monitoring metrics reference.
FAQ
Why is traffic uneven across instances?
In probe version 3.x, enabling memory optimization may cause some metrics to be missed. Upgrade to probe version 4.x.
Why is a single Undertow request counted twice?
In probe versions earlier than 3.2.x, DeferredResult instrumentation causes one call to be recorded twice. Upgrade to probe version 3.2.x or later.
Why don't CPU or memory quotas in Container Monitoring match Pod settings?
Check whether the Pod defines multiple containers. This metric is the sum of quotas for all containers in the Pod.
Why are some system metrics missing, inaccurate, or showing 100% CPU usage?
Probe versions earlier than 4.x do not collect system metrics on Windows. Upgrade to probe version 4.x or later.
Why does Full GC occur right after application startup?
The default metaspace size is about 20 MB. During startup, metaspace expansion triggers Full GC. Set the initial and maximum metaspace sizes using the -XX:MetaspaceSize and -XX:MaxMetaspaceSize parameters.
How is VM Stack calculated?
VM Stack is calculated as the number of live threads multiplied by 1 MB (the default thread stack size). If you set a different stack size with -Xss, this metric may not match the actual value.
state=live includes the following states: live, blocked, new, runnable, timed-wait, and wait.
How are JVM metrics collected?
ARMS retrieves JVM metrics using standard JDK interfaces.
Memory metrics:
ManagementFactory.getMemoryPoolMXBeansjava.lang.management.MemoryPoolMXBean#getUsage
GC metrics (probe earlier than 4.4.0):
ManagementFactory.getGarbageCollectorMXBeansGarbageCollectorMXBean#getCollectionCountGarbageCollectorMXBean#getCollectionTime
GC metrics (probe 4.4.0 or later):
Retrieved by subscribing to the GarbageCollectionNotificationInfo event from GarbageCollectorMXBean.
Why is the JVM maximum heap memory value -1?
A value of -1 means the maximum heap size is not configured. Set it using the -Xmx parameter.
Why does JVM heap memory usage not equal the maximum heap memory size?
The -Xms parameter sets the initial heap size. The JVM expands the heap as needed, up to the maximum set by -Xmx. A mismatch means the heap has not fully expanded yet.
Why does JVM GC frequency gradually increase?
This typically occurs with ParallelGC, the default GC algorithm in JDK 8. ParallelGC enables -XX:+UseAdaptiveSizePolicy by default, which dynamically adjusts heap sizing. When Young GC runs frequently, the survivor space may shrink, causing objects to be promoted to the old generation faster. This accelerates old generation growth and triggers more frequent Full GC. For details, see the Java GC Ergonomics documentation.
Why is there no data for thread pool or connection pool monitoring?
On the Custom Configuration page, under Advanced Settings, confirm that thread pool and connection pool monitoring are enabled.
Verify that the framework is supported. See Thread pool and connection pool monitoring.
Why doesn't the HikariCP maximum connection count match expectations?
Probe versions earlier than 3.2.x incorrectly retrieve the maximum connection count. Upgrade to probe version 3.2.x or later.
Why do pooling monitoring metrics display as decimal values?
The probe collects data every 15 seconds. The console displays the average over the selected time range. For example, if four data points in one minute are 0, 0, 1, and 0, the displayed value is 0.25.
Why are thread pools or connection pools full, but monitoring shows no change?
ARMS collects thread pool and connection pool metrics every 15 seconds. Short-lived spikes within this interval may not be captured.
Why is the thread pool maximum thread count unexpected or showing 2.1 billion?
ARMS reads the maximum thread count directly from the thread pool object. A value of 2.1 billion typically indicates a scheduled thread pool, which defaults to Integer.MAX_VALUE.

Why don't Tomcat thread pool metrics match expectations?
If multiple metrics (maximum thread count, active thread count, core thread count) all differ from expected values, check whether the application exposes Tomcat services on multiple ports. For example, Spring Actuator opens an extra port for metrics. In this case, ARMS may merge metrics from multiple thread pools due to dimension convergence.
To fix this, upgrade to probe version 4.1.10 or later. Then go to Application Configuration > Custom Configuration > Pooling Monitoring Configuration, and set Thread Pool Thread Name Pattern Extraction Strategy to Replace trailing digits with *.
Why is there no data for a thread pool or connection pool before a certain time?
This occurs when a scheduled task creates the pool. Data appears only after the task initializes the pool. Traffic-based metrics, such as API request counts, behave similarly.
Why is there no data for HttpClient connection pools?
Starting with ARMS probe version 4.x, connection pool monitoring for OkHttp3 and Apache HttpClient is no longer supported. These frameworks create a separate connection pool for each external domain. When many domains are involved, this causes excessive overhead and stability risks.
Why is there no container monitoring data after integrating an ACK application?
ARMS displays container monitoring data only for resources under the same Alibaba Cloud account. Verify that the account used to create the ACK cluster matches the account used for ARMS integration.
Why is file handle open rate non-zero, but file handle count is zero?
This occurs on JDK 9 or later when using ARMS probe version 3.x. Upgrade to probe version 4.2.2 or later. See Upgrade the ARMS agent.
Why does JVM process physical memory usage differ significantly from JVM monitoring heap memory usage?
The JVM process likely uses a significant amount of off-heap memory, which ARMS does not fully monitor. For details about which JVM memory areas ARMS covers, see JVM monitoring memory details.
Why does Druid show more idle connections than the maximum idle connection setting?
The MaxIdle parameter in Druid exists only for DBCP migration compatibility. It has no functional effect.
Why is there no data after upgrading some instances to the latest probe version?
When upgrading from a probe version earlier than 4.1.x, all instances must be upgraded. The page adapts automatically after all instances run the same version.