Arthas is a tool for diagnosing issues in live Java applications. It uses bytecode enhancement technology, allowing you to check an application's status without restarting the Java Virtual Machine (JVM) process.
Application Real-Time Monitoring Service (ARMS) is completely integrated with all the capabilities of Arthas. Compared with mounting Arthas, the integrated Arthas capabilities of ARMS have the following advantages:
The Arthas capabilities do not depend on a Java Development Kit (JDK) environment. You do not need to download and install Arthas. You can enable or disable the capabilities at a time based on your business requirements.
The main features are accessible by browser. You do not need to specify commands or expressions.
The Arthas capabilities are connected to the ARMS context. You can run the trace command to view the trace IDs of ARMS.
Prerequisites
Application Monitoring provides a new monitoring details page for users who have enabled the new billing mode. For more information about the new billing mode, see Product Billing (New).
If you have not enabled the new billing mode and want to view the new monitoring details page, click Switch to New Version on the Applications page.
This feature is available only for Java applications.
Enable Arthas diagnostics only for troubleshooting. Disable it during daily use.
The ARMS agent version is 2.7.1.3 or later.
The application must be connected to Application Monitoring. For more information, see Application Monitoring overview.
The application must be developed in Java.
Background information
ARMS is integrated with the following real-time diagnostics capabilities of Arthas:
JVM overview: allows you to view the real-time memory usage, system information, system variables, and environment variables of a JVM process.
Thread analysis: allows you to view the time consumption of threads and the real-time method stack of a specified thread in a JVM process.
Method execution analysis: captures an execution record of any non-JDK method that meets specified conditions, and records the parameters, exceptions, returned values, and execution duration of each internal method.
Object viewer: allows you to view the real-time property values of an instance of any class.
Real-time dashboard: allows you to view the real-time information about common components. For example, you can view the configurations, usage, and the time consumption of SQL queries in a Druid connection pool.
Arthas Shell: allows you to perform Arthas diagnostics by using a command-line interface (CLI).
Arthas performance analysis has been fully upgraded to the continuous profiling feature, which is more user-friendly and more powerful, and can be routinely enabled and used at any time.
The continuous profiling feature can effectively discover bottlenecks caused by CPU, memory, or I/O in Java programs, and display statistics data by method name, class name, and line number. This helps developers optimize programs, reduce latency, increase throughput, and save costs. For more information, see Use the continuous profiling feature.
Arthas version information
For ARMS agent versions 2.7.1.3 to 4.6.x, the corresponding Arthas version is 3.5.6. For ARMS agent versions 4.7.x and later, the corresponding Arthas version is 4.1.0.
Enable Arthas diagnostics
Log on to the ARMS console. In the left-side navigation pane, choose .
On the Applications page, select a region in the top navigation bar and click the name of the application.
NoteThe icons in the Language column indicate the following:
 : A Java application connected to Application Monitoring.
 : A Go application connected to Application Monitoring.
 : A Python application connected to Application Monitoring.
-: An application connected to Managed Service for OpenTelemetry.
In the top navigation bar, choose .
In the Arthas Monitoring section, turn on the Arthas switch. If needed, you can choose to perform diagnostics only on specific IP addresses and add the target IP addresses.
Click Save.
View Arthas diagnostics information
Log on to the ARMS console. In the left-side navigation pane, choose .
On the Applications page, select a region in the top navigation bar and click the name of the application.
NoteThe icons in the Language column indicate the following:
: A Java application connected to Application Monitoring.: A Go application connected to Application Monitoring.: A Python application connected to Application Monitoring.-: An application connected to Managed Service for OpenTelemetry.
In the top navigation bar, choose .
On the Arthas Diagnosis page, select the application instance on which you want to perform diagnostics from the drop-down list on the top.
If the ARMS agent installed in the instance is earlier than V2.7.1.3, you are instructed to update the agent.
If the ARMS agent installed in the instance is V2.7.1.3 or later, the page displays the instance information provided by Arthas.
JVM overview
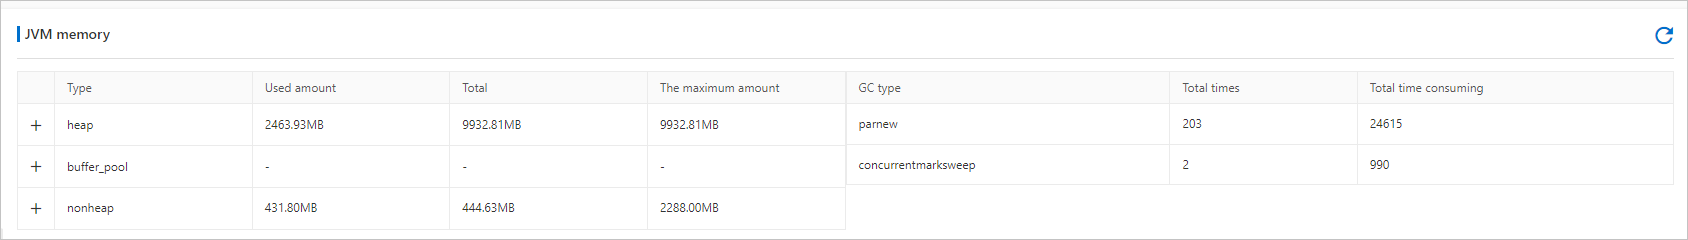
On the JVM overview tab, you can view the JVM information about the application, including the statistics on JVM memory and the information about the operating system and variables.
By default, when you enter the Arthas Diagnosis page, the JVM overview tab is displayed. The JVM overview tab contains the following sections:
JVM memory: displays information about JVM memory, such as the usage of heap memory and non-heap memory, and the information about garbage collection (GC).
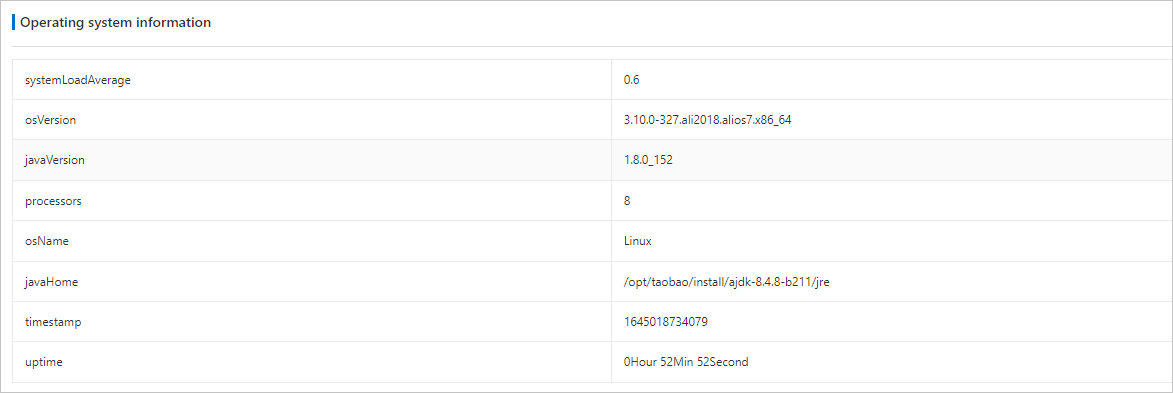
Operating system information: displays information about the operating system, such as the average system load, the name and version of the operating system, and the Java version.
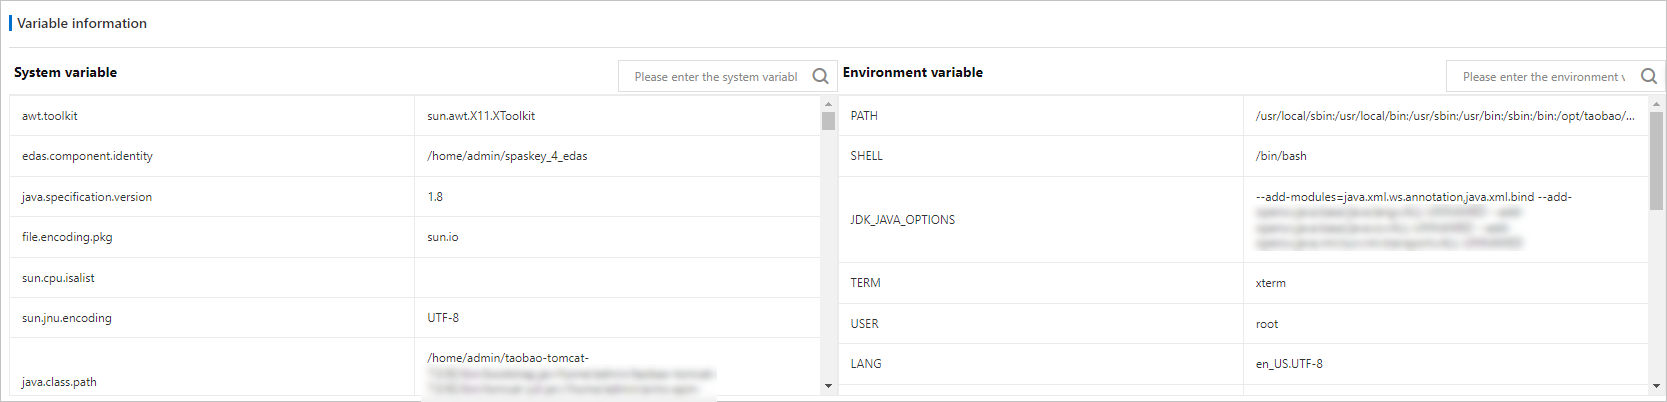
Variable information: displays information about system variables and environment variables.
Thread duration analysis
On the Thread time-consuming analysis tab, you can view all the threads of the application and the stack information about each thread. The information on this tab helps you easily identify time-consuming threads.
On the Arthas Diagnosis page, click the Thread time-consuming analysis tab.
You can view the time consumption of threads in a JVM process on the Thread time-consuming analysis tab. Similar threads are displayed in one row as a category.
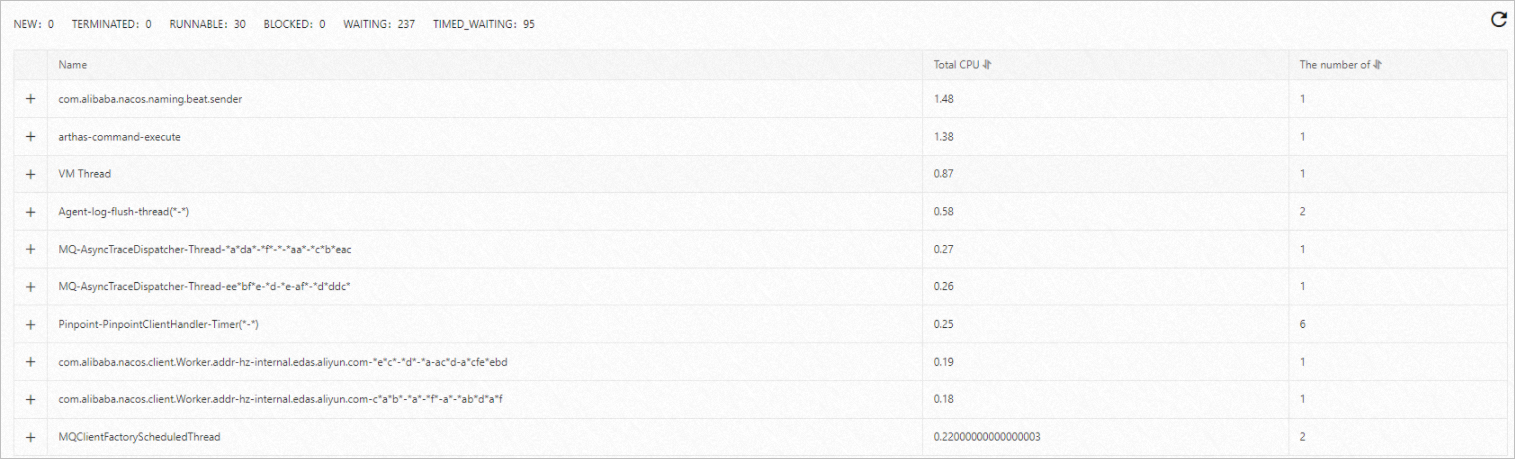
Click the + icon on the left side of a thread category name to view the details of all threads under this category, including the thread ID, CPU usage, and status.
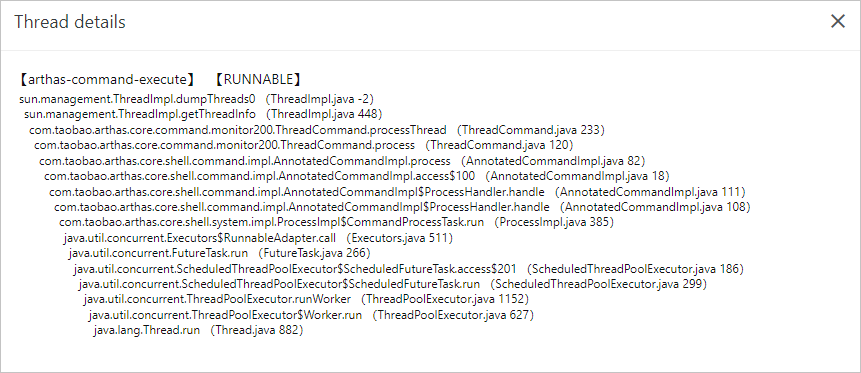
Click View the live stack in the Actions column of a thread to view the stack information about the thread.
Method execution analysis
On the Method execution analysis tab, you can view the information such as time consumption, input parameters, and returned values of a method, and even drill down to an internal method. You can use this information to locate the root causes of slow calls and missing logs, or troubleshoot non-reproducible issues.
On the Arthas Diagnosis page, click the Method execution analysis tab.
On the Method execution analysis tab, enter a keyword of the class name in the search box, and then click the
 icon.
icon. Find the class on which you want to perform diagnostics from the displayed classes. Select a method of the class in the drop-down list on the right side and then click OK.
ARMS captures a random execution record of the method. The execution information is displayed.
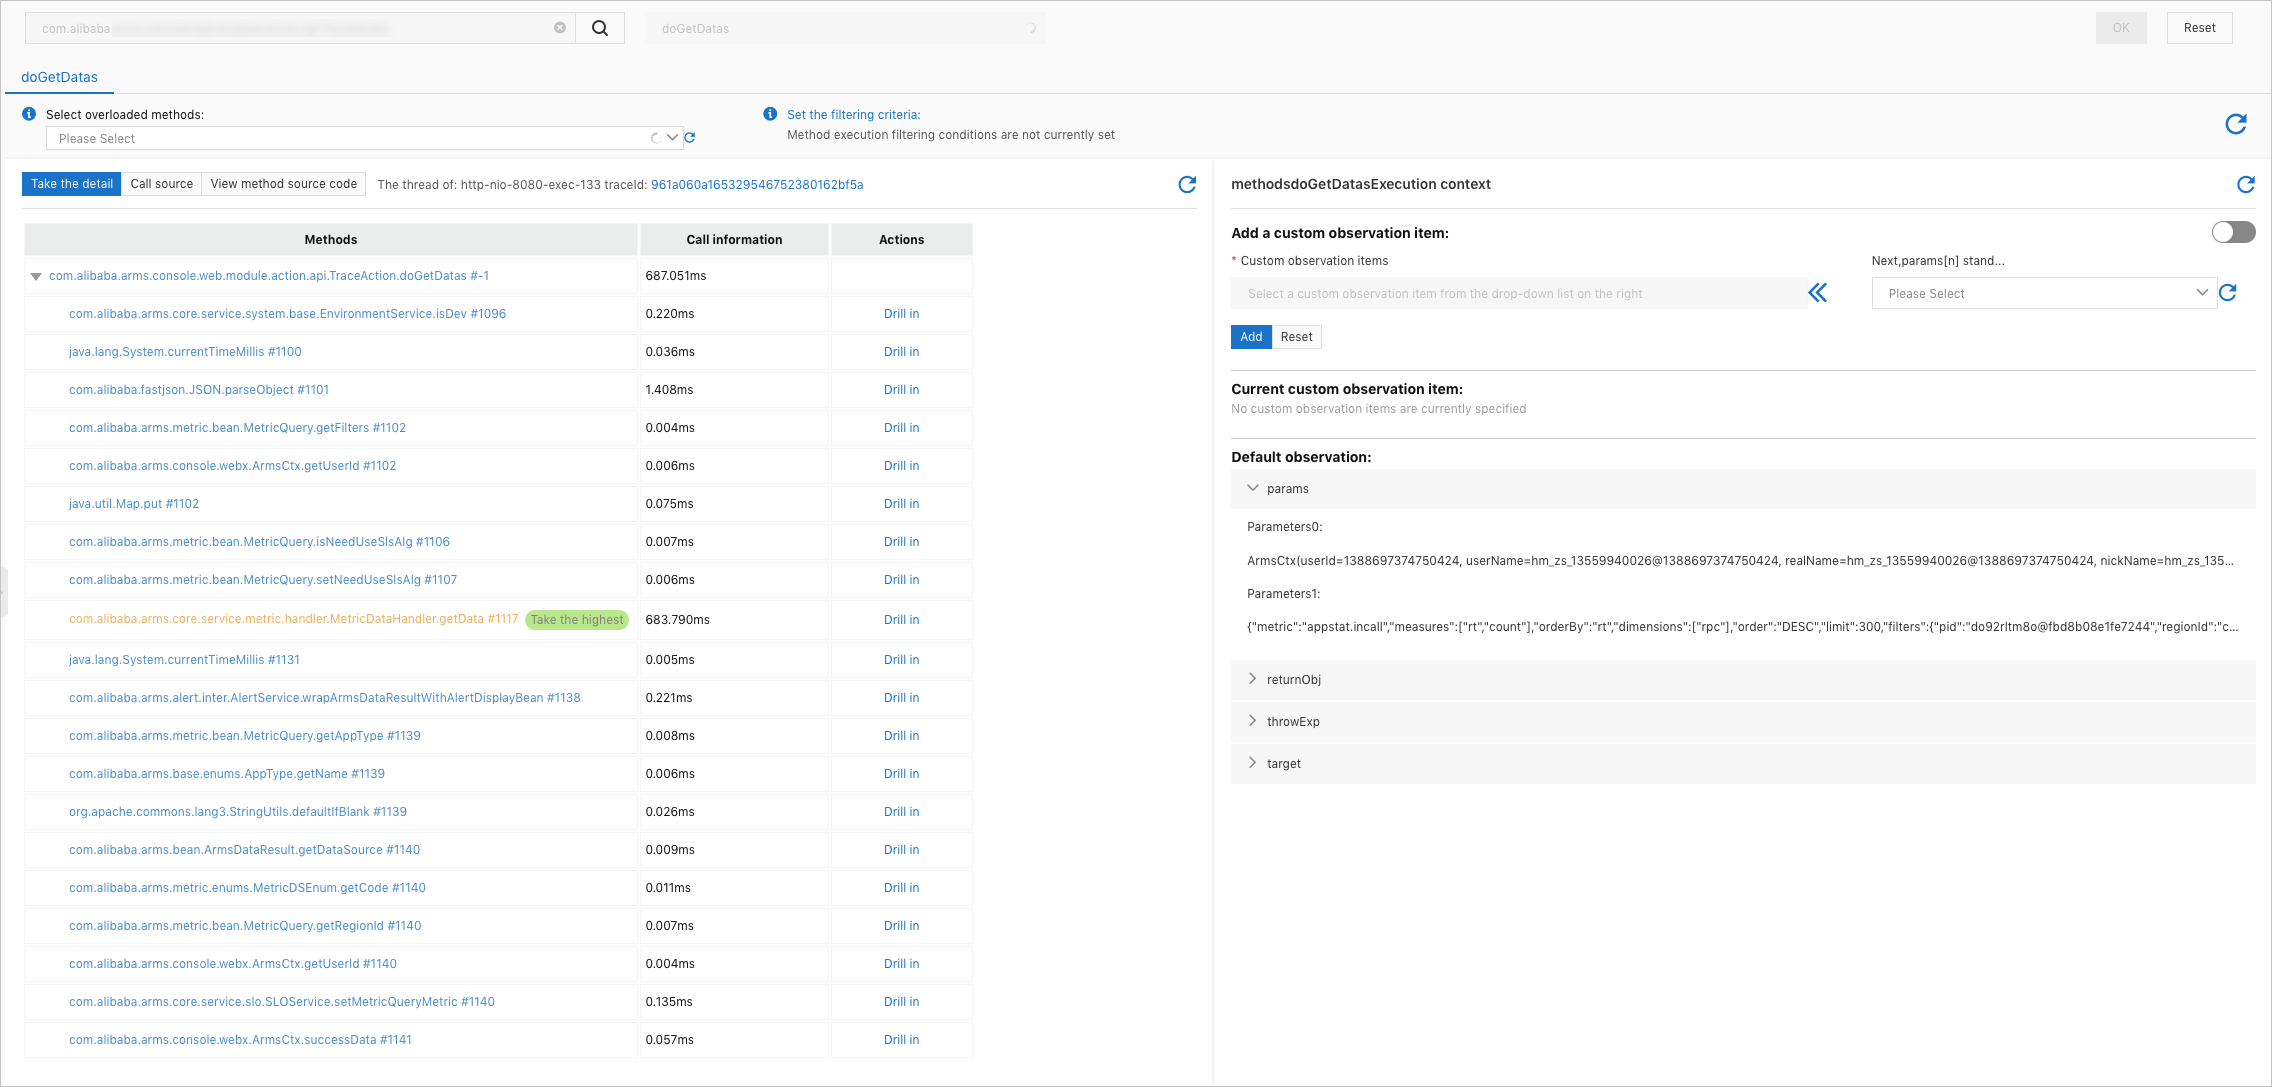
The internal execution records of the method that you select are displayed in the Execution Stack section on the left side.
To drill down to an internal method, find the internal method and click Drill in in the Actions column.
To view the source code of the method, click View Source Code next to Execution Stack.
The execution duration of each internal method is displayed in the annotations of the source code.
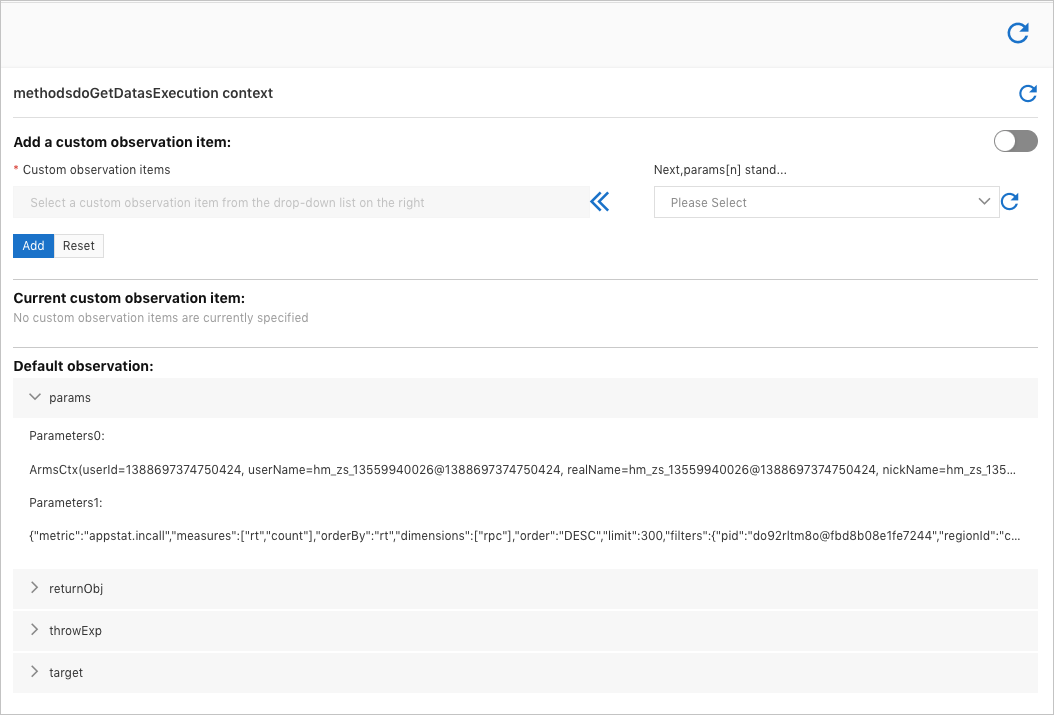
The Method Execution Result section on the right side shows the parameter values, returned values, exceptions, member variables, and trace ID of the method.
In the Set Execution Conditions section on the right side, perform the following steps to set conditions for capturing a method execution record.
Select a reload method from the drop-down list.
In the Select Initial Filter Key drop-down list, select a key type that you want to specify first and click the
 icon.
icon. Key types:
params[n]: the nth parameter of the method.
returnObj: the returned value of the method.
Method execution duration: the duration of the method.
Exception thrown or not: specifies whether an exception is thrown during the method execution.
NoteIf a nested key is selected, you need to continue specifying the field of the nested key until a base field is selected.
Select a condition.
Enter a value.
Click Add.
The conditions for selecting the method execution records are displayed in the Current Filtering Conditions section.
In the upper-right corner of the Execution Stack section, click the
 icon. The system then captures the method execution records based on the specified conditions.
Object viewer
On the objectViewer tab, you can view information of some singleton objects to troubleshoot application exceptions, such as configuration errors, improper items in blacklists or whitelists, and abnormal status of member variables.
On the Arthas Diagnosis page, click the objectViewer tab.
On the objectViewer tab, enter a keyword of the class name in the search box and click the Search icon.
Select the class on which you want to perform diagnostics from the displayed classes, select an instance of the class in the right-side pane, and then click OK.
The real-time field values of the instance are displayed.
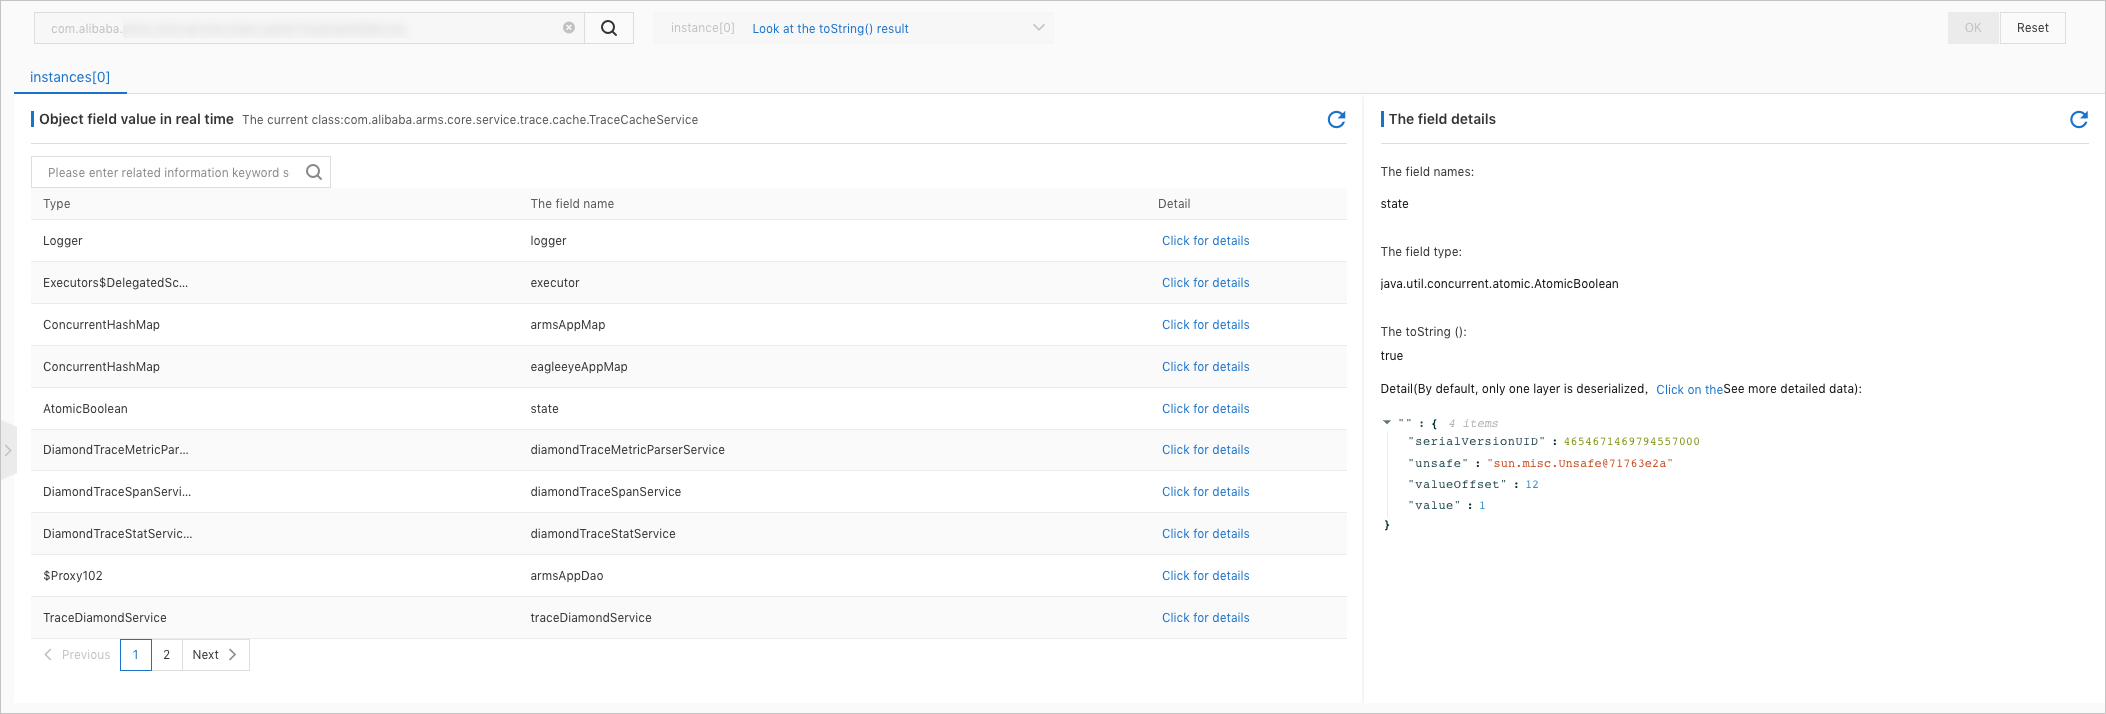
The value of a simple field is displayed in the Details column in the Real-time Field Values of Object section on the left side.
To view the value of a complex field, click View Details in the Details column of the Real-time Field Values of Object section on the left side. The detailed field value is displayed in the Field Details section on the right side.
Only part of the complex field value can be deserialized and displayed in the Field Details section. To view more data, click the click hyperlink in the parentheses next to Details.
Real-time dashboard
On the Real-time board tab, you can view the real-time information about key components in use, such as the usage of the database connection pool and the usage of the HTTP connection pool. The information helps you locate resource issues.
On the Arthas Diagnosis page, click the Real-time board tab.
On the Real-time board tab, select a dashboard from the drop-down list, select an instance of the dashboard, and click Add to board.
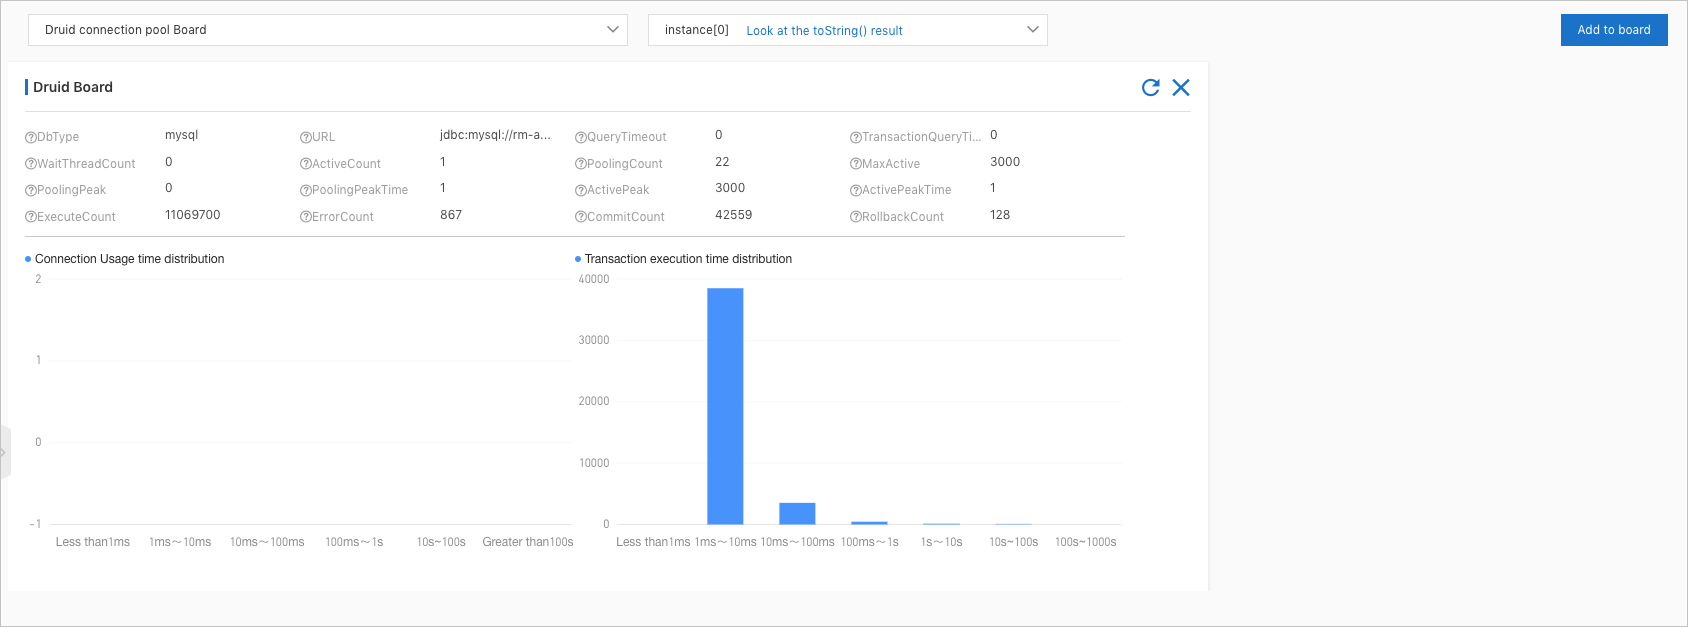
The real-time information about a component is displayed. The following figure shows the real-time information about a Druid connection pool, including the basic configurations, connection pool status, and execution duration.
Arthas Shell
This feature is available only in the following regions: China (Beijing), China (Shanghai), China (Hangzhou), China (Shenzhen), and China (Zhangjiakou).
You can perform Arthas diagnostics by using a CLI.
FAQ
Why does Arthas have no prompt and no heartbeat after being enabled?
This issue may occur for the following reasons:
Network connection failure.
Check the network connectivity. If connections to both the public application diagnostics port (9092) and the internal application diagnostics port (9092) fail, you must grant outbound access permissions on port 9092 for the application diagnostics domain name in the security group. You must also grant permissions for the endpoint domain name of the corresponding region. For a list of the domain names that require access, see Network configurations for Java application monitoring. The application diagnostics domain name is the same as the call trace metadata domain name.
A SkyWalking agent is mounted to the application.
The ARMS-integrated Arthas is incompatible with SkyWalking. They cannot coexist. You must uninstall the SkyWalking agent or manually mount Arthas 3.7.0 or a later version.
Run the
cat ~/logs/arthas/arthas.logcommand. At the end of the log, you can find an exception message that indicates agent incompatibility.2023-09-11 09:09:47 [arthas-binding-thread] ERROR c.t.a.core.server.ArthasBootstrap -start channel client failure java.lang.ExceptionInInitializerError: null at com.alibaba.arthas.channel.proto.ArthasServiceGrpc$ArthasServiceStub.register(ArthasServiceGrpc.java:306) at com.alibaba.arthas.channel.client.ChannelClient.connect(ChannelClient.java:165) at com.alibaba.arthas.channel.client.ChannelClient.start(ChannelClient.java:111) at com.taobao.arthas.core.server.ArthasBootstrap.bind(ArthasBootstrap.java:478) at com.taobao.arthas.core.server.ArthasBootstrap.<init>(ArthasBootstrap.java:162) at com.taobao.arthas.core.server.ArthasBootstrap.getInstance(ArthasBootstrap.java:613) at com.taobao.arthas.core.server.ArthasBootstrap.getInstance(ArthasBootstrap.java:601) at sun.reflect.NativeMethodAccessorImpl.invoke0(Native Method) at sun.reflect.NativeMethodAccessorImpl.invoke(NativeMethodAccessorImpl.java:62) at sun.reflect.DelegatingMethodAccessorImpl.invoke(DelegatingMethodAccessorImpl.java:43) at java.lang.reflect.Method.invoke(Method.java:498) at com.taobao.arthas.agent334.AgentBootstrap.bind(AgentBootstrap.java:182) at com.taobao.arthas.agent334.AgentBootstrap.access$000(AgentBootstrap.java:20) at com.taobao.arthas.agent334.AgentBootstrap$1.run(AgentBootstrap.java:152) Caused by: java.lang.reflect.InvocationTargetException: null at sun.reflect.NativeMethodAccessorImpl.invoke0(Native Method) at sun.reflect.NativeMethodAccessorImpl.invoke(NativeMethodAccessorImpl.java:62) at sun.reflect.DelegatingMethodAccessorImpl.invoke(DelegatingMethodAccessorImpl.java:43) at java.lang.reflect.Method.invoke(Method.java:498) at io.grpc.stub.ClientCalls.<clinit>(ClientCalls.java:52) ... 14 common frames omitted Caused by: java.lang.reflect.InvocationTargetException: null at sun.reflect.NativeMethodAccessorImpl.invoke0(Native Method) at sun.reflect.NativeMethodAccessorImpl.invoke(NativeMethodAccessorImpl.java:62) at sun.reflect.DelegatingMethodAccessorImpl.invoke(DelegatingMethodAccessorImpl.java:43) at java.lang.reflect.Method.invoke(Method.java:498) at org.apache.skywalking.apm.dependencies.net.bytebuddy.dynamic.Nexus.initialize(Nexus.java:139) ... 19 common frames omitted Caused by: java.lang.NoClassDefFoundError: Lorg/apache/skywalking/apm/agent/core/plugin/interceptor/enhance/StaticMethodsInter; at java.lang.Class.getDeclaredFields0(Native Method) at java.lang.Class.privateGetDeclaredFields(Class.java:2583) at java.lang.Class.getDeclaredField(Class.java:2068) at org.apache.skywalking.apm.dependencies.net.bytebuddy.implementation.LoadedTypeInitializer$ForStaticField.onLoad(LoadedTypeInitializer.java:163) at org.apache.skywalking.apm.dependencies.net.bytebuddy.implementation.LoadedTypeInitializer$Compound.onLoad(LoadedTypeInitializer.java:233) at org.apache.skywalking.apm.dependencies.net.bytebuddy.agent.builder.AgentBuilder$InitializationStrategy$SelfInjection$Dispatcher$InjectingInitializer.onLoad(AgentBuilder.java:3655) ... 24 common frames omitted Caused by: java.lang.ClassNotFoundException: org.apache.skywalking.apm.agent.core.plugin.interceptor.enhance.StaticMethodsInter at java.net.URLClassLoader.findClass(URLClassLoader.java:382) at java.lang.ClassLoader.loadClass(ClassLoader.java:424) at com.taobao.arthas.agent.ArthasClassloader.loadClass(ArthasClassloader.java:34) at java.lang.ClassLoader.loadClass(ClassLoader.java:357) ... 30 common frames omitted
Why does the Method Execution Analysis tab show a loading icon for a while and then report a command execution failure?
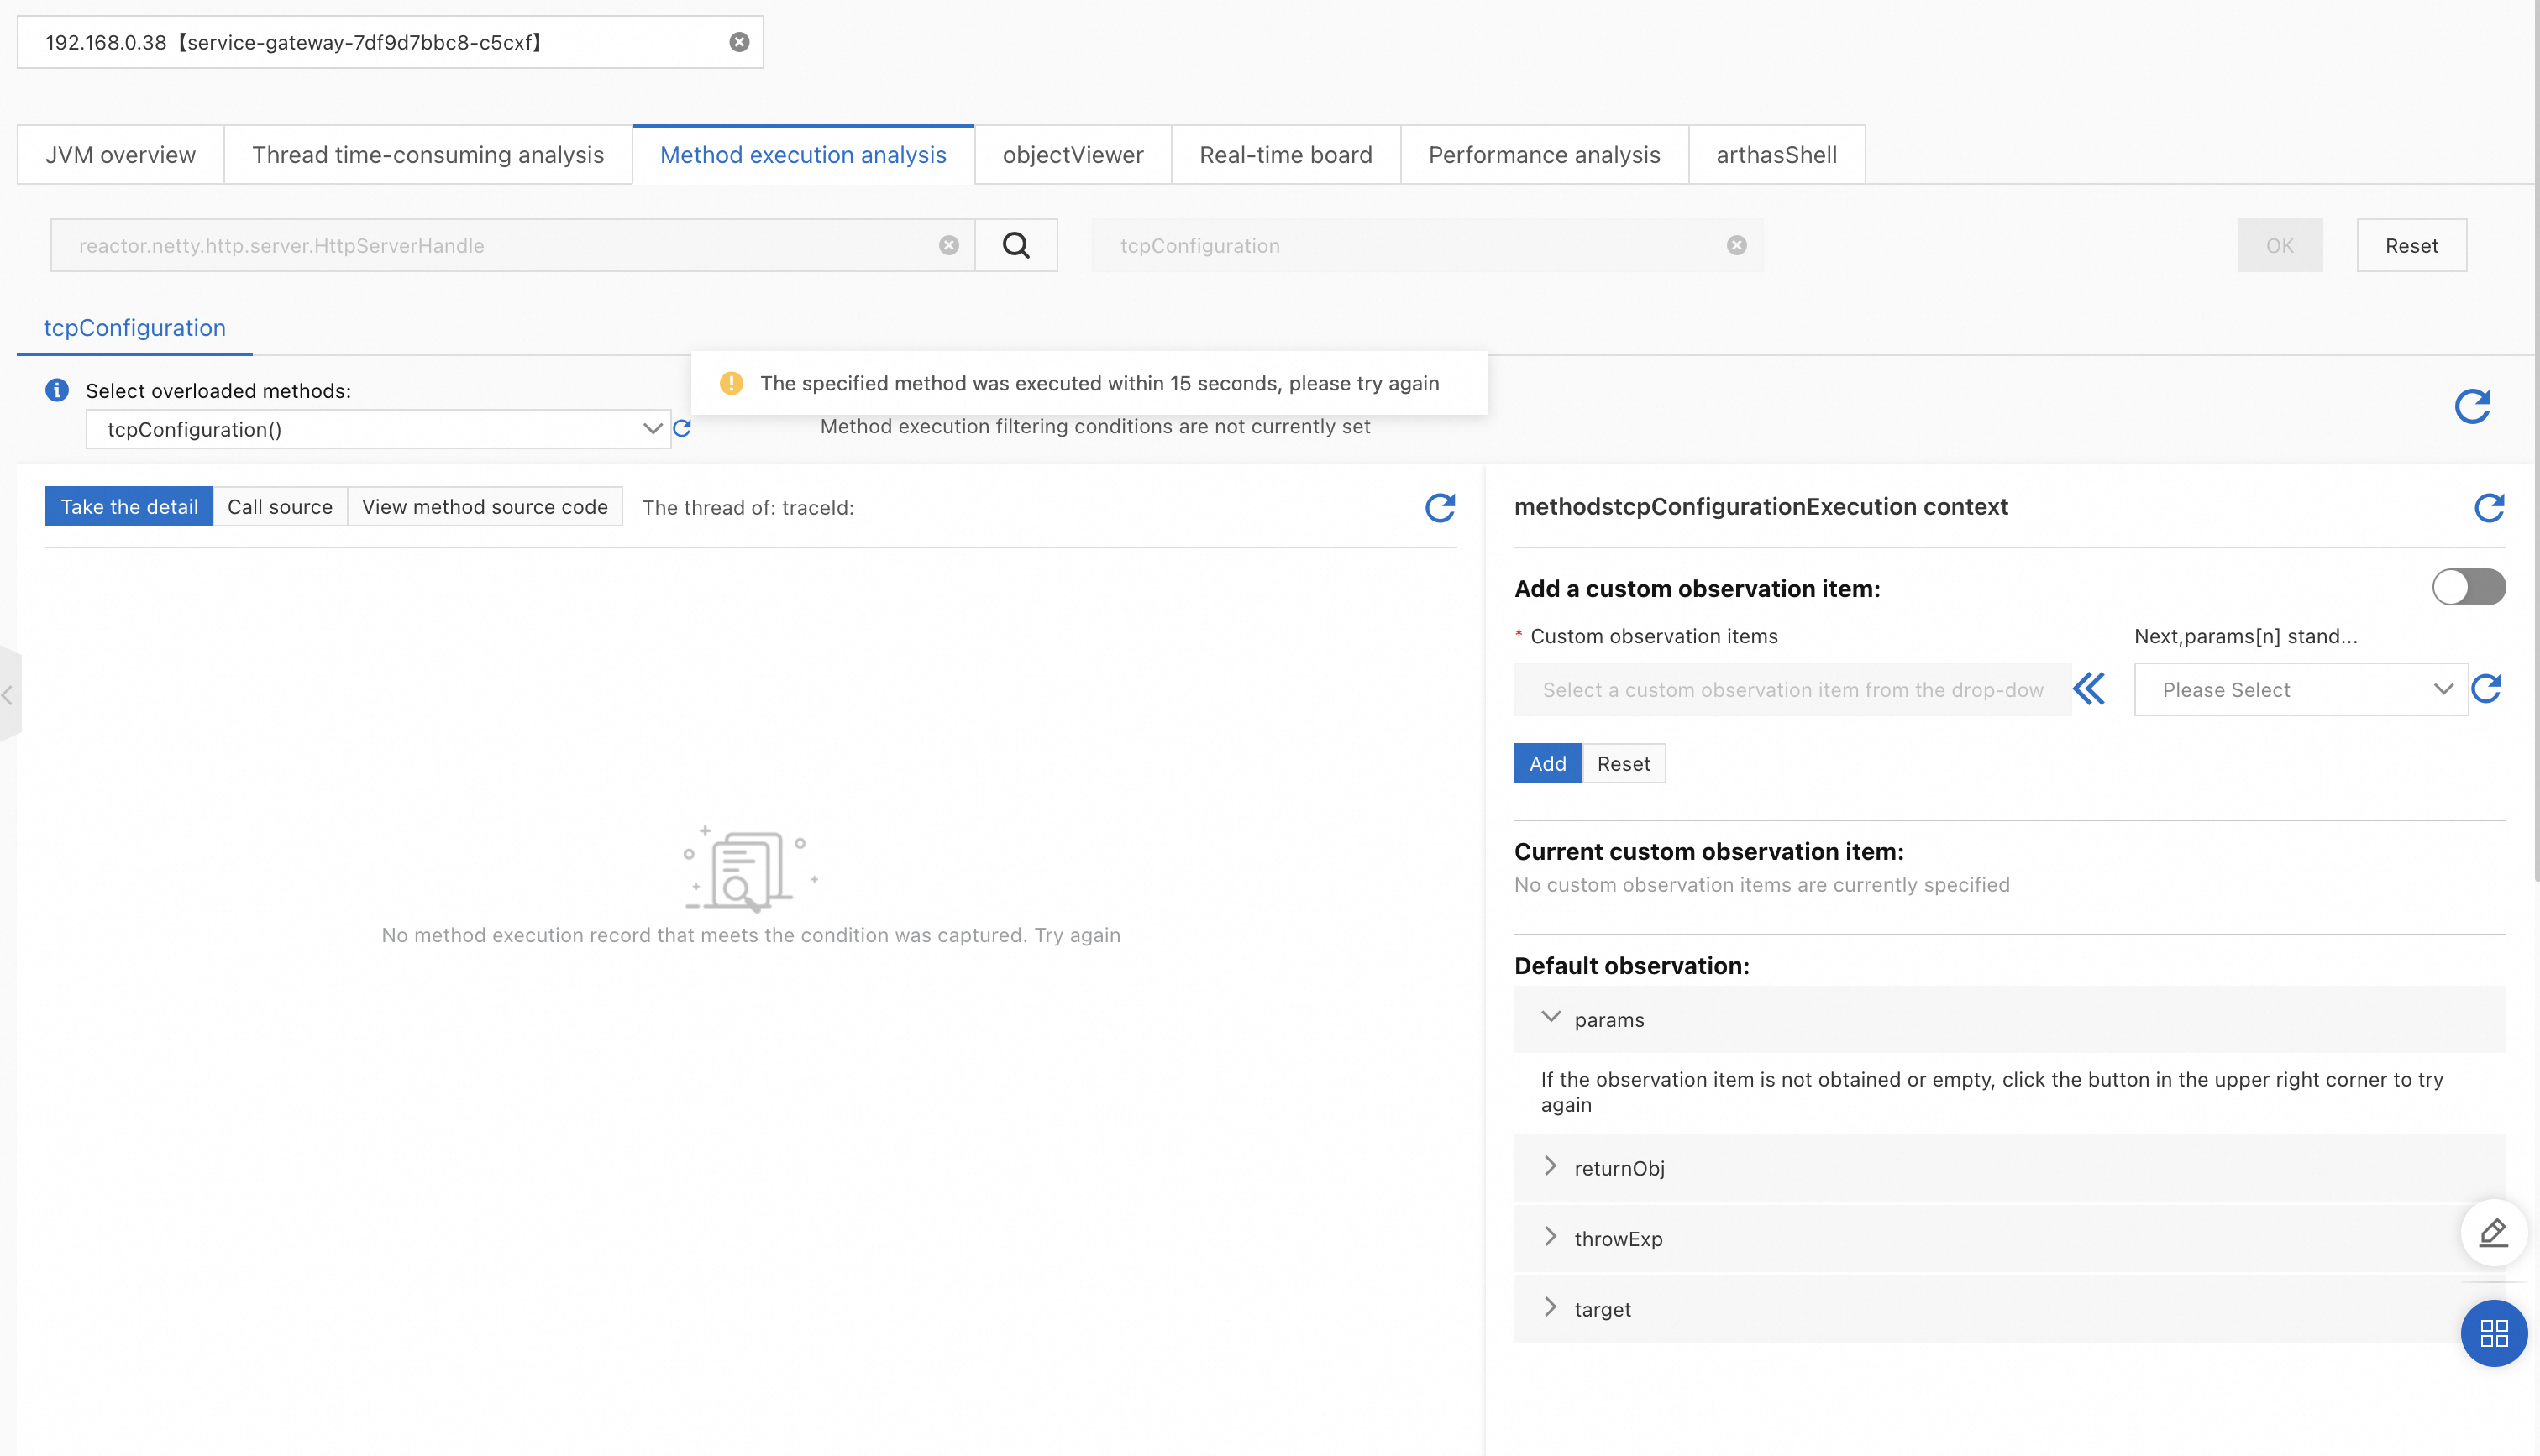
Method execution analysis captures the execution of the currently selected method in real time. This error occurs if the specified method is not executed during the waiting period. You can click the Refresh icon on the right to retry.
Why is the survivor_space size displayed by Arthas half of the actual value?
The survivor_space is divided into two equal parts: from and to. Arthas displays only the size of the from space.
Is there an extra charge for Arthas diagnostics?
No, there is no extra charge.
After I enable Arthas in the ARMS console, why does a "connection refused" message appear when I manually mount Arthas?
By default, Arthas uses port 3658 to accept new client connections. The ARMS-integrated Arthas uses a random port to avoid port conflicts when multiple processes on the same machine mount Arthas simultaneously. This can cause the mount to fail. If this occurs, you must disable the Arthas feature in the ARMS console.
After I enable Arthas in the ARMS console, why do the logs show the message "Arthas server already bind."?
If an open source version of Arthas was previously mounted to the application, you cannot enable the ARMS-integrated Arthas. You must first remove the open source Arthas and then enable the ARMS-integrated Arthas.