After you install an Application Real-Time Monitoring Service (ARMS) agent for a Java application, ARMS automatically captures exceptions thrown by instrumented methods. Use the Exceptions page to identify error patterns, filter exceptions by name, interface, or host, and drill into stack traces to pinpoint root causes.
Application Monitoring provides an updated application details page for users on the new billing mode. If you have not enabled the new billing mode, click Switch to New Version on the Application List page.
How ARMS captures exceptions
ARMS records an exception only when it propagates outside a try-catch block in an instrumented method. If a method catches and handles an exception internally, ARMS does not record it.
The following scenarios illustrate this behavior. Assume the ARMS agent has instrumented both methodA and methodB, where methodA calls methodB.
| Scenario | methodA | methodB | Exceptions recorded |
|---|---|---|---|
| 1 | Catches exception | Catches exception | None |
| 2 | Catches exception | Does not catch | 1 (ArithmeticException in methodB) |
| 3 | Does not catch | Does not catch | 2 (ArithmeticException in each method) |
| 4 | Catches and rethrows as RuntimeException | Does not catch | 2 (ArithmeticException in methodB, RuntimeException in methodA) |
Scenario 1: Both methods catch exceptions
public int methodA() {
    try {
        return methodB();
    } catch (Throwable e) {
        e.printStackTrace();
        return 0;
    }
}

public int methodB() {
    try {
        return 1 / 0;
    } catch (Throwable e) {
        e.printStackTrace();
        return 0;
    }
}
Result: ARMS records no exceptions. Both exceptions are caught and handled within their respective try-catch blocks.
Scenario 2: methodA catches, methodB does not
public int methodA() {
    try {
        return methodB();
    } catch (Throwable e) {
        e.printStackTrace();
        return 0;
    }
}

public int methodB() {
    return 1 / 0;
}
Result: ARMS records one java.lang.ArithmeticException -- the uncaught exception in methodB. The exception is caught in methodA, so methodA does not generate an additional record.
Scenario 3: Neither method catches the exception
public int methodA() {
    return methodB();
}

public int methodB() {
    return 1 / 0;
}
Result: ARMS records two java.lang.ArithmeticException exceptions -- one in each instrumented method, because neither catches the exception.
Scenario 4: methodA catches and rethrows as a different type
public static int methodA() {
    try {
        return methodB();
    } catch (Throwable e) {
        throw new RuntimeException(e);
    }
}

public static int methodB() {
    return 1 / 0;
}
Result: ARMS records two exceptions: one java.lang.ArithmeticException (uncaught in methodB) and one java.lang.RuntimeException (thrown by methodA).
How ARMS groups exceptions
ARMS uses a fingerprinting mechanism to group similar exceptions. For each exception, the agent generates a fingerprint from three components:
| Component | Description |
|---|---|
| Exception class name | The fully qualified class name of the exception |
| First 3 stack lines | The first three lines of the exception method stack |
| Last 3 stack lines | The last three lines of the exception method stack |
The agent encodes these components into a 32-bit string using CRC64. On first occurrence, the agent reports both the encoded value and the full exception stack. Subsequent occurrences of the same fingerprint include only the encoded value, which reduces data volume.
The server stores the mapping between encoded values and original exception stacks for 30 days. After 30 days, if the application has not restarted, the original stack may no longer be retrievable from the encoded value.
Resolve mismatched exception stacks
Two situations can cause a mismatch between the displayed stack and the actual exception:
| Cause | Description |
|---|---|
| Identical fingerprint components | Two exceptions have different complete stacks, but their class names, first three lines, and last three lines are identical. This produces the same fingerprint, so ARMS displays the wrong stack for one of them. |
| CRC64 hash collision | Two exceptions with different fingerprint components produce the same CRC64 hash. This is rare but possible due to the non-uniqueness of CRC64 encoding. |
To resolve mismatches, increase the Similar exception stack differentiation depth parameter in the Exception Advanced Filtering Configuration section of the Custom Configurations tab.

View and filter exceptions
Log on to the ARMS console. In the left-side navigation pane, choose Application Monitoring > Application List.
Select a region in the top navigation bar, then click your application name.
Icons in the Language column indicate the programming language: -
 : Java -
  : Go -
  : Python - - (Hyphen): an application monitored in Managed Service for OpenTelemetry
In the top navigation bar, choose Scenario-based Analysis > Exceptions.
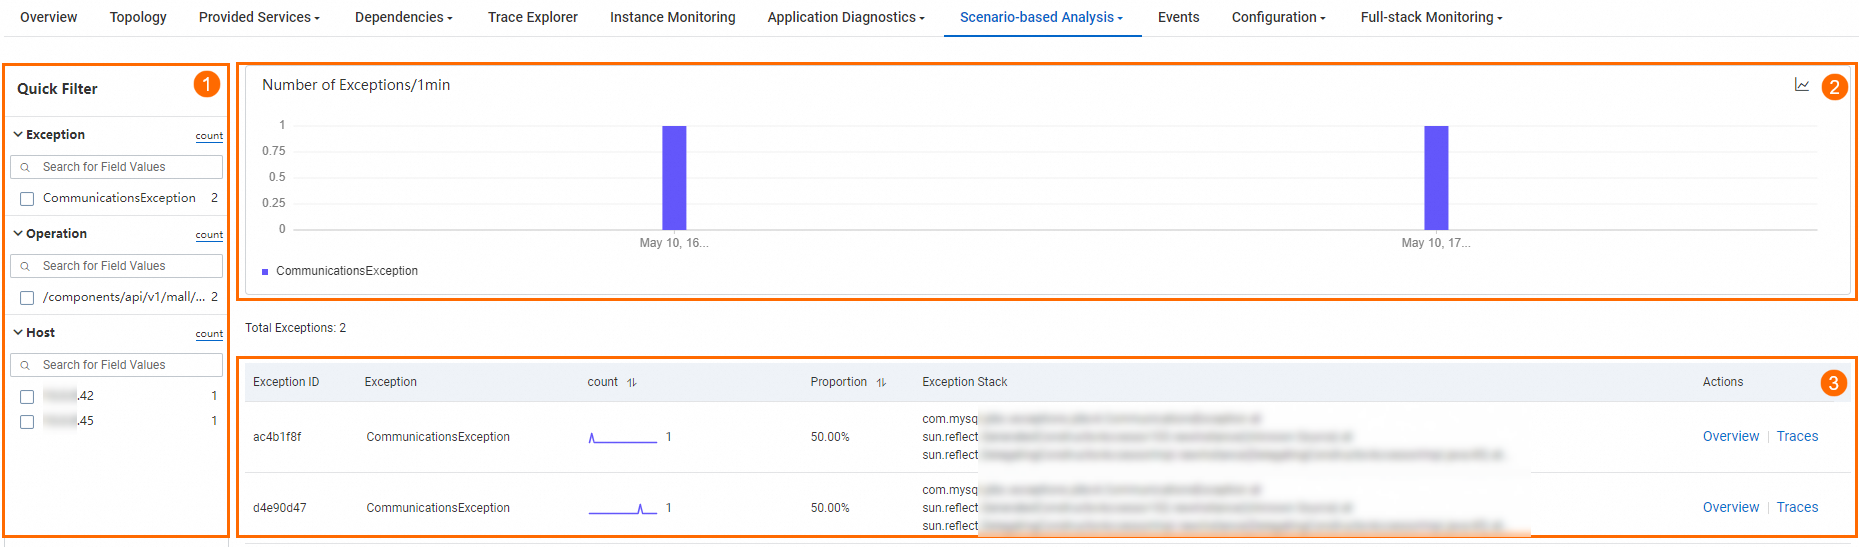
The Exceptions page consists of three sections:
Quick filters
Use the Quick Filter section to narrow results by Exception, Operation, or Host.
Trend charts
The trend chart displays exception counts over the selected time period. Each exception type appears as a stacked column.
Click the
 icon to view metrics for a specific time range or compare the same period across different dates.
Click the
 icon to switch between a column chart and a trend chart.
Exception list
The exception list shows each exception's name, occurrence count, percentage, and summary.
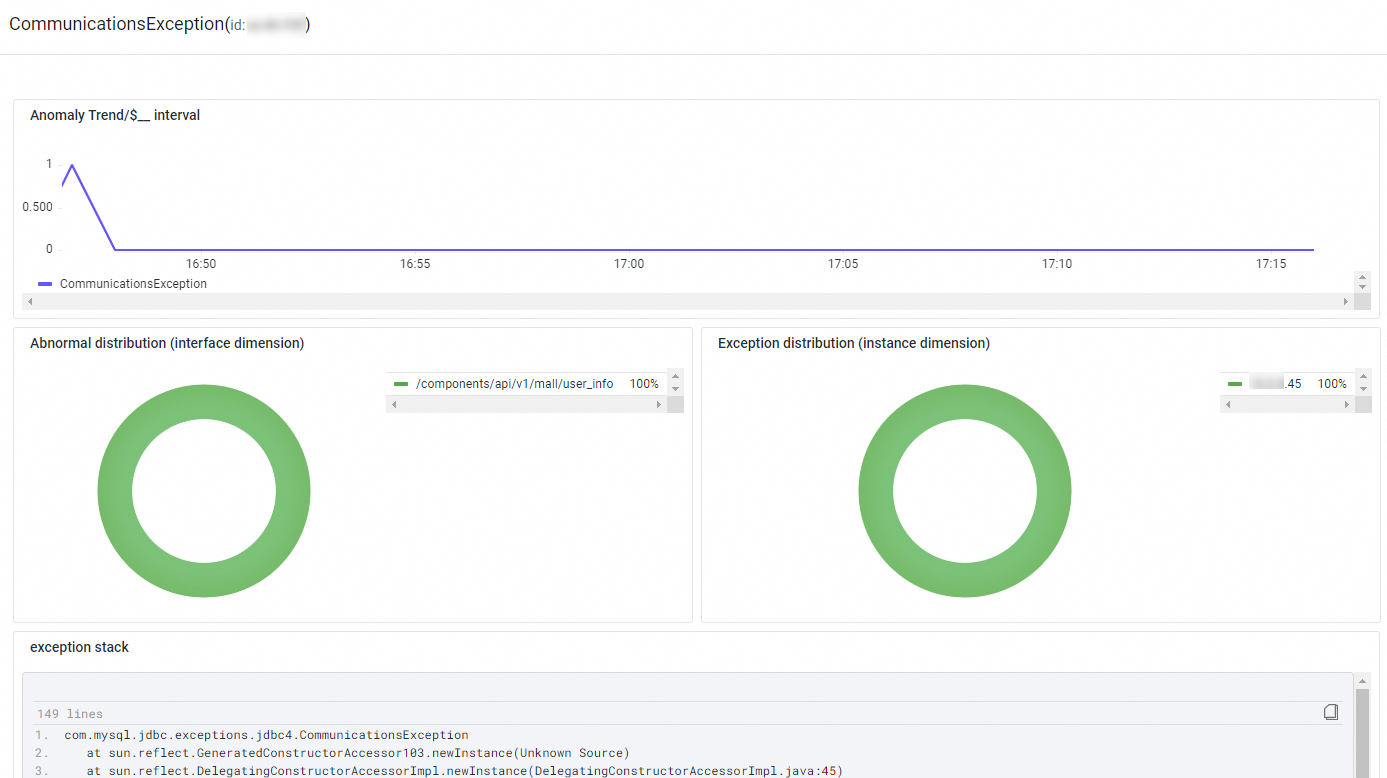
View the overview: Click Overview in the Actions column to see exception count trends, interface and instance distribution, and exception stacks.
Investigate traces: Click Traces in the Actions column to view trace details for a specific interface. For more information, see Trace Explorer.
FAQ
Why is the exception count higher than the request count for an interface?
This typically happens for one of two reasons:
A single request can trigger multiple instrumented methods. If several of these methods throw exceptions during one request, ARMS records each one separately.
When the same exception propagates up the call stack through multiple instrumented methods, each method records the exception independently.
See Scenario 3 and Scenario 4 for examples of how a single error produces multiple exception records.
Why did exception counts change after an agent upgrade?
Each agent version instruments a different set of methods. When instrumented methods increase or decrease after an upgrade, the number of captured exceptions changes accordingly.
Why does ARMS show exceptions that the application code does not catch?
Some framework-level code catches and handles exceptions internally without propagating them to your business logic. The ARMS agent can still capture these exceptions at the framework layer.
For example, MongoTemplate in Spring Data includes built-in retry logic. If a timeout occurs during a MongoDB operation, MongoTemplate retries automatically and only throws an exception to the caller after all retries fail. During this process, ARMS captures the intermediate timeout exceptions even though your application code never sees them.
Why are some exceptions missing from the ARMS console?
ARMS can only capture exceptions thrown by instrumented methods. Exceptions in non-instrumented code are not collected.
If you use ARMS agent v4.1.12 or later, enable the corresponding plugin in the Probe switch settings section of the Custom Configurations tab. This allows ARMS to capture exception data for each occurrence.
Why does the console show only an encoded ID instead of exception details after 30 days?
To reduce data volume, the ARMS agent encodes exception stacks on first occurrence and reports only the encoded value for subsequent occurrences. The server stores the mapping between encoded values and original stacks for 30 days. After this period, the original exception details may no longer be available.
See How ARMS groups exceptions for details on the encoding mechanism.
References
For a complete list of Application Monitoring metrics, see Application Monitoring metrics.