Provided services
Application Real-Time Monitoring Service (ARMS) automatically discovers and monitors the services your application exposes after you install an ARMS agent. The Provided Services page consolidates interface calls, message subscriptions, and scheduled tasks with their performance metrics, enabling you to identify slow endpoints, trace errors to root causes, and compare performance across time periods.
Prerequisites
An ARMS agent is installed for the application.
Application Monitoring provides a new application details page for users who have enabled the new billing mode. If you have not enabled the new billing mode, click Switch to New Version on the Application List page to access the new application details page.
View provided services
Log on to the ARMS console. In the left-side navigation pane, choose Application Monitoring > Applications.
Select a region in the top navigation bar and click an application.
NoteIcons in the Language column indicate the programming language:
 : Java
 : Go
: Go : Python
- (Hyphen): an application monitored in Managed Service for OpenTelemetry
In the top navigation bar, click Provided Services.
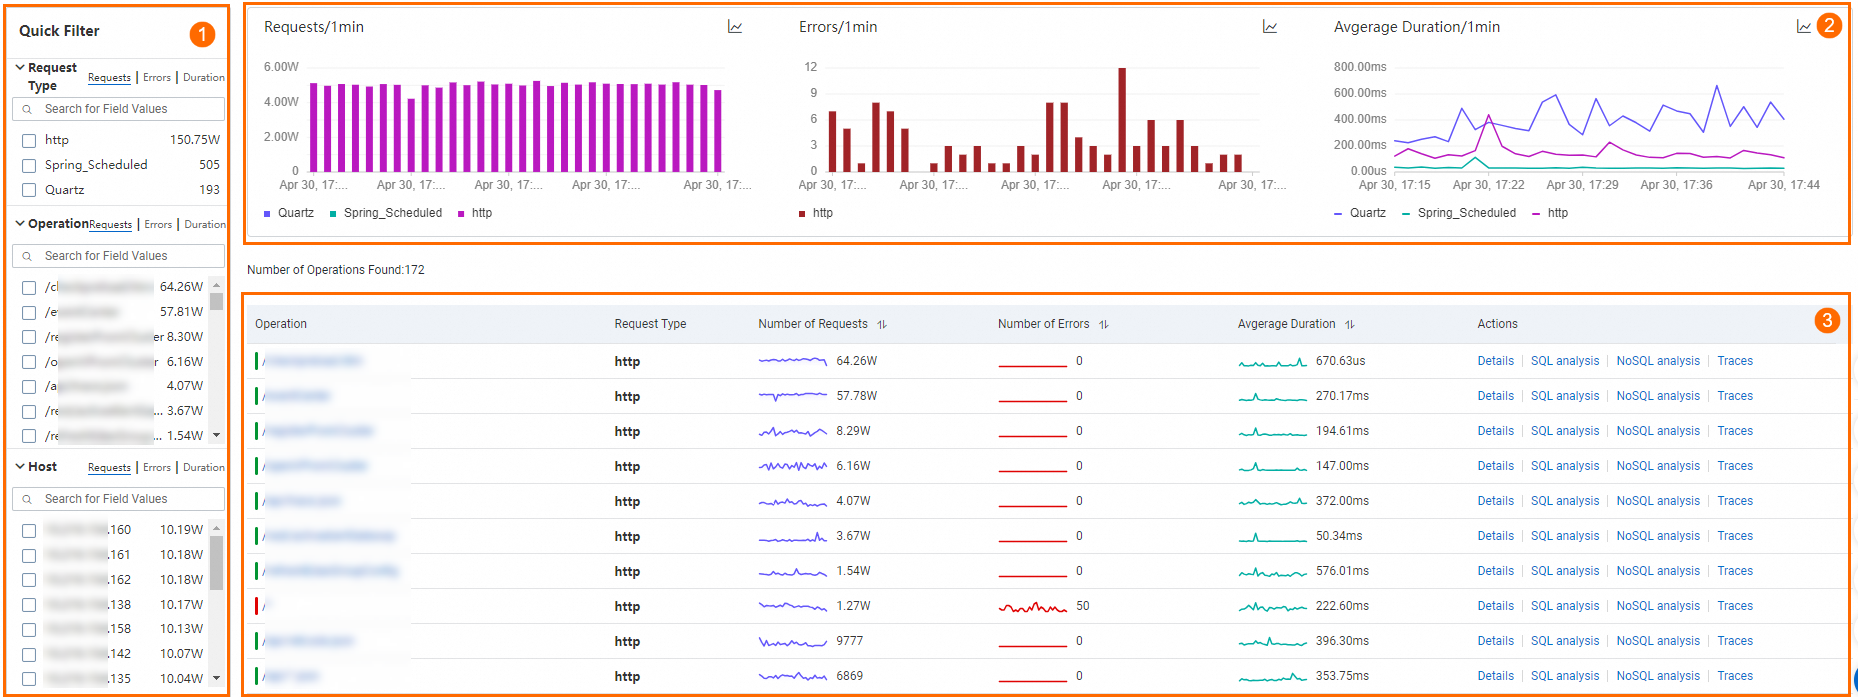
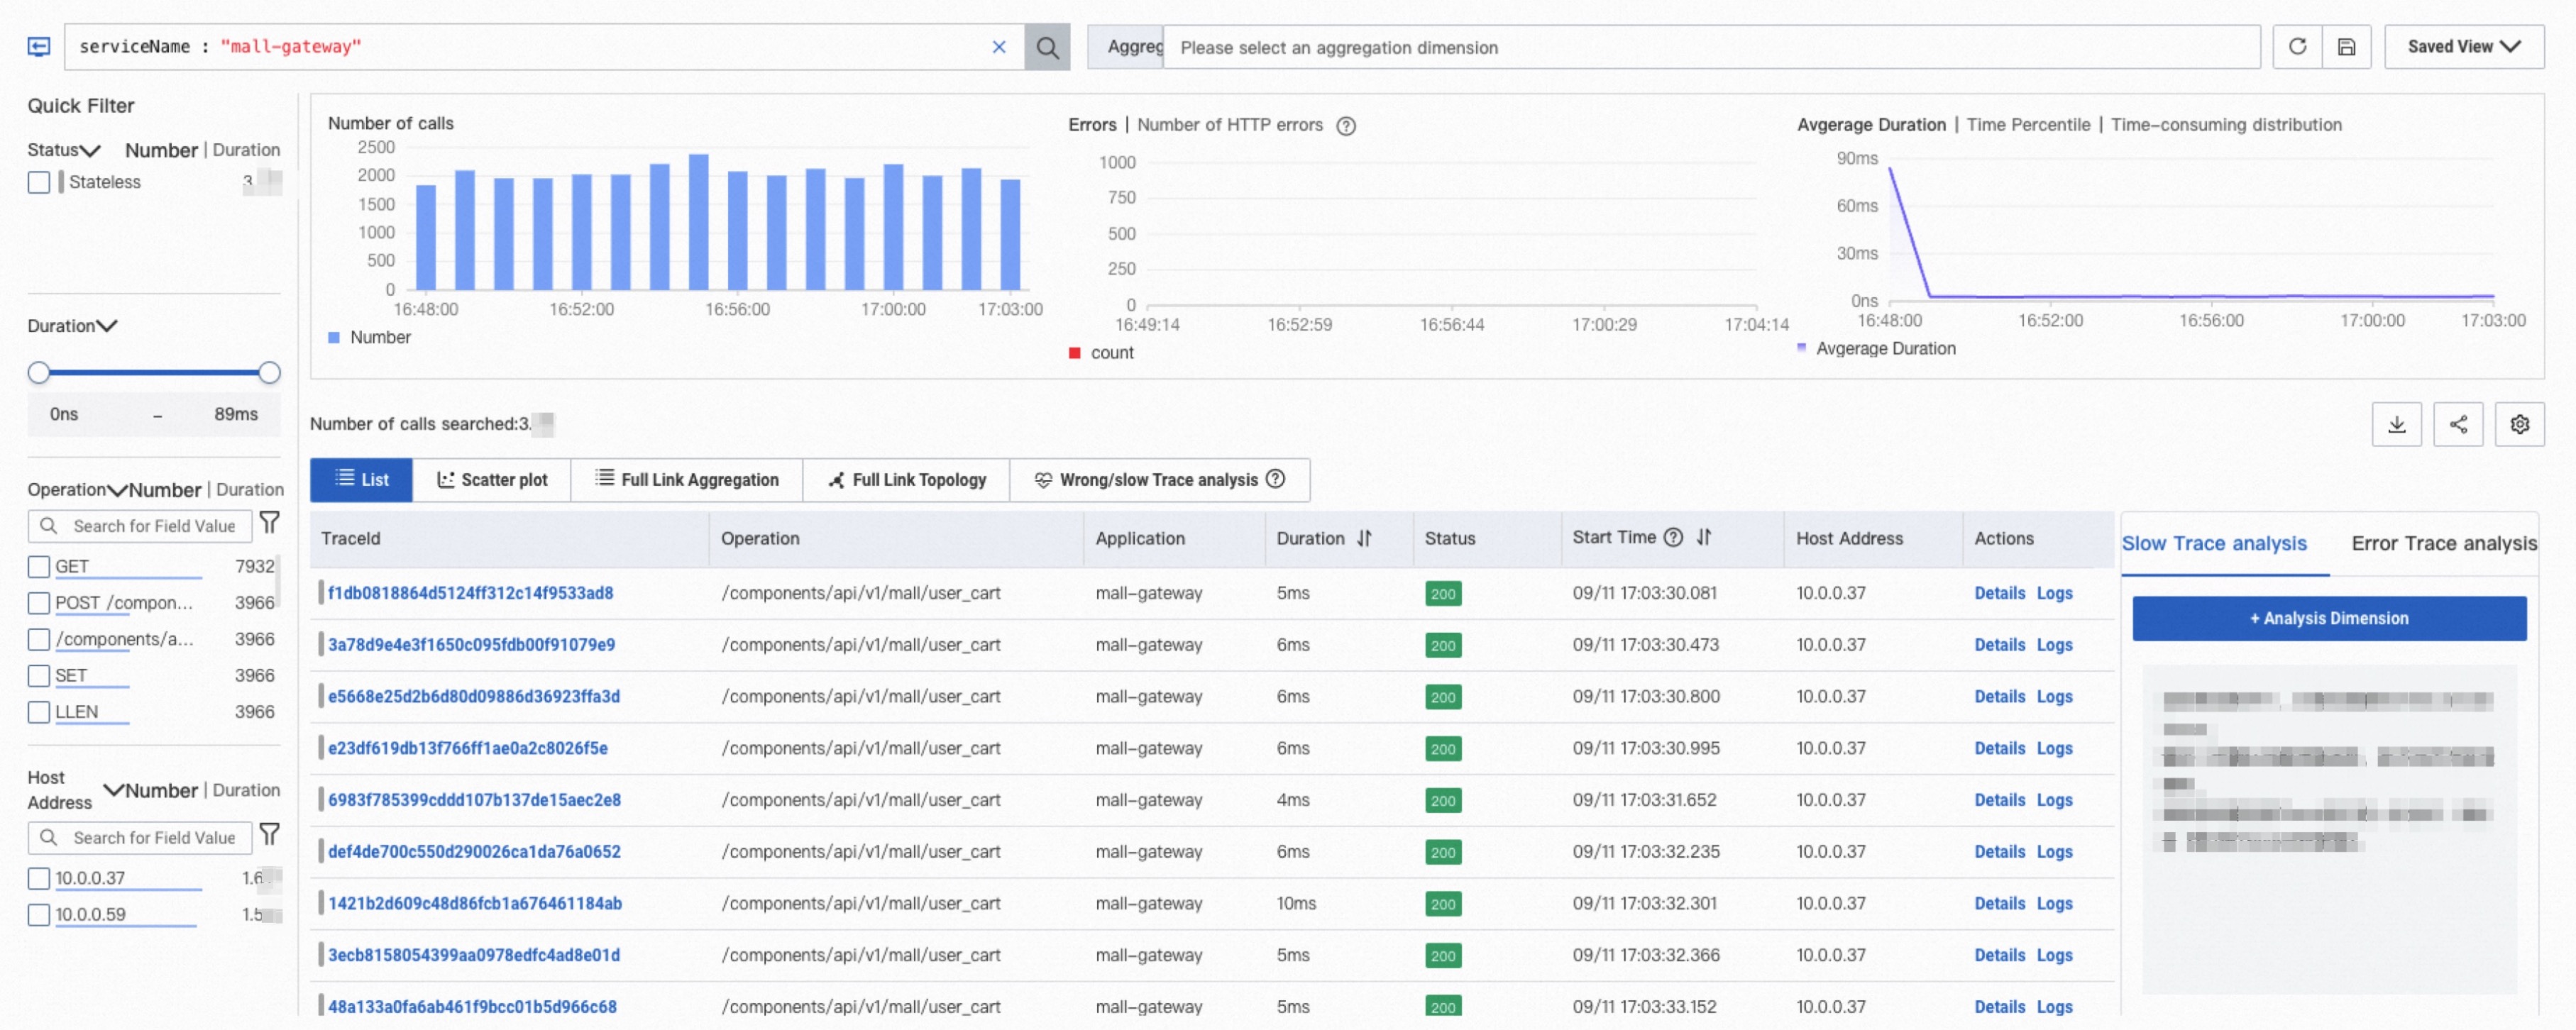
The page has three sections:
Quick filter (area 1)
Filter the charts and service list by Request Type, Operation, or Host.
Trend charts (area 2)
Display time series data for request count, error count, and average time consumed.
Click the
 icon to view metrics for a specific period or compare the same time window across different dates.
Click the
 icon to toggle between column chart and trend chart.
 icon to toggle between column chart and trend chart.
Service list (area 3)
Lists each service endpoint with its RED (Rate, Errors, Duration) metrics. Rate measures throughput, Errors tracks failed requests, and Duration captures response time.
| Action | Description |
|---|---|
| Click an interface name, Details, SQL analysis, or NoSQL analysis | Opens interface details |
| Click Traces | Opens Trace Explorer |
Supported frameworks
Interface details
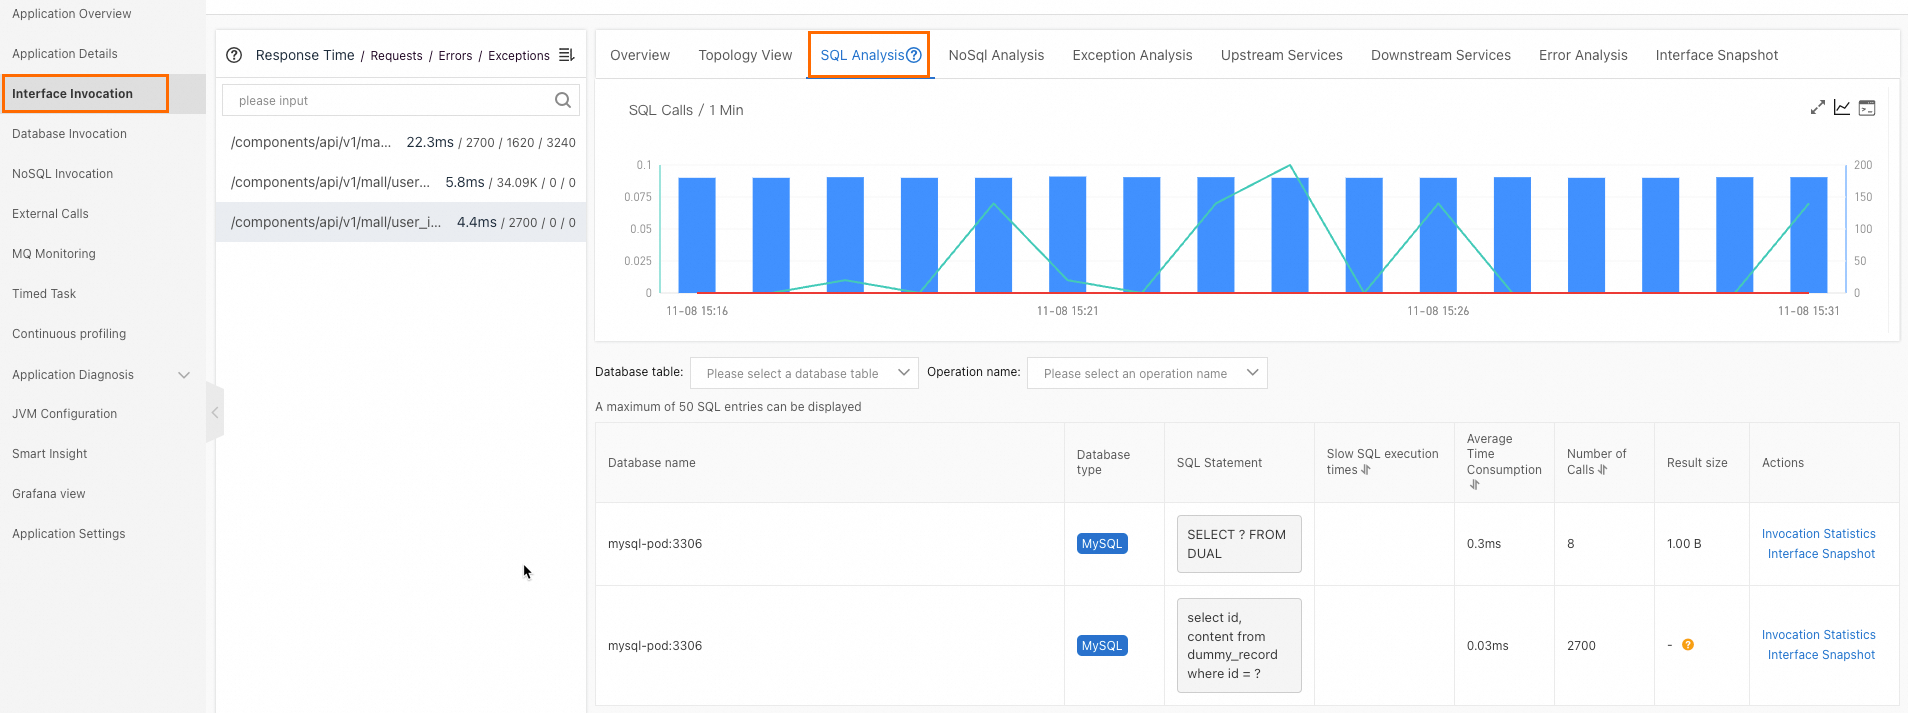
Click an interface name in the service list to open the details page. The available tabs depend on the request type.
Interface calls
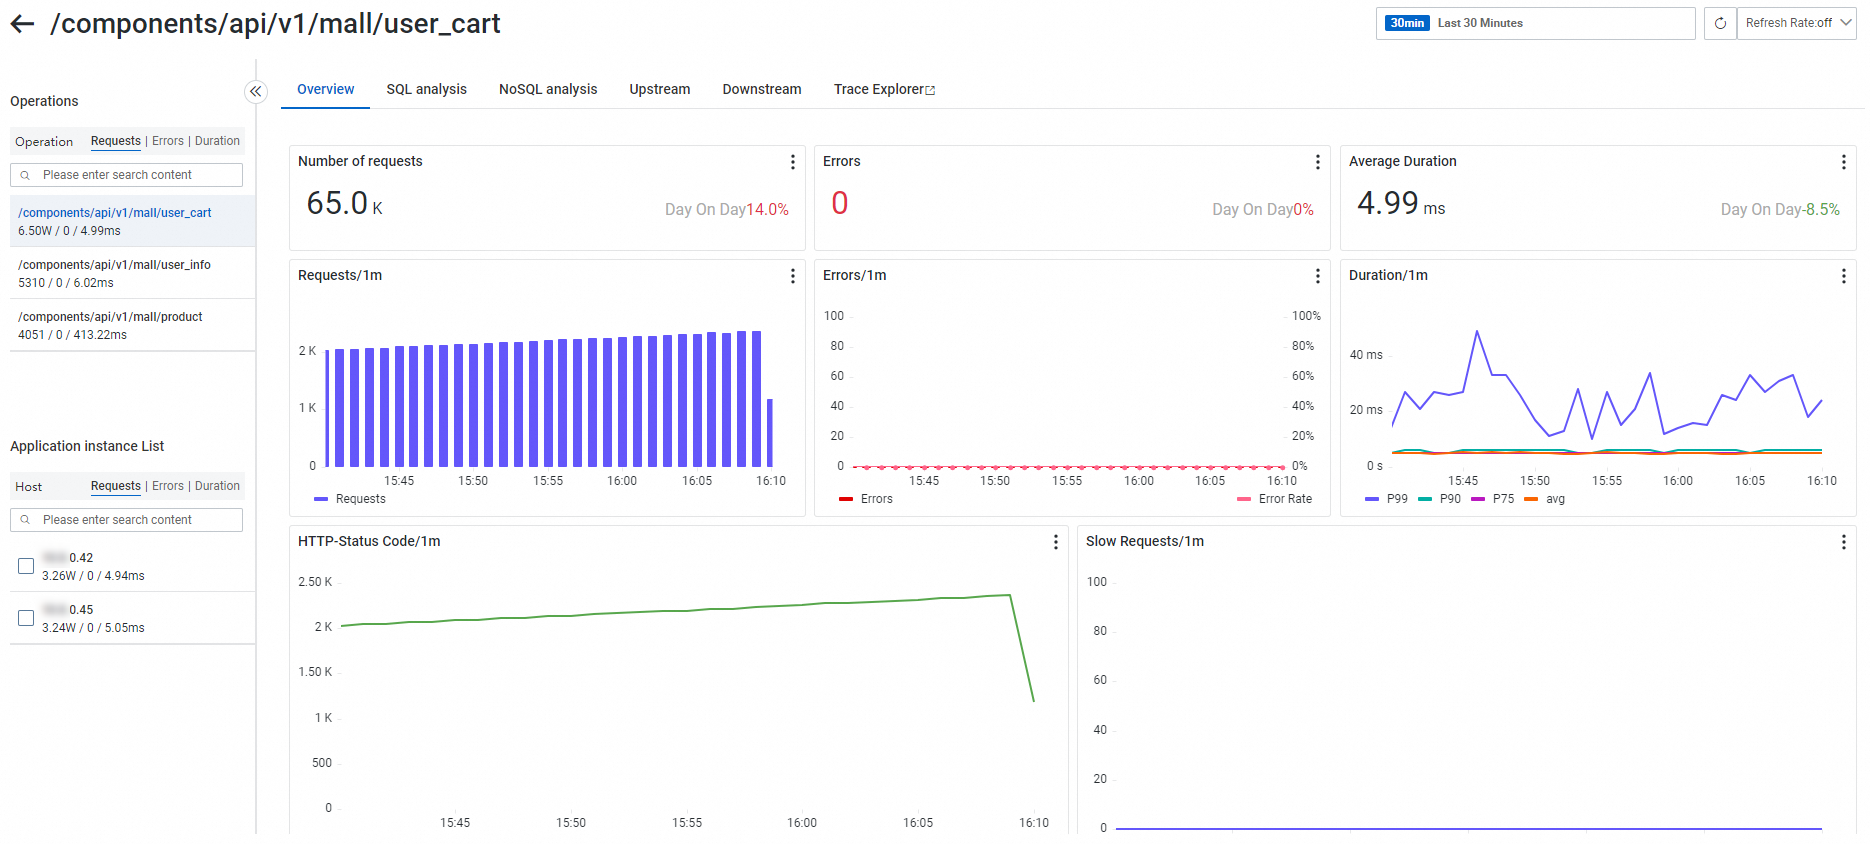
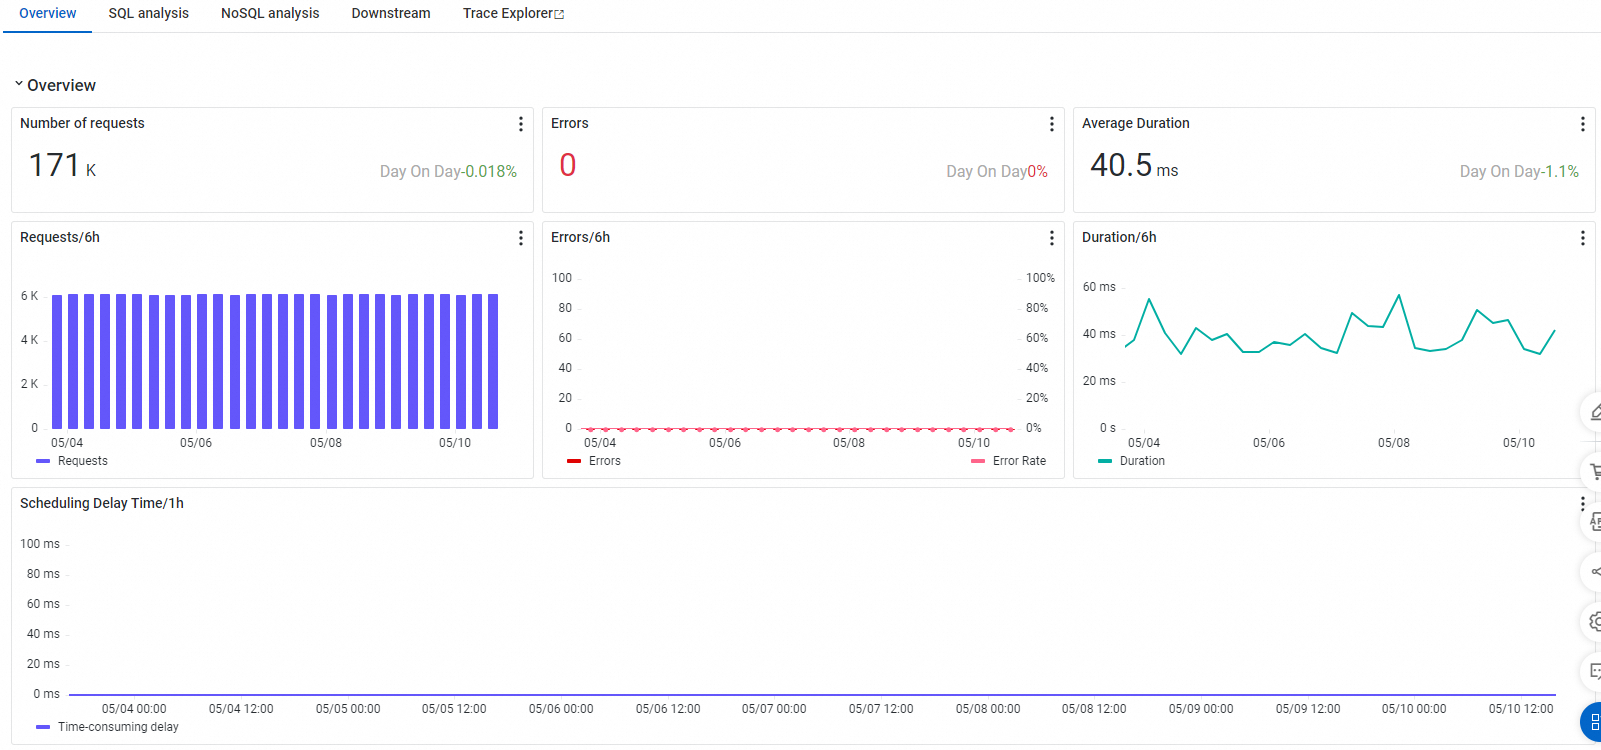
Overview
The Overview tab displays request count, error count, average duration, HTTP status codes, and a time series of slow calls.
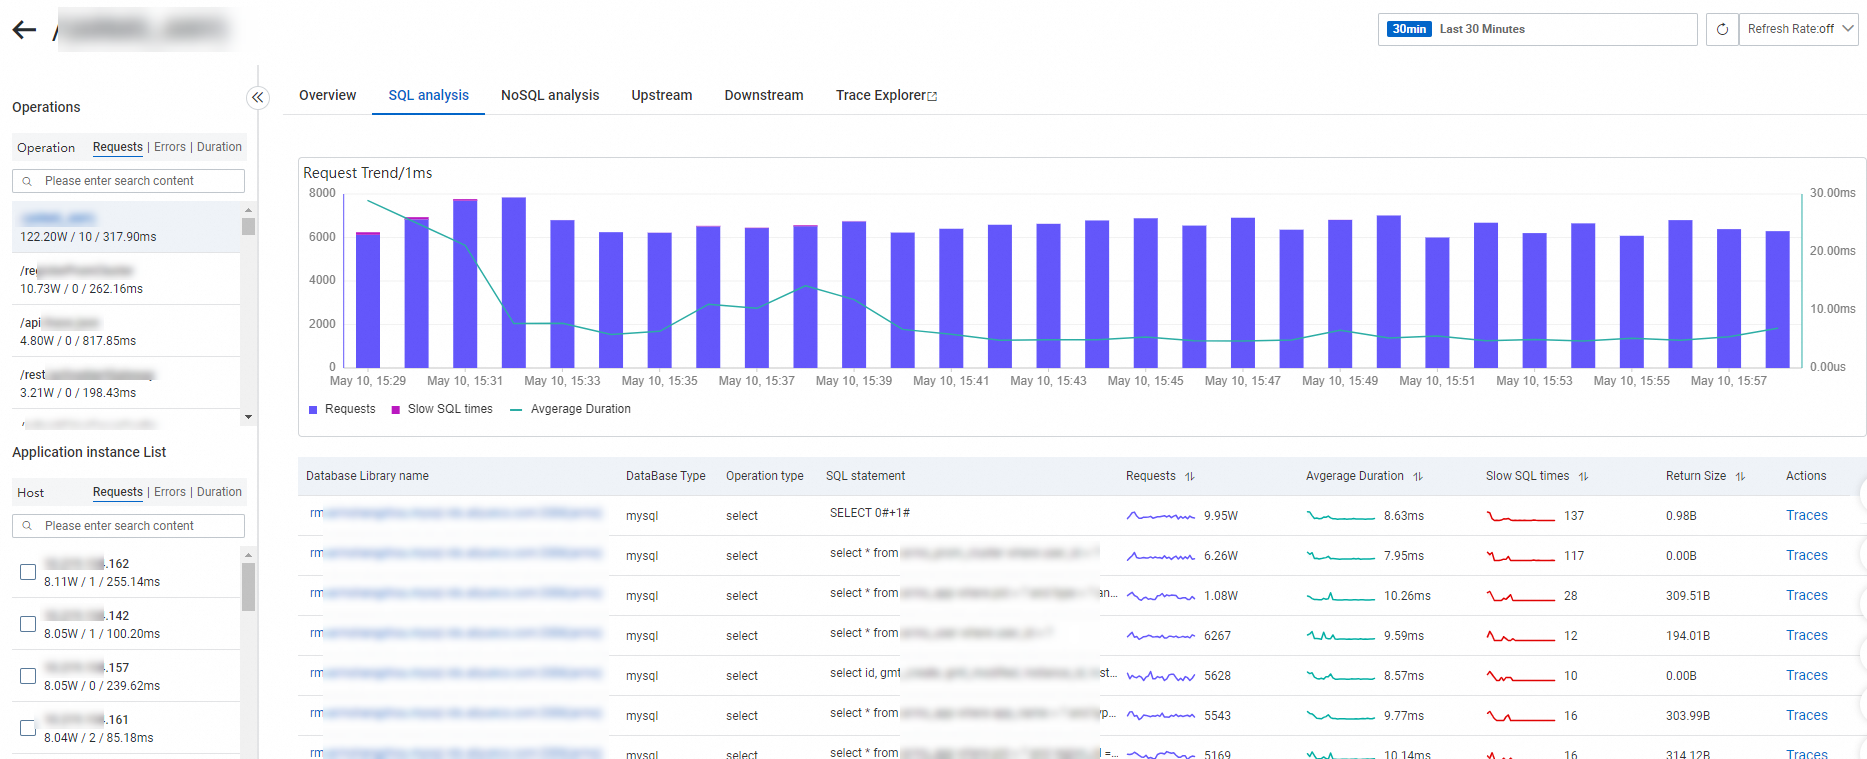
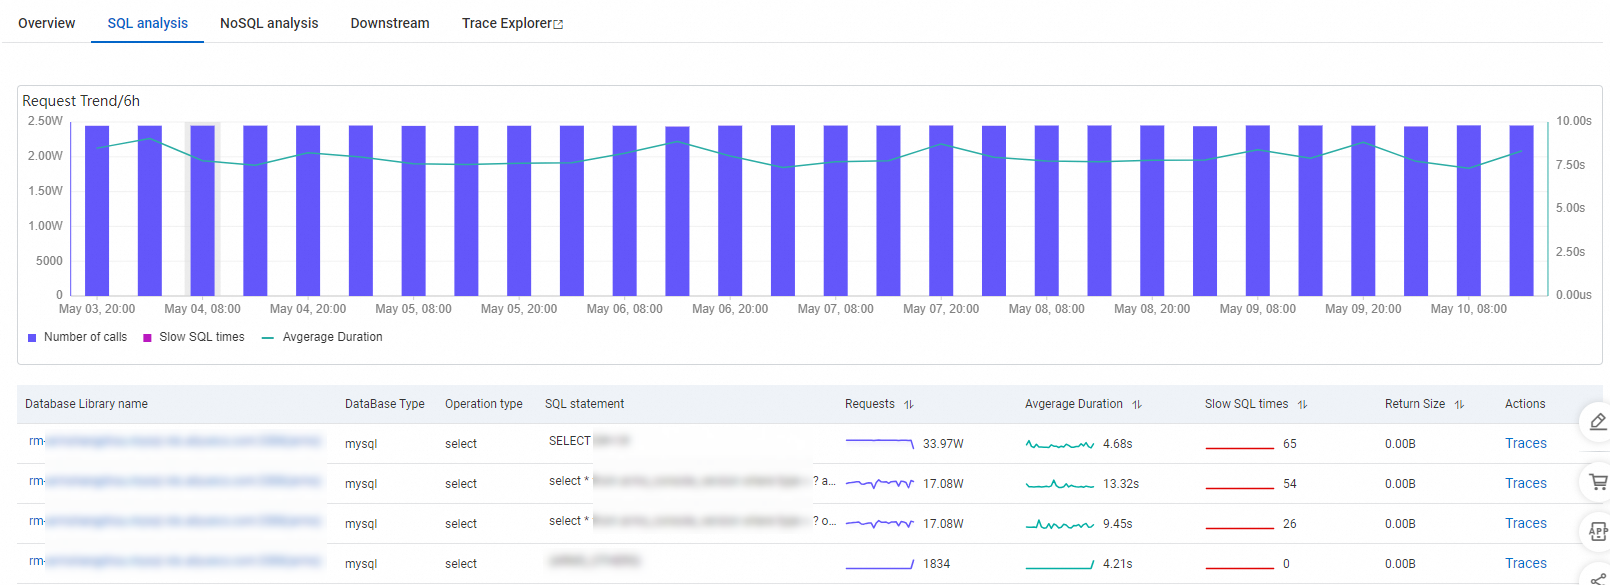
SQL and NoSQL analysis
The SQL analysis and NoSQL analysis tabs list database requests initiated by the interface, filterable by database host. Use these tabs to identify slow statements that cause high response times.
Click a database name to view its details.
Click Traces next to an entry to view the full execution trace in Trace Explorer.
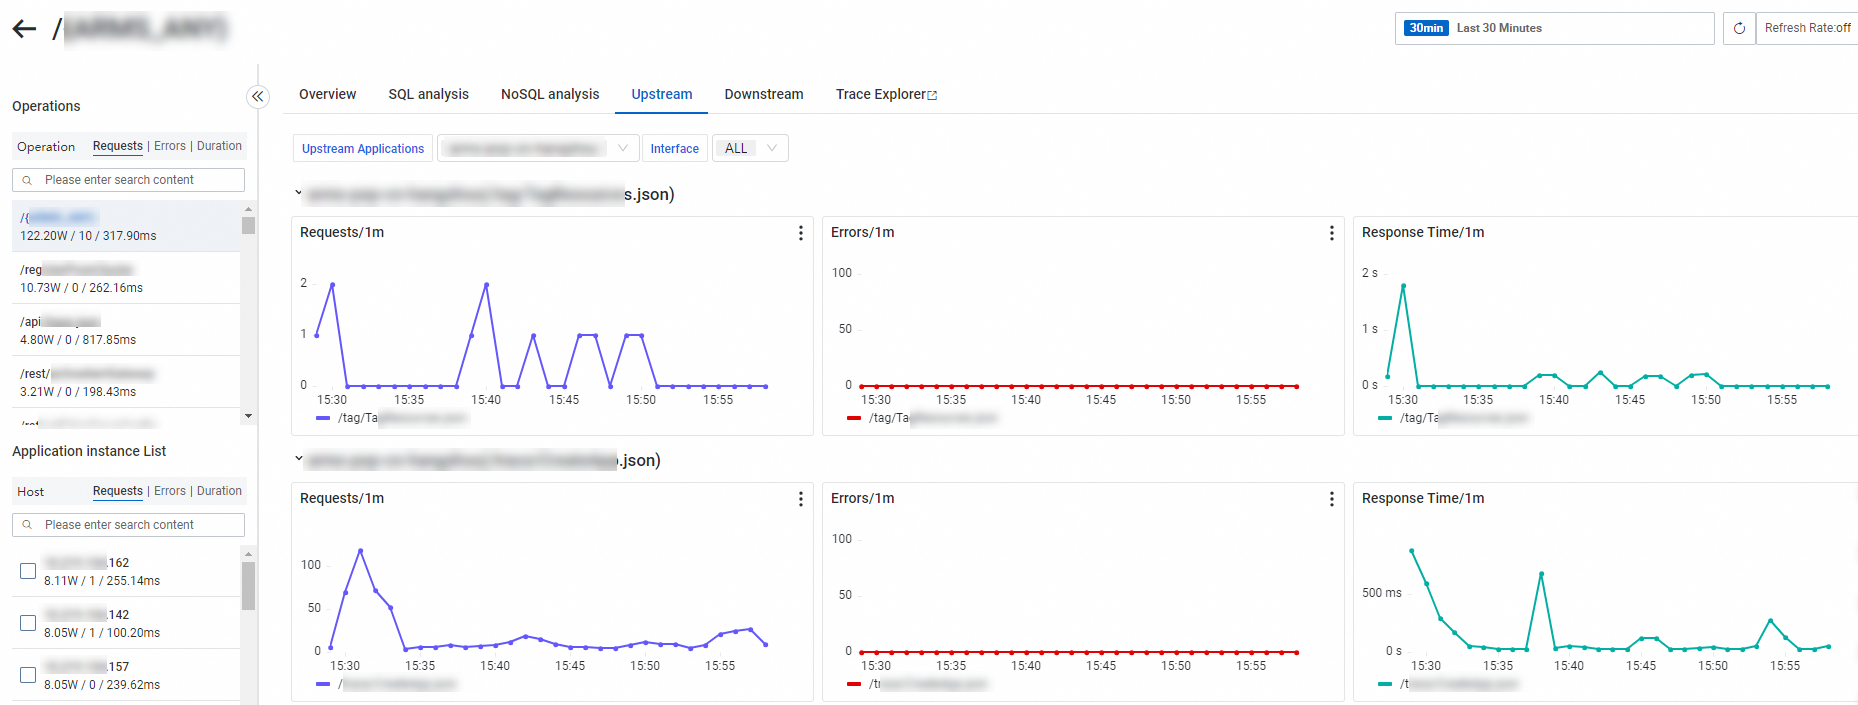
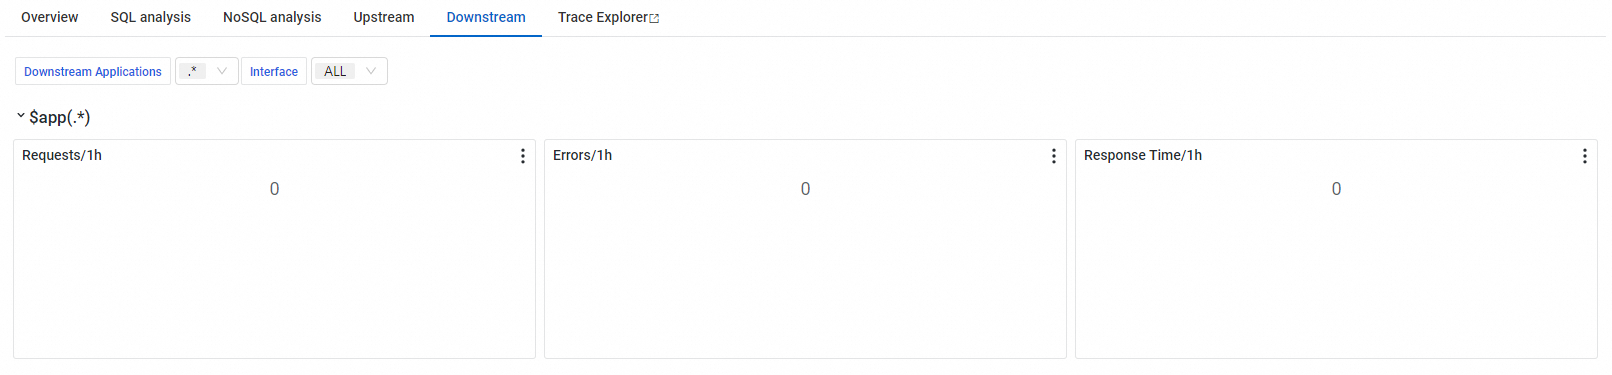
Upstream and downstream dependencies
The Upstream tab lists interfaces from applications that call the current application. The Downstream tab lists interfaces that the current application calls. Both tabs show request count, error count, and duration for each dependency.
Trace Explorer
Filter and aggregate stored trace data for custom diagnostics. See Trace Explorer.
Message subscription
Message subscriptions of Python applications cannot be viewed.
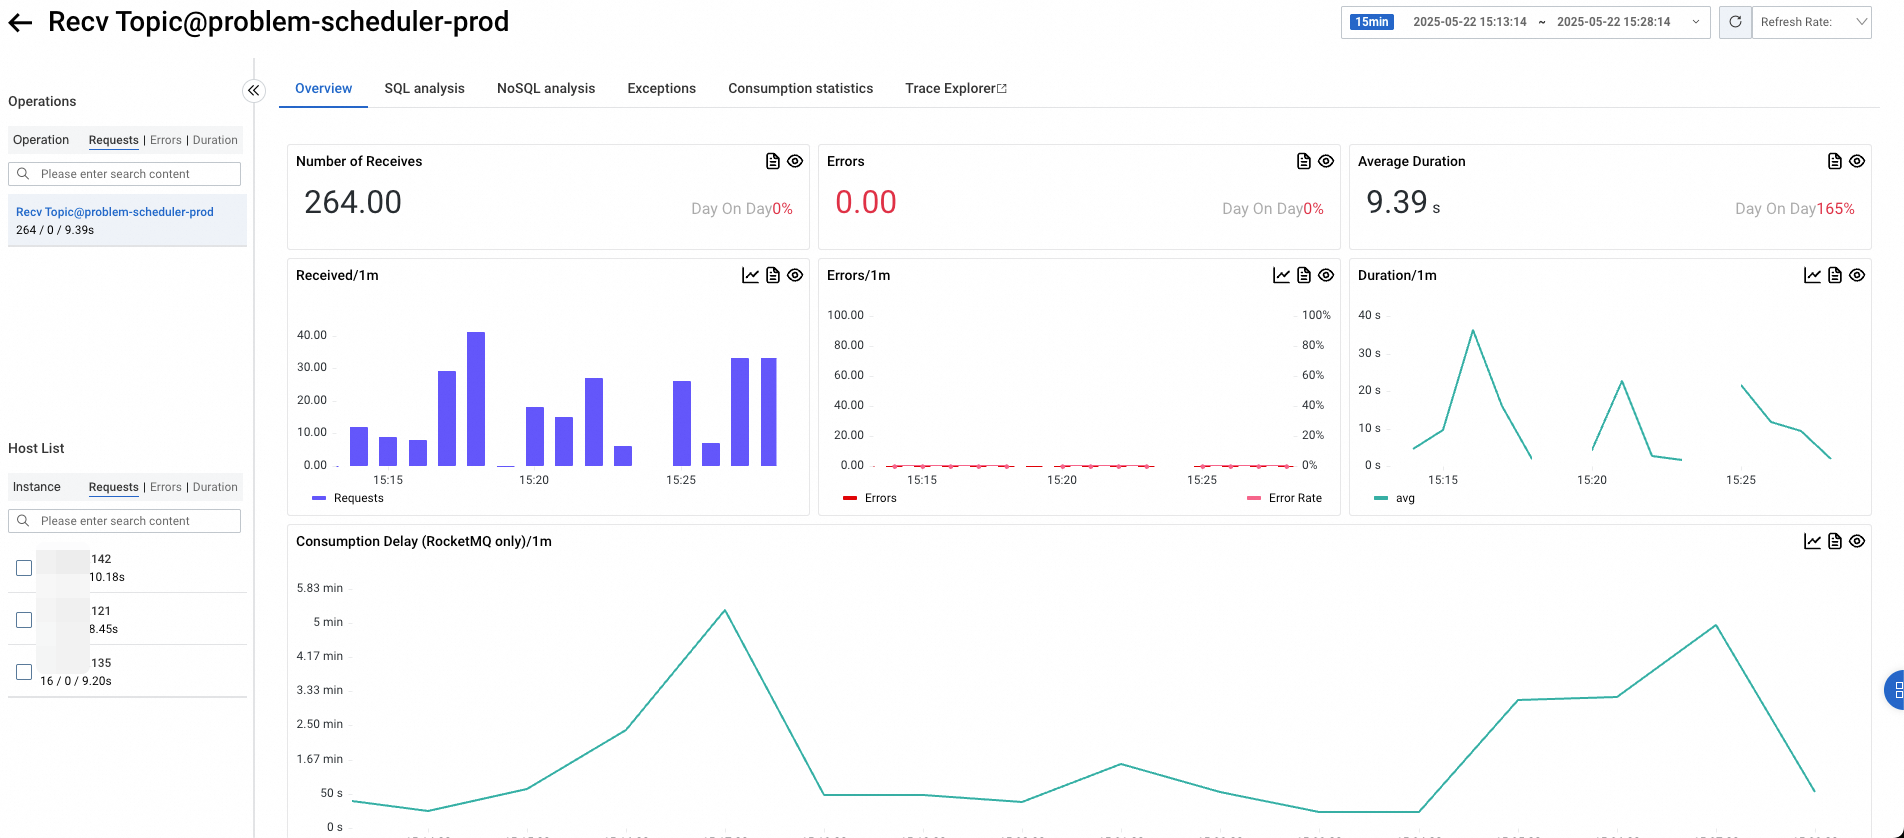
Overview
The Overview tab displays request count, error count, average duration, and consumption delay. Consumption delay is supported only for RocketMQ 4.8.0 and later.
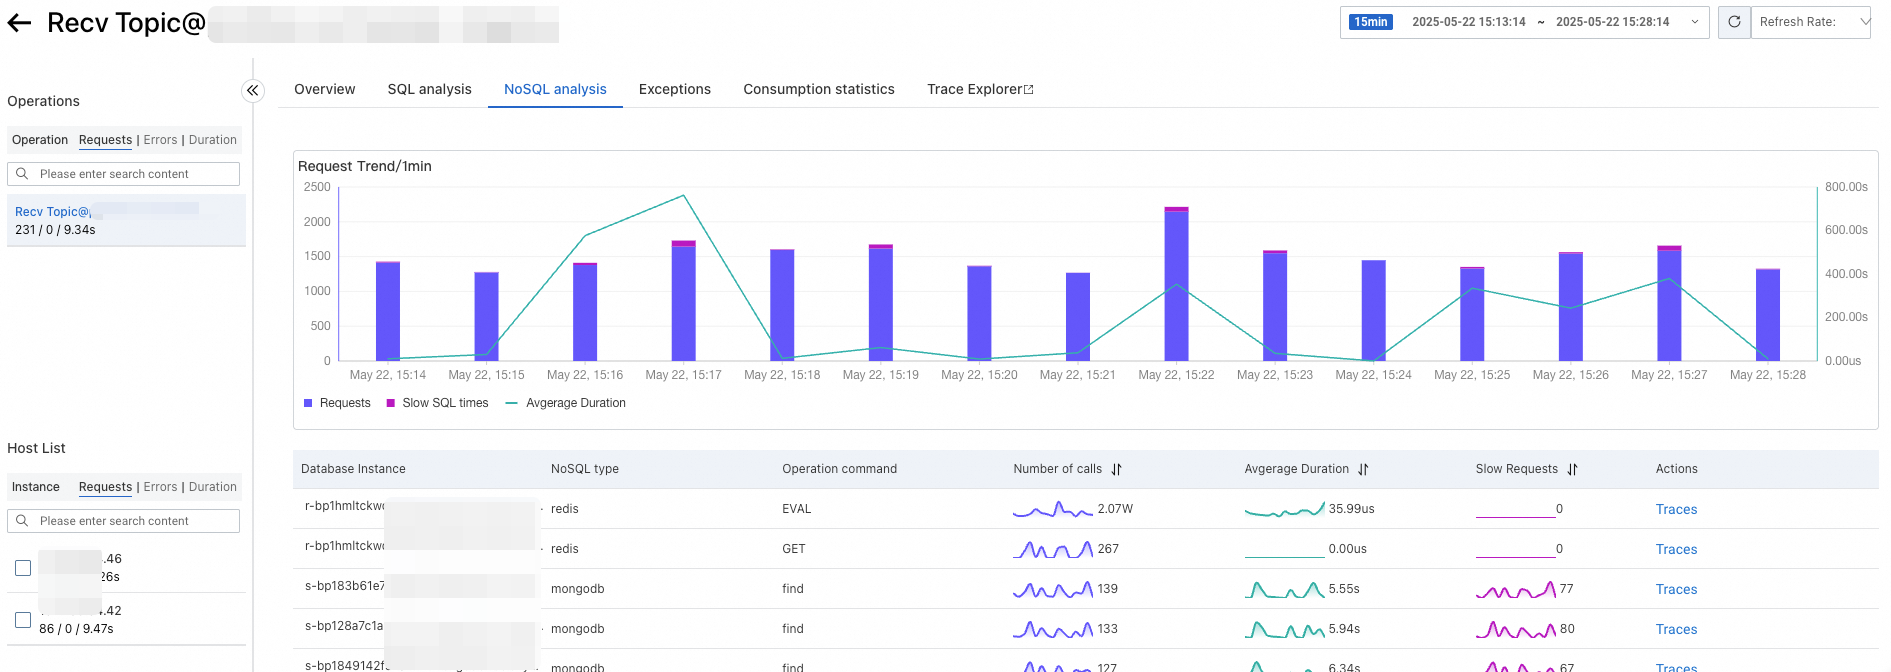
SQL and NoSQL analysis
The SQL analysis and NoSQL analysis tabs list database requests initiated by the interface, filterable by database host. Use these tabs to identify slow statements that cause high response times.
Click a database name to view its details.
Click Traces next to an entry to view the full execution trace in Trace Explorer.
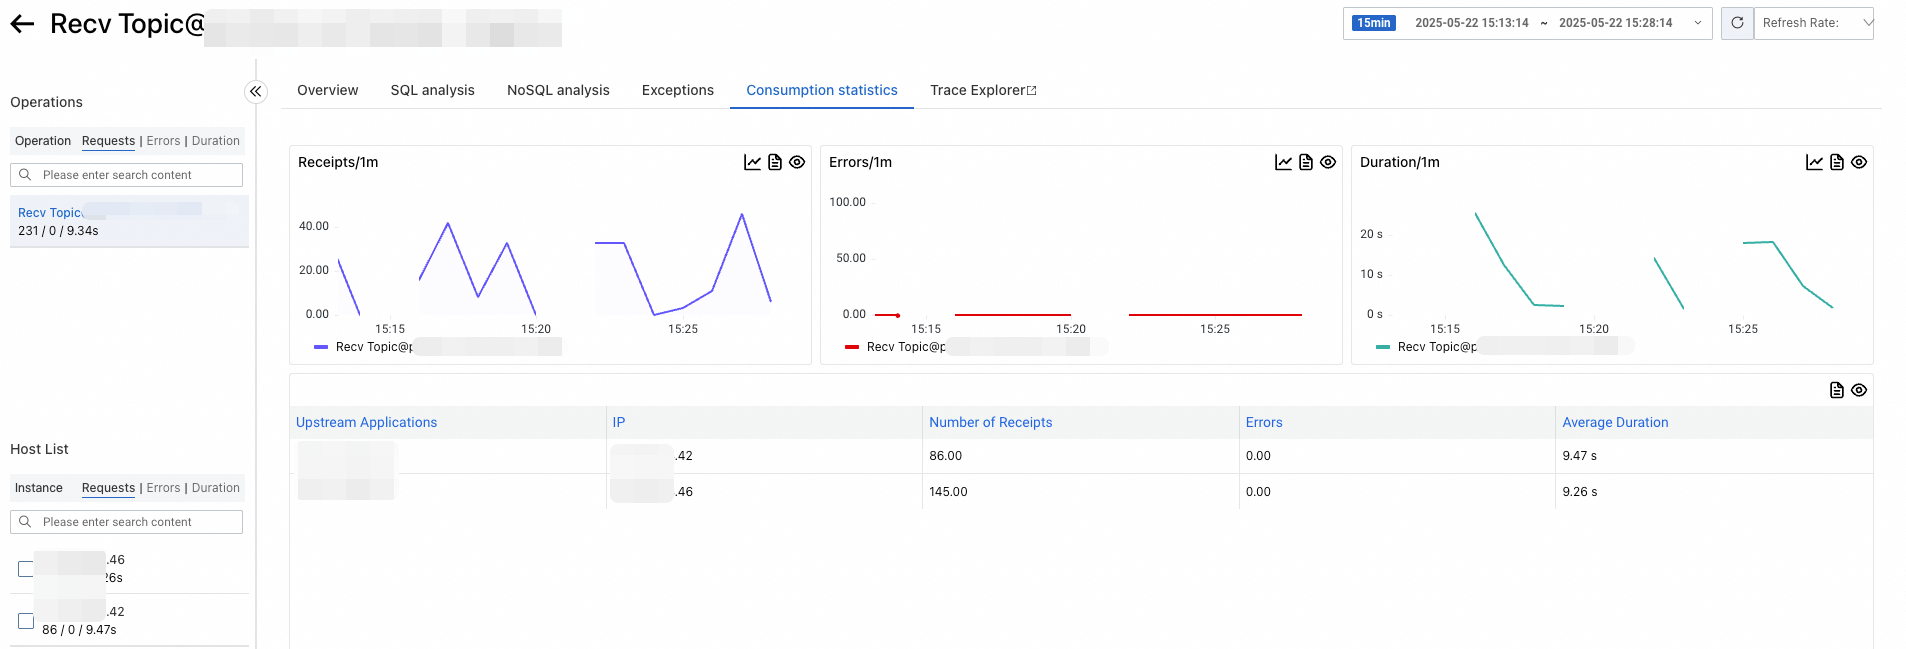
Consumption statistics
The Consumption statistics tab lists topic consumption details from the message consumer's perspective, including request count, error count, and duration.
Trace Explorer
Filter and aggregate stored trace data for custom diagnostics. See Trace Explorer.
Scheduled tasks
Only scheduled tasks of Java applications can be viewed.
Overview
The Overview tab displays request count, error count, average duration, and a time series of scheduling latency.
SQL and NoSQL analysis
The SQL analysis and NoSQL analysis tabs list database requests initiated by the interface, filterable by database host. Use these tabs to identify slow statements that cause high response times.
Click a database name to view its details.
Click Traces next to an entry to view the full execution trace in Trace Explorer.
Downstream dependencies
The Downstream tab lists the downstream applications that the scheduled task calls, along with request count, error count, and duration.
Trace Explorer
Filter and aggregate stored trace data for custom diagnostics. See Trace Explorer.
FAQ
Interface calls
What does the Upstream tab show?
The Upstream tab shows upstream services that call the current application and are monitored by an ARMS agent. If the application calls itself, it also appears as an upstream service.
Why are some upstream services missing?
Only services monitored by an ARMS agent appear on the Upstream tab. Unmonitored upstream services are not displayed.
Why is upstream and downstream service data incorrect?
If a SkyWalking component is installed in the trace, it is treated as the tracing protocol for the entire trace by default. The ARMS agent earlier than v4.2.x is not fully compatible with the SkyWalking protocol, which causes upstream and downstream service recognition errors.
Solution: Upgrade the agent to v4.2.x or later, or configure a protocol in the Call Chain Pass-through Protocol Settings section of the Custom Configurations page. See Trace context propagation protocol settings.
Why are traces of error calls missing?
The ARMS agent earlier than v3.2.x may not correctly record Dubbo trace status codes. Upgrade the agent to v3.2.x or later.
Why are traces of abnormal calls missing?
The ARMS agent earlier than v4.1.x records only traces of error and slow calls. Starting from v4.1.x, the agent also records traces of abnormal calls.
Why did interface traffic drop?
Determine whether the traffic actually dropped by checking for concurrent changes in metrics like CPU utilization and network I/O:
If traffic actually dropped, the cause is a decrease in service traffic.
If other metrics are unchanged, the ARMS server may have encountered errors. Submit a ticket for assistance.
Why is Spring Cloud Gateway traffic data incorrect?
The ARMS agent earlier than v4.x has instrumentation deficiencies for Spring Cloud Gateway. Upgrade the agent to v4.x or later.
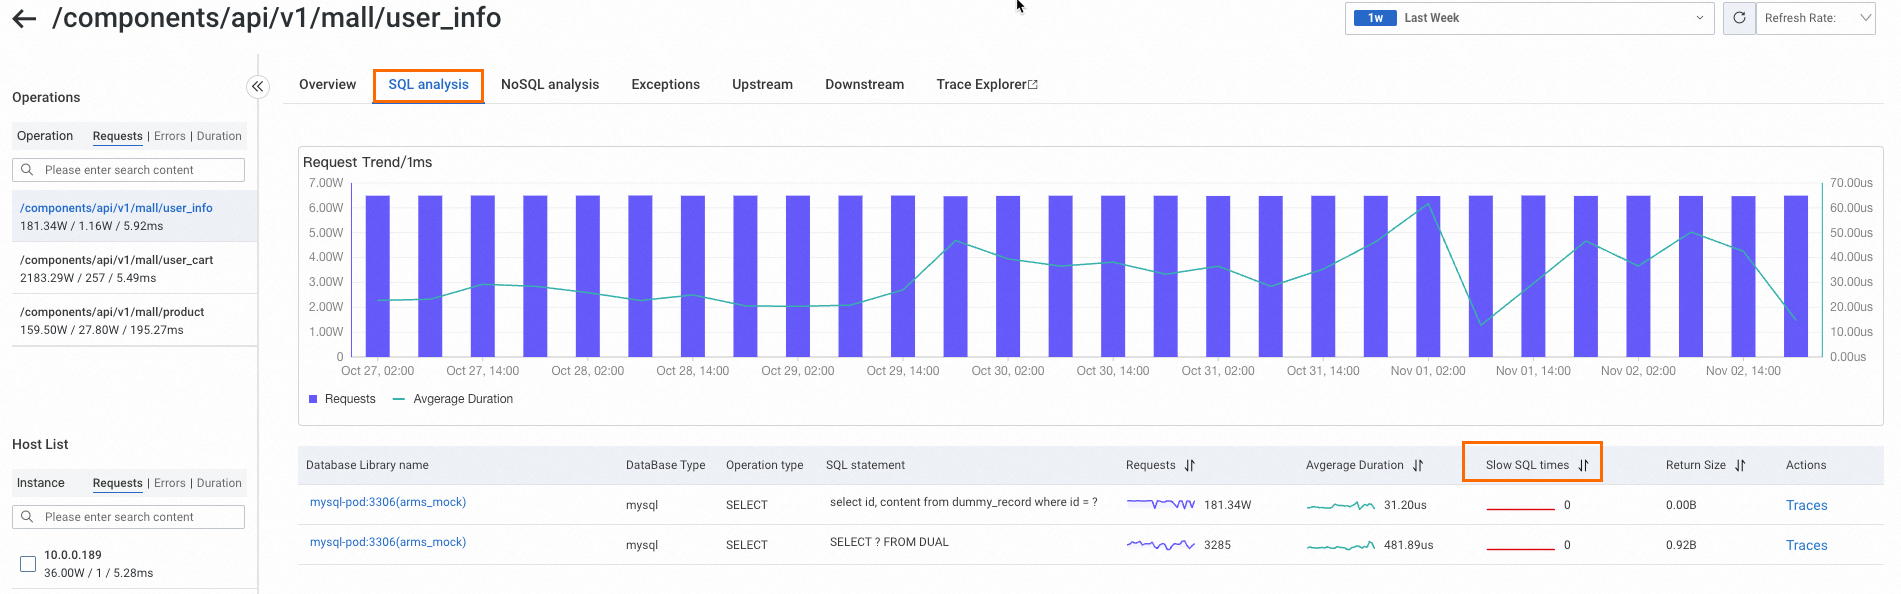
How do I find slow SQL statements for an interface?
New console
New console: On the monitoring details page, click the target interface name, then open the SQL Analysis tab.
Old console
Old console: Go to for the target application.
What does the yellow dot between interfaces mean on the old console?
Hover over the dot to see the details:
A yellow dot indicates a slow call. By default, calls that take more than 500 milliseconds are classified as slow. Change the threshold in the Interface call configuration section of the Custom Configuration page.
A red dot indicates an error call.
Why is some 5xx status code data not collected?
Per RFC 7231, status codes like 502 and 504 are error codes generated by gateways. These may not reflect the actual response codes of backend services. If only the backend services are monitored by an ARMS agent and the gateway itself is not, 5xx responses generated by the gateway are not tracked.
What is "NetWork And Dubbo Response Decode"?
A span that records the time spent on deserialization at the Dubbo transport layer.
Why do interface names contain characters such as * or ARMS keywords?
ARMS converges divergent interface names by replacing the varying parts of similar interface paths. See ARMS convergence policies.
Why are the external call duration and downstream service duration different?
The server-side duration measures how long the server takes to handle a request after receiving it. The client-side duration is measured from when the request is initiated and includes connection establishment and network latency. The ARMS console displays these two values separately, but the network latency component cannot be precisely determined.
Why is the exception count greater than 0 for a normal interface call?
Some frameworks (such as OkHttp3) throw exceptions internally that are caught by the framework itself. These exceptions do not affect business logic. Because ARMS instruments these frameworks, it also records these exception details. The exception statistics ignore the Message information of the exception.
To view the Message information of a specific exception, click the corresponding trace, then click the  icon next to the interface to view the exception in the method stack.
Why are some interface names /error, /404, /\*, and /\*\*?
ARMS displays these names when it cannot find an appropriate route for unexpected requests. Common causes:
A non-existent URL was requested.
Request verification failed due to invalid headers (for example, headers with invalid characters).
An HTTP server without routing configurations (such as Netty) was used.
Why does the Provided Services tab show different call counts than Trace Explorer?
Trace Explorer calculates data based on sampled trace data. The results vary with the sampling rate.
Why are the duration quantiles on the Provided Services tab different from Trace Explorer?
Quantiles on the Provided Services tab are calculated per machine using bucketing. Trace Explorer quantiles are calculated based on the duration of sampled spans. See ARMS metric quantile calculation.
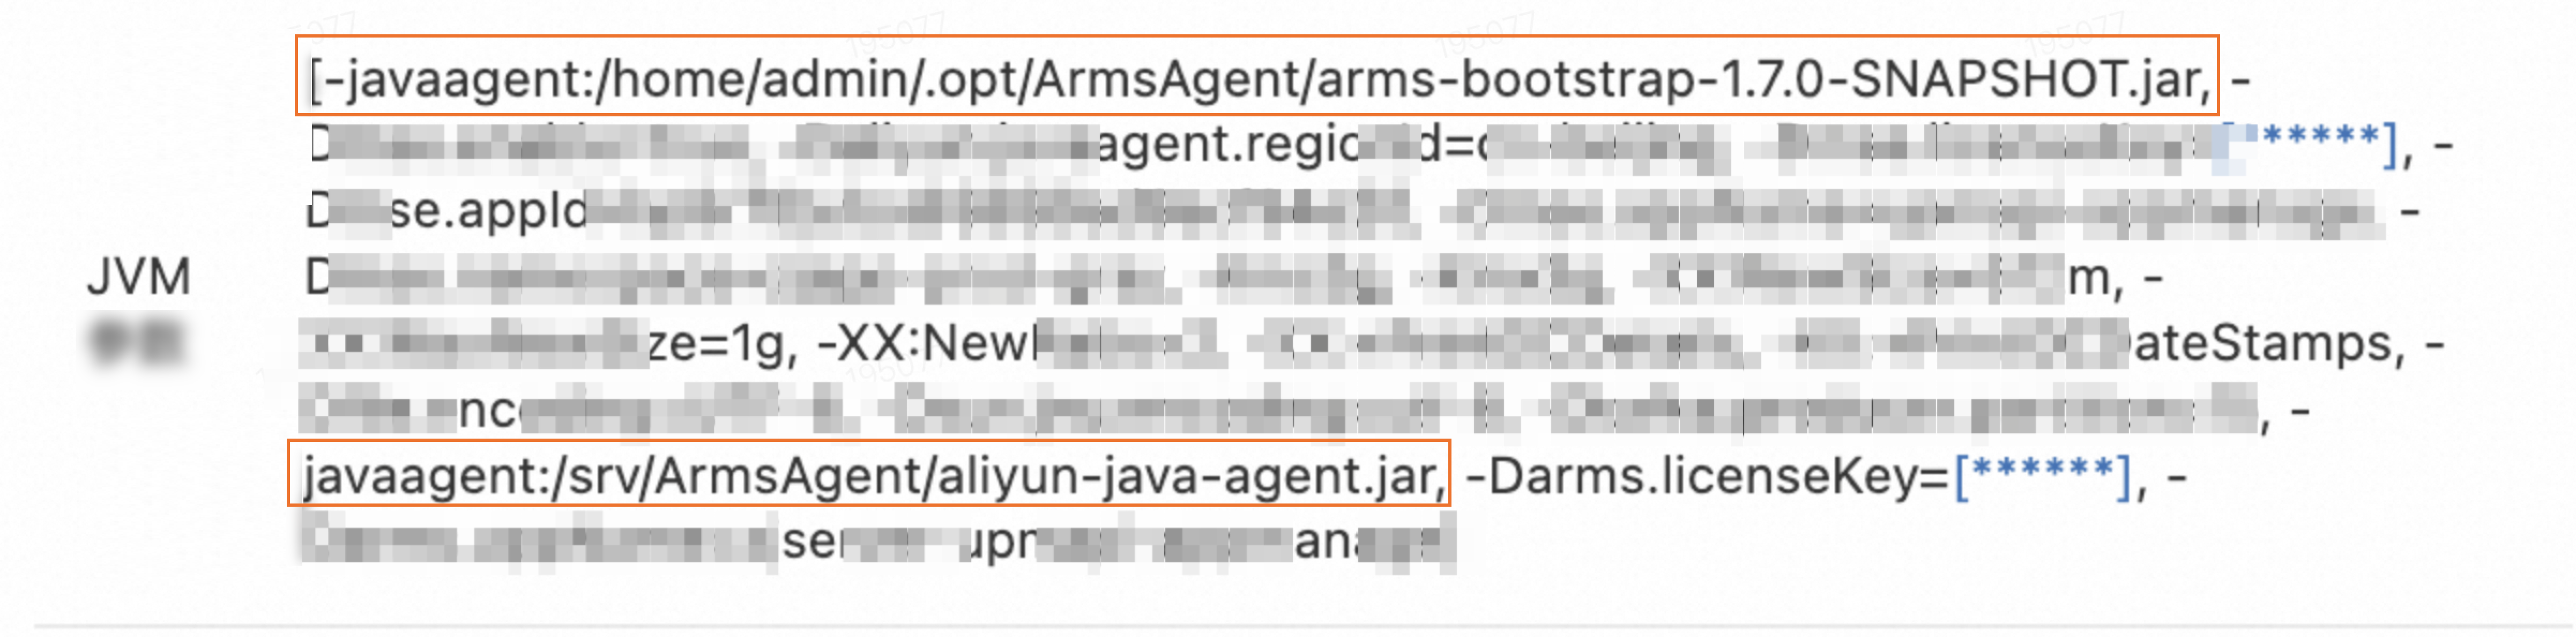
Why did interface calls increase by approximately two times?
This happens when both an ARMS agent v3.x and an ARMS agent v4.x are installed for the same application. To verify, go to , select any agent, and click View Details to check the JVM parameters.
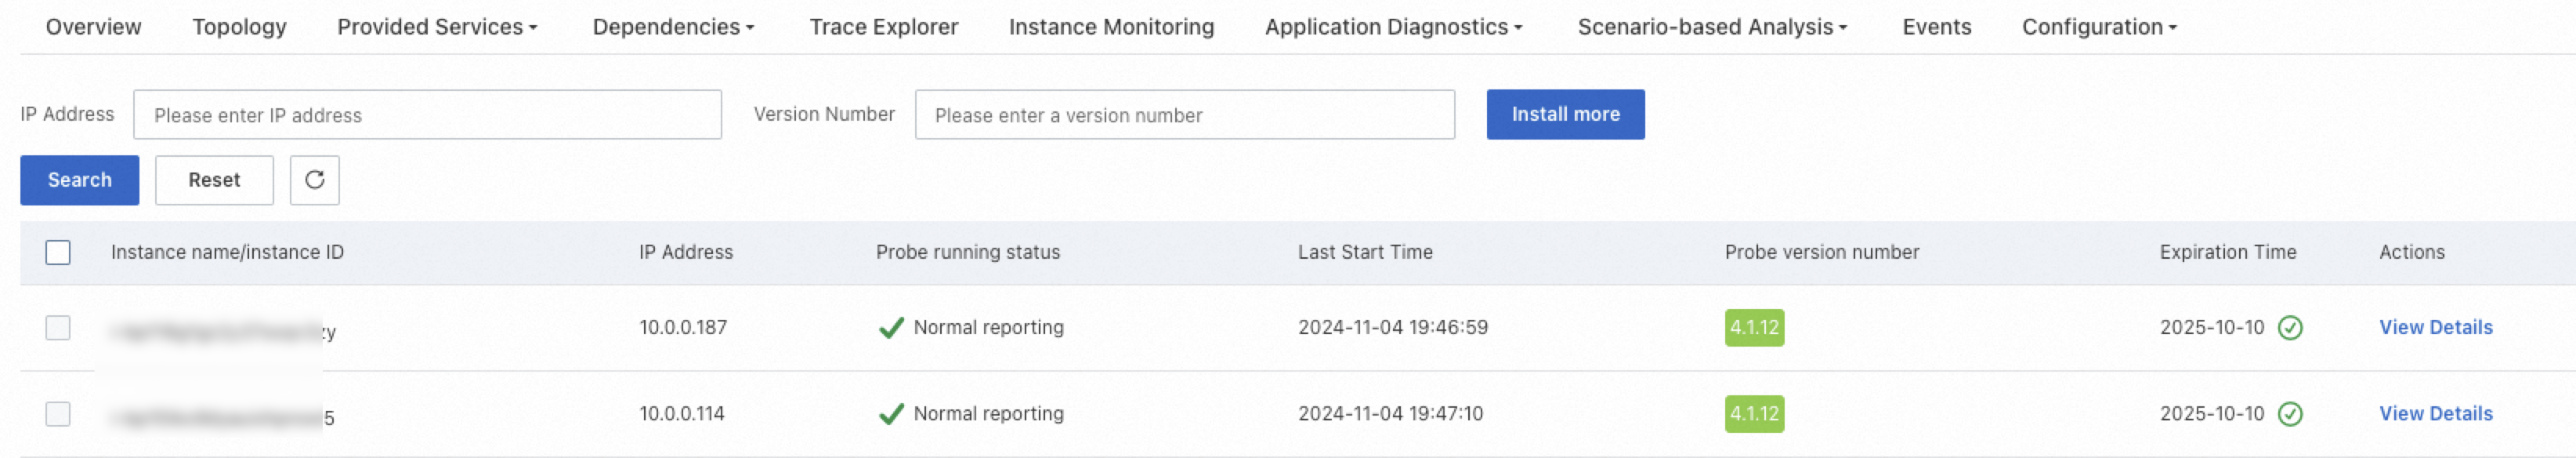
If two -javaagent parameters are present, both agent versions are installed.
Why is the call count in ARMS inconsistent with a third-party observability tool?
This can happen in several scenarios:
If ARMS shows 500 calls per minute while NGINX shows 200, traffic may be bypassing NGINX and reaching the application directly.
If ARMS shows 400 database calls per minute while the database reports 1,000 executions, other applications are likely accessing the same database. ARMS only counts calls from the specific monitored application.
How does ARMS support Spring WebFlux?
The ARMS agent earlier than v4.x supports only native Spring WebFlux and Spring Cloud Gateway. WebFlux-related plug-ins modified with custom web handlers (such as Apache ShenYu) are not supported.
Why do I see unfamiliar upstream applications that I cannot navigate to?
This is normal if your application provides services to external parties. The upstream application belongs to another user, creating a cross-user call relationship. ARMS records the application name and call count, but due to user isolation, you cannot view another user's application details.
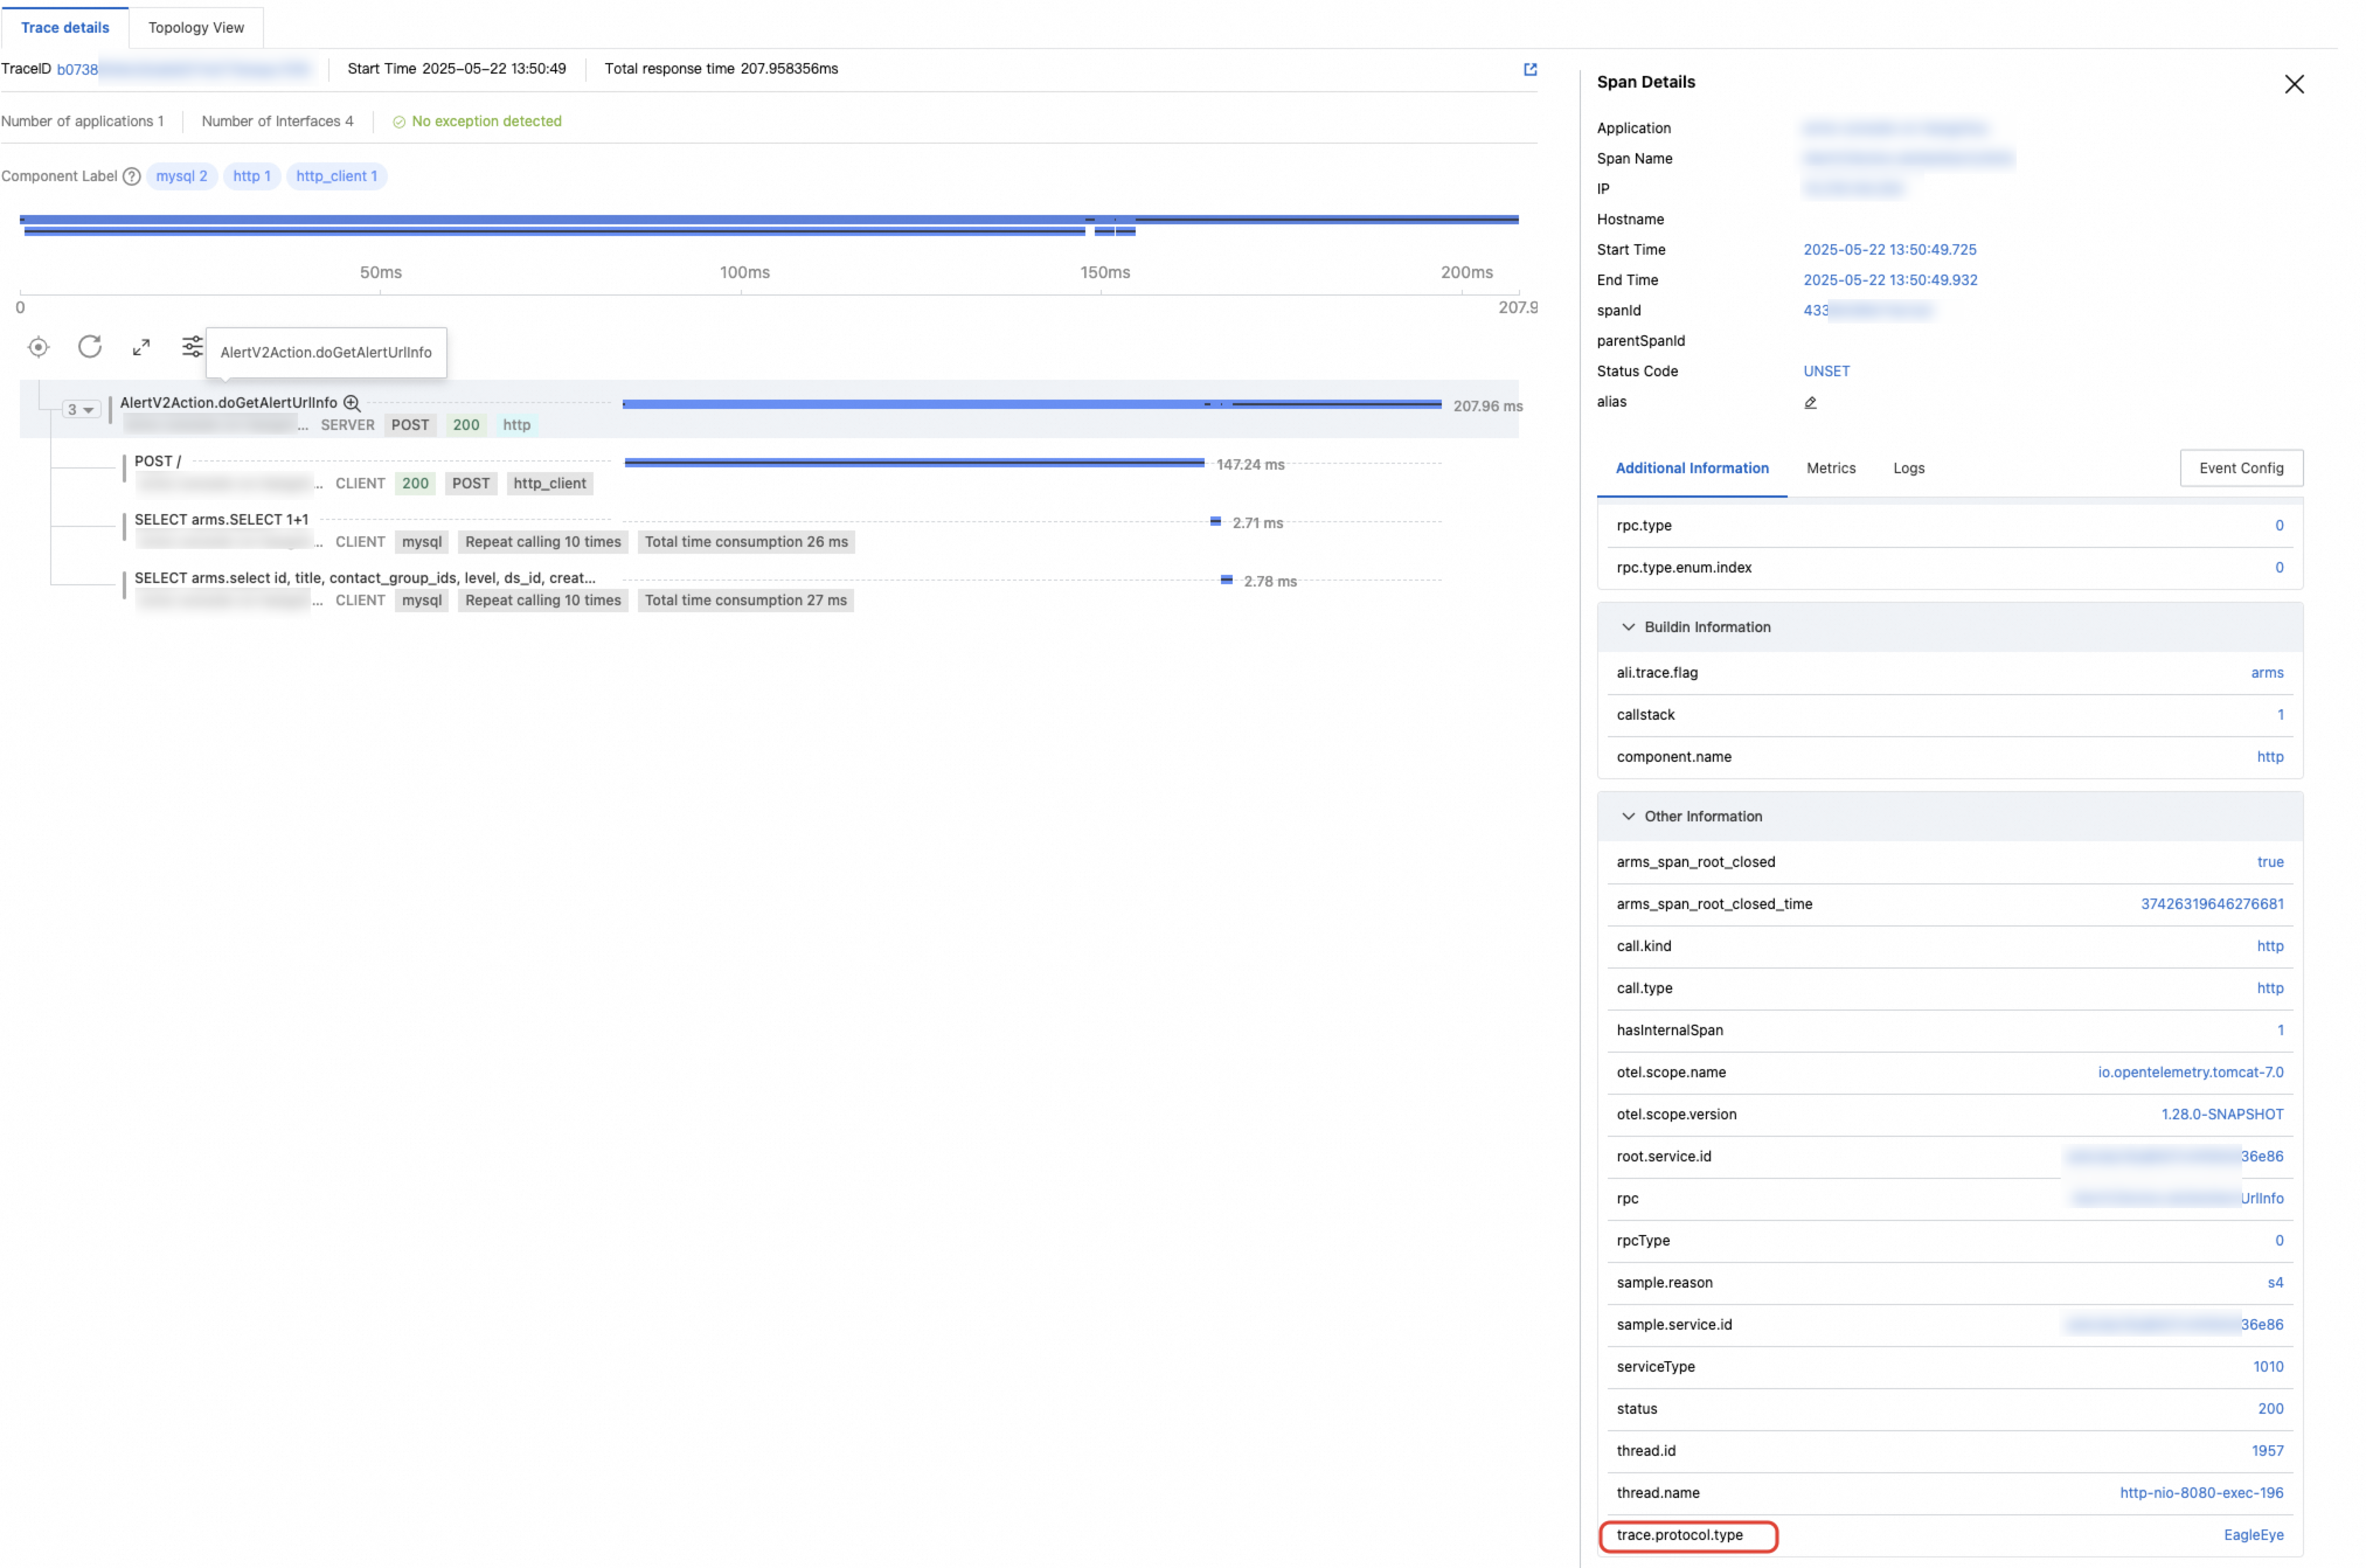
Why is upstream and downstream data missing when a clear call relationship exists?
ARMS checks the trace.protocol.type field recorded in the LocalRootSpan. If the value is Jager, upstream and downstream recognition fails due to case conversion issues.
Solution: Switch to another protocol or submit a ticket.
Message subscription
What is the difference between Message Subscription data and message queue instance monitoring data?
The Message Subscription and Message Publishing pages show performance metrics from the client's perspective (the application acting as a consumer or producer). The message queue instance monitoring panel shows performance metrics from the server's perspective (topic-level data).
Span name formats for sending and receiving messages
| Message type | ARMS agent earlier than v4.x | ARMS agent v4.x and later |
|---|---|---|
| RocketMQ/ONS message sending | No span is created. Only method stacks are recorded. | ${topic} + publish |
| RocketMQ/ONS message receiving | Recv Topic@${topic} | Recv Topic@${topic} |
| Kafka message sending | No span is created. Only method stacks are recorded. | ${topic} + publish |
| Kafka message receiving | Kafka/topic=${topic} | Kafka/topic=${topic} |
| RabbitMQ message sending | No span is created. Only method stacks are recorded. | ${exchange} + publish |
| RabbitMQ message receiving | Recv Exchange@${exchange} | Recv Exchange@${exchange} |
Does the ARMS agent for Java support Spring Cloud Alibaba RocketMQ?
Yes. The ARMS agent v4.x and later supports this framework. If the agent version is earlier than 4.x, upgrade it.
What is the "Message Delay" metric and what unit does it use?
Message delay measures the total time from when a message is produced to when a consumer processes it, in milliseconds. This metric is supported only for RocketMQ Client and ONS Client.
Why is consumer trace or metric data missing despite consumer logic being present?
The agent version is likely earlier than 4.x and lambda expressions are used to define the consumption logic in the messageListener. Lambda expression enhancement fails in agent versions 2.x and 3.x.
Upgrade the agent to v4.x to resolve this issue.
Why did I receive the "Magic v1 does not support record headers" error with Kafka?
The ARMS agent uses the Header field of Kafka messages to pass trace context. Kafka versions earlier than 0.11.0.0 (both Client and Broker) do not support Header fields.
Upgrade your Kafka Client and Broker to version 0.11.0.0 or later. If you cannot upgrade immediately:
For ARMS agent earlier than v4.x: disable the kafka-plugin switch in the Probe switch settings section on the Custom Configuration tab.
For ARMS agent v4.x and later: add the JVM parameter
-Dotel.instrumentation.kafka.producer-propagation.enabled=falsewhen starting the service.
Why are spans for sending or receiving messages missing in traces?
Verify that the message queue Client SDK used by your producer and consumer applications is supported by ARMS. See Java components and frameworks supported by ARMS.
Confirm that both producer and consumer applications are monitored by Application Monitoring or Managed Service for OpenTelemetry, with agent and plug-in switches enabled, and that they report to the same region.
If send spans are missing, check whether the producer's agent version is 4.x or later. In earlier versions, message sending does not generate a separate span but is recorded in the parent span's method stack. Click the
icon next to the parent span to view the method stack.If receive spans are missing, check whether Invalid Interface Filter is enabled in the Interface Call Configurations section of the Custom Configuration tab. This filter may exclude the spans.
 icon next to the parent span to view the method stack.
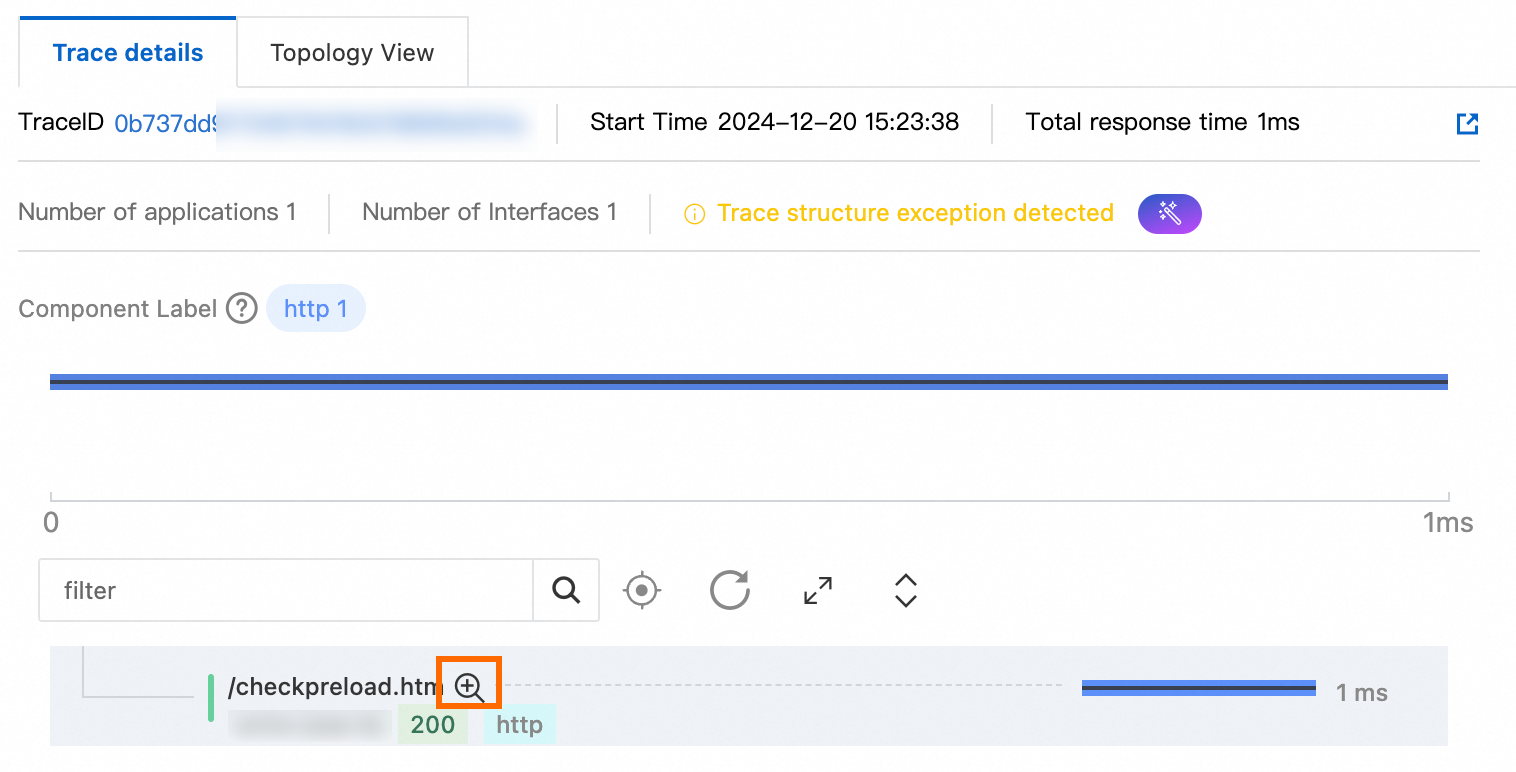
Why is there a large difference in Kafka response time between agent v4.x and earlier versions?
Symptom: Response time changed from several seconds to 0.x milliseconds.
In agent v3.x and earlier, a batch of messages processed through BatchMessageListener is counted as one call, with all processing time aggregated.
In agent v4.x and later, each message in the batch is counted as a separate call. As a result, the per-call duration drops significantly while the call count increases. This is expected -- the v4.x approach provides more accurate per-message metrics.
Why does Kafka consumption appear duplicated in traces?
If you use the batchMessageListener provided by spring-kafka, each message in a batch is recorded within the same Kafka consumption logic.
Batch consumption in spring-kafka can be configured in several ways:
Adding the
@KafkaListener(topics = "my-topic", batch = true)annotation to the consumption method.Implementing the
BatchMessageListenerinterface in the consumption method class.Enabling batch consumption mode in container properties:
containerProperties.setBatchListener(true).
Scheduled tasks
Why doesn't invalid interface filtering work for scheduled task interfaces?
Invalid interface filtering may not work for agent versions earlier than 3.2.0 or between 4.0.0 and 4.2.0. Upgrade the agent to version 3.2.10 or later, or to a version later than 4.2.0.
Why can't I see external call records in traces for scheduled tasks?
Troubleshoot based on the symptoms:
If the scheduled task call record is also missing, verify that the framework is supported. See Java components and frameworks supported by ARMS. Also check the agent switch settings.
If only external call records are missing and the agent version is earlier than 4.0.0, trace context propagation may fail in asynchronous scenarios. Upgrade the agent to version 4.0.0 or later, or configure automatic context propagation in the Advanced Settings.
Why is data from the xxl-job framework missing?
Agent versions earlier than 3.1.0 do not support the xxl-job framework. Upgrade the agent to a later version.
If you have customized the xxl-job code by modifying fully qualified class names (including class names and package names), agent instrumentation cannot match those classes. In this case, add custom instrumentation using the OpenTelemetry Java SDK.